
Chapter 12
Advanced Techniques and Further Resources
![]() Debugging
Debugging
![]() Unit Testing
Unit Testing
![]() Additional Resources
Additional Resources
The jQuery library does a lot of work, but once you have your code in place, it is a good idea to test the code to ensure that it does what it needs to do. In this chapter, you will look at methods that can be used for debugging and testing your code, which can help you develop coding standards for your team or organization.
First, you will look at some tools available for debugging JavaScript/jQuery code. Next, you will look at some tools that allow you to perform unit testing on your code. Finally, you will be given some resources to enhance your knowledge of JavaScript/jQuery should you choose to pursue it further.
Debugging
Often, code doesn’t quite work as intended. While some issues are easy to resolve, others may require quite a bit more time and effort to get fixed. There are numerous methods and tools you can use to debug your code; and you will cover some of these in this section.
Simple Alerts
For some issues, using the JavaScript alert() method can be a handy way to quickly see where the problem may be. You can use alert() to pop up one or more values to see if they are the type of values you are expecting (a number, a string, a Boolean, and so on).
For example, suppose you are having an issue where you are trying to add one to a number, but you’re getting unexpected results. For example, consider the following code:

Running this code, you will likely find that the show() method seems to be moving at a pace that is much quicker than you had intended (which should be 1200 milliseconds). It appears that something is not working correctly. Either the show() method is receiving a much lower number than intended, or it is receiving a string that it does not recognize and is thus simply displaying it with its default time delay.
In this case, you can probably see the problem already, but if there were more code separating the variable definitions and the function call, this might not be as immediately apparent. Here, you can see what value is being sent to the show() method by alerting the value of the time variable just prior to your use of show(), as in the following code:
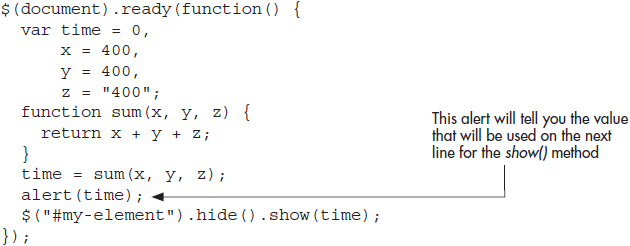
When this code is run, you will receive an alert with a value of 800400! Figure 12-1 shows an example of how this alert may display from a browser.
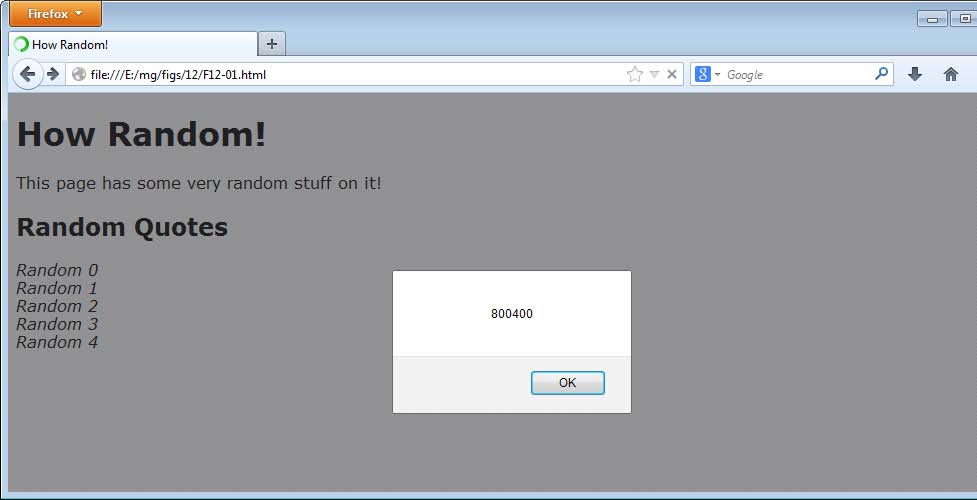
Figure 12-1 The alert displayed when the code is run
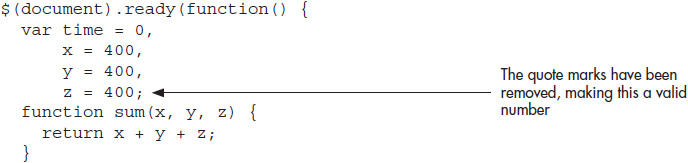
Since show() is not working at an incredibly slow speed of 800,400 milliseconds, it looks like this must be a string value that is causing show() to use a default time. Going back to the function you call to set the time, you will see that it appears to be OK. It simply adds the values sent to it: x, y, and z. This should lead you to check the values of those variables. When you do, you will notice that the value for z is enclosed in quotes, which is making it a string value. This means that JavaScript will add 400 + 400 + ″400″: The first two will be added as numbers (giving 800), while the last will be added as a string that will concatenate the numeric 800 with the string ″400″, giving you ″800400″.
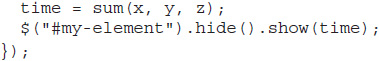
To fix this, you can simply remove the quote marks from the value of the z variable and the show() method will work as expected. This is shown in the following code, which fixes the issue and removes the alert:
Browser Developer Tools
All of the major browsers now offer their own set of developer tools that can be opened from the browser menu or via one or more shortcut keys (depending on the tool you want to open). Each of these tools offers a JavaScript console, which can aid you in debugging JavaScript/jQuery code. They also offer tools to help you find DOM nodes, look at your HTML, test CSS code, and more.
Which one you use may depend on your browser of choice. However, if you test in multiple browsers (which is a good practice), you may become familiar with each one of them as you work on different projects. Figure 12-2 shows the “Web Console” in Mozilla Firefox (Firefox Menu | Web Developer | Web Console). Figure 12-3 shows the “Developer Tools” when opened in Google Chrome (Menu | Tools | Developer Tools).
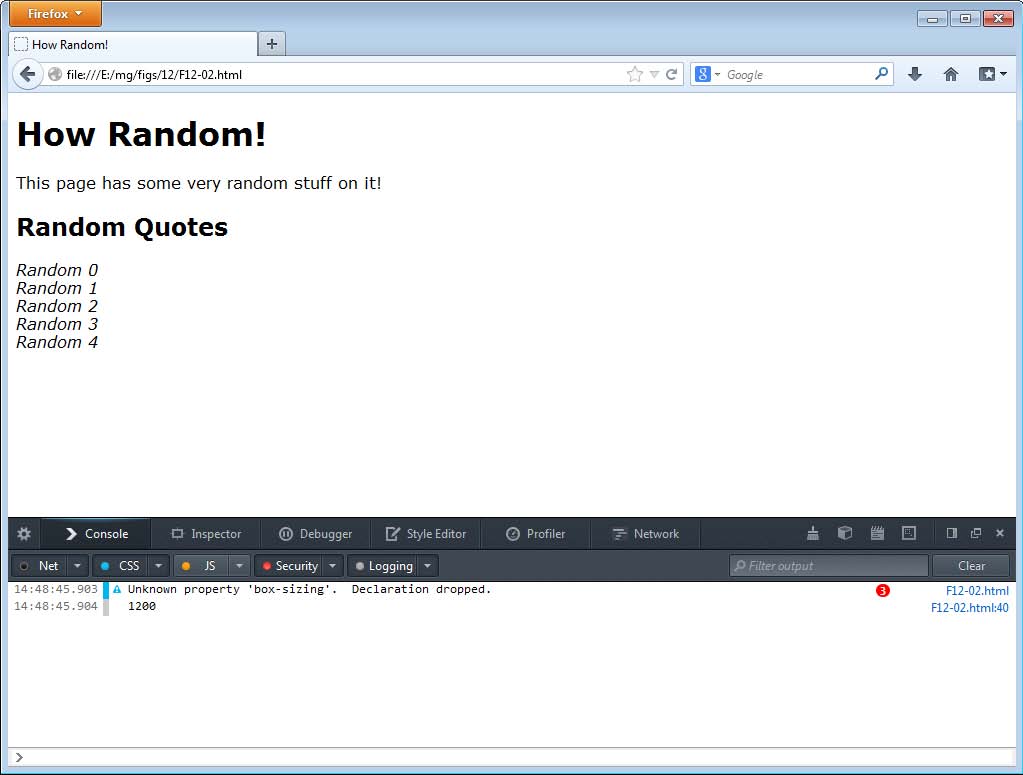
Figure 12-2 Firefox Web Console
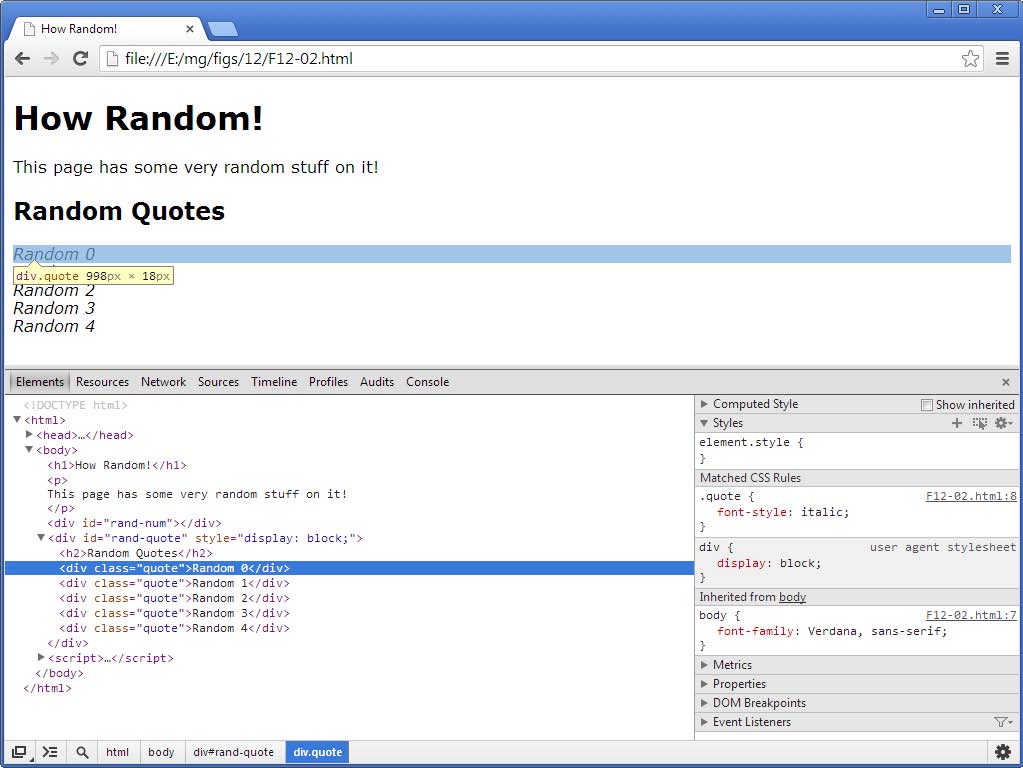
Figure 12-3 Chrome Developer Tools
No matter which you choose, you can use it to help you figure out where any issues may be in your code (whether HTML, CSS, or JavaScript/jQuery). For JavaScript/jQuery, each one offers a JavaScript console, which you can use to log values or display information as needed while developing or debugging.
For example, using the console.log() method in JavaScript, you could simply display a value on the console screen when needed. In many cases, this is far more convenient than an alert, because it does not interrupt the task at hand with an alert pop-up box. Instead, the value can be sent to the console for you to view while still having the code run as normal otherwise.
You can alter the code you used for an alert to log the same value to the console, as shown in the following code:
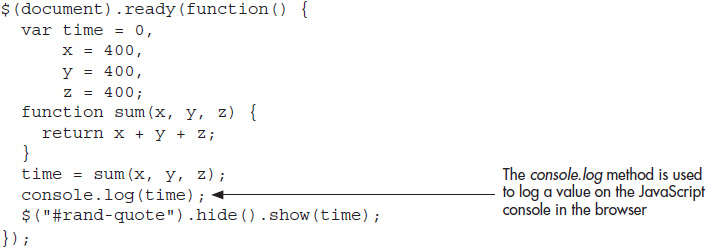
Figure 12-4 shows how this looks when displayed in the Google Chrome JavaScript console.
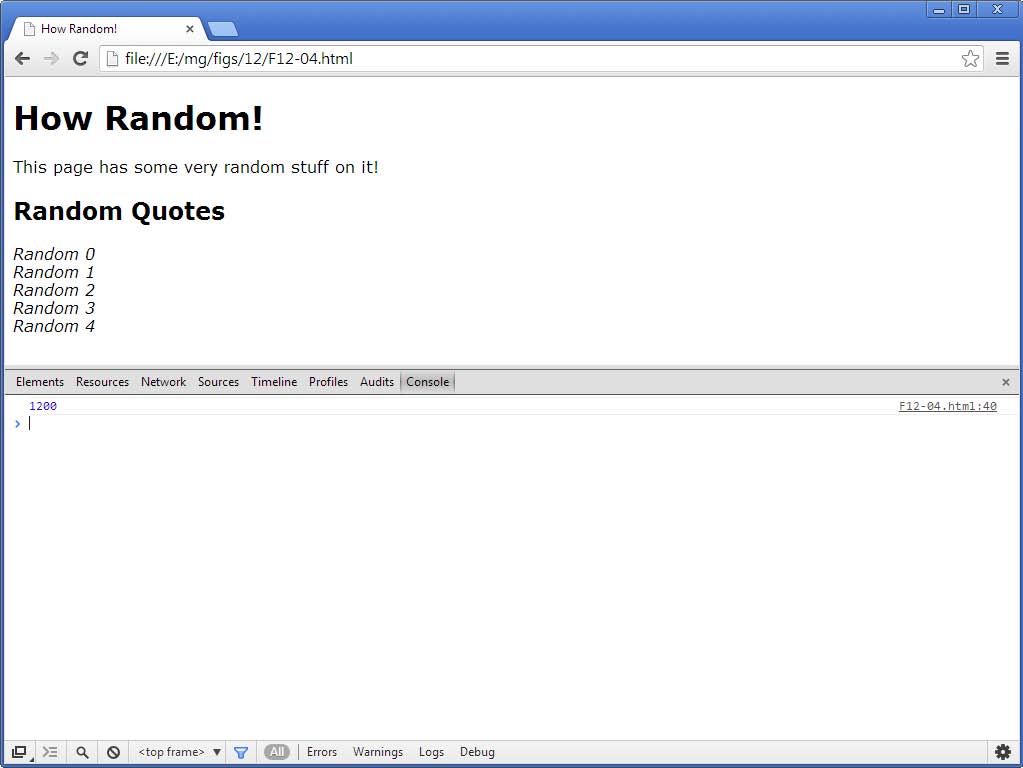
Figure 12-4 The value is logged to the JavaScript console.
As you can see, using the developer tools within a Web browser can certainly be helpful and less invasive than inserting alerts in your code. In addition, the ability to work with HTML, CSS, and the DOM of the document can be extremely useful when the issue may lie in one of those areas rather than in the script itself.
Using a Lint Tool
A lint tool is a program that checks your code against a set of standards and returns anything it finds that may be problematic. Not only can this help you find errors, but it can help you write better and more efficient code as well.
Two popular JavaScript lint tools are
![]() JSLint www.jslint.com
JSLint www.jslint.com
![]() JSHint www.jshint.com
JSHint www.jshint.com
Both tools allow you to check your JavaScript code for any number of issues. You can select various options to tailor the tool to your specific needs (for example, assuming the code is being run in a Web browser, a particular library is being used, or that the code is in development). Figure 12-5 shows the options available in JSHint.

Figure 12-5 JSHint options
Since JSHint allows you to select an option that tells it jQuery is being used, this is a good option for a jQuery example. Go to www.jsHint.com and paste the following code into the input area:
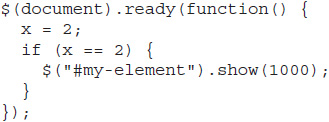
Make sure the “Browser” and “jQuery” check boxes are checked, make sure the “When code is not in strict mode” check box is unchecked, and click the “Lint” button. You will receive a set of errors.
The first error is shown in the following code:
![]()
Here, the lint tool is picking up on the use of == rather than === for comparison. Since == performs type coercion, unexpected results can occur. It is considered best practice to use === when checking for equality, since it requires both values to be equal and have the same data type.
The second error is shown in the following code:
![]()
Oops! It looks as though the var keyword was left off here. While it may not hurt in this case, this can become problematic, especially when functions are added. Declaring a variable like this within a function will make it global or overwrite the value of the global variable by the same name. In either case, this can cause your code to have numerous issues if it is not fixed. It is best to always include the var keyword when defining a variable.
The third and final error is shown in the following code:
![]()
Since the variable x was not defined with the var keyword, the lint tool sees it as undefined here, which is helpful when debugging, as JavaScript will let this proceed as normal (it will define x with a value of 2 in the global scope, which causes this comparison to run as though there were no errors). Since JavaScript attempts to fix things as best it can, it may be difficult to find an error like this. However, the use of a lint tool can help you find such issues and resolve them quickly.
Ask the Expert
![]() Chrome DevTools https://developers.google.com/chrome-developer-tools/
Chrome DevTools https://developers.google.com/chrome-developer-tools/
![]() Mozilla Developer Tools https://developer.mozilla.org/en-US/docs/Tools
Mozilla Developer Tools https://developer.mozilla.org/en-US/docs/Tools
![]() F12 Developer Tools – Internet Explorer http://msdn.microsoft.com/en-us/library/ie/hh673541%28v=vs.85%29.aspx
F12 Developer Tools – Internet Explorer http://msdn.microsoft.com/en-us/library/ie/hh673541%28v=vs.85%29.aspx
![]() JavaScript Lint www.javascriptlint.com
JavaScript Lint www.javascriptlint.com
![]() JSON Lint for JSON Syntax http://jsonlint.com
JSON Lint for JSON Syntax http://jsonlint.com
Try This 12-1
Practice Using a Lint Tool
![]()
This project allows you to practice working with a lint tool to test your jQuery code and ensure that it does not contain any potential errors or pitfalls.
Step by Step
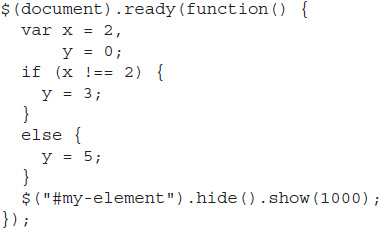
1. Save the following code as pr12-01.js :

2. Go to www.jshint.com and paste the code into the input area. Make sure the “Browser” and “jQuery” check boxes are checked, make sure the “When code is not in strict mode” check box is unchecked, and click the “Lint” button.
3. Based on the errors presented, attempt to fix anything that seems like it may be an issue. When complete, your JavaScript code should look something like this (this is one possible solution):
4. Run the test again with the new code to ensure it passes the test.
Try This Summary
In this project, you used your knowledge of JSHint to test whether a piece of JavaScript/jQuery code had any potential issues. Upon finding the issues, you were able to correct them and rerun the test to ensure there were no further issues with the code.
Unit Testing
While alerts, console logs, and browser tools can do quite a bit, sometimes programs become quite large and it becomes necessary to perform some automated testing to ensure that any current code is operating as expected and that any new code introduced does not break the code that is already in place. This can be done using what is known as unit testing.
Unit testing allows you to specify some tests that will be run on the JavaScript/jQuery code you have. These tests can do anything from testing values to testing whether a node was added to the DOM. To perform unit testing, it is helpful to have a unit testing tool. Some of these are listed next, with links to further information on each tool so that you can download and use it if you choose to do so.
![]() QUnit http://qunitjs.com/
QUnit http://qunitjs.com/
(This one is highly recommended for unit testing jQuery code, and is used by jQuery, jQuery Mobile, and jQuery UI for testing. It can also test regular JavaScript code.)
![]() Jasmine http://pivotal.github.io/jasmine/
Jasmine http://pivotal.github.io/jasmine/
![]() Mocha http://visionmedia.github.io/mocha/
Mocha http://visionmedia.github.io/mocha/
![]() YUI Test http://developer.yahoo.com/yui/yuitest/
YUI Test http://developer.yahoo.com/yui/yuitest/
Additional Resources
When you are done with this book, you may find you want to learn more about jQuery or some of the other topics mentioned in the book. This section includes a list of resources that may be helpful to you as you delve further into Web development.
jQuery Resources
![]() jQuery API http://api.jquery.com/
jQuery API http://api.jquery.com/
![]() jQuery Forum http://forum.jquery.com/
jQuery Forum http://forum.jquery.com/
![]() jQuery Learning Center http://learn.jquery.com/
jQuery Learning Center http://learn.jquery.com/
![]() jQuery Cheat Sheet http://oscarotero.com/jquery/
jQuery Cheat Sheet http://oscarotero.com/jquery/
JavaScript Resources
![]() Mozilla MDN https://developer.mozilla.org/en-US/docs/Web/JavaScript
Mozilla MDN https://developer.mozilla.org/en-US/docs/Web/JavaScript
![]() 2ality www.2ality.com/
2ality www.2ality.com/
![]() NCZOnline www.nczonline.net/
NCZOnline www.nczonline.net/
![]() JavaScript Weekly http://javascriptweekly.com/
JavaScript Weekly http://javascriptweekly.com/
Contacting the Author
If you would like to contact me, I am available through my Web site, Twitter, Google Plus, and a Web development help forum. These are all listed here:
![]() Web Site: Script the Web www.scripttheweb.com
Web Site: Script the Web www.scripttheweb.com
![]() Twitter https://twitter.com/ScripttheWeb
Twitter https://twitter.com/ScripttheWeb
![]() Google Plus https://plus.google.com/111287143870905163936/posts
Google Plus https://plus.google.com/111287143870905163936/posts
![]() Web Xpertz Help Forums www.webxpertz.net/forums/forum.php
Web Xpertz Help Forums www.webxpertz.net/forums/forum.php
 Chapter 12 Self Test
1. For some issues, using the JavaScript __________ method can be a handy way to quickly see where the problem may be.
A. Math.round()
B. alert()
C. Math.random()
D. view()
2. You can use JavaScript to test one or more values to see if they are the __________ of values you are expecting.
A. type
B. total
C. number
D. minimum
3. Adding 400 + 300 + ″100″ in JavaScript will yield __________.
A. 800
B. 800100
C. ″700100″
D. ″800″
4. All of the major browsers now offer their own set of __________ ___________.
A. measuring utensils
B. cup holders
C. special foods
D. developer tools
5. Testing your code in multiple browsers/platforms is a good idea.
A. True
B. False
6. No matter which browser’s developer tools you choose, you can use them to help you figure out where any __________ may be in your code.
A. issues (bugs)
B. food
C. drinks
D. pixels
7. Browser developer tools will only help you if you are using JavaScript or jQuery.
A. True
B. False
8. Each of the browser developer tools offers a JavaScript __________.
A. snippet
B. game
C. console
D. variable
9. You can use the __________ method in JavaScript to display a value on the console screen when needed.
A. console.write()
B. console.log()
C. console.show()
D. console.fadeIn()
10. In many cases, placing a value in the console is far more convenient than an alert because it does not __________ the task at hand with an alert pop-up box.
A. taunt
B. enhance
C. interrupt
D. perform
11. In addition to JavaScript, the ability of browser developer tools to work with HTML, CSS, and the __________ can be extremely useful when the issue may lie in one of those areas rather than the script itself.
A. DOM
B. pizza
C. TV
D. phone
12. A __________ tool is a program that checks your code against a set of standards and returns anything it finds that may be problematic.
A. check
B. cool
C. lint
D. dirt
13. Since JSHint allows you to select an option that tells it jQuery is being used, this is a good option for testing jQuery code.
A. True
B. False
14. Forgetting the var keyword never presents any problems in JavaScript.
A. True
B. False
15. Learning how to use the jQuery library is __________.
A. fun
B. dreadful
C. awesome
D. OK I guess