
CONTENTS
30.2 Current Needs and Solutions of Industrial Applications for Optical Sensors
30.6.2 Variation of Industrial OCT Products
30.6.3 Application for Plant Measurements
Many kinds of optical sensors are used in industry. Charge coupled device (CCD) cameras, lighting devices, and mesoscopes are currently popular optical devices. Optical devices have evolved into sensors used to check and measure industrial products, adding values to the products. Optical sensors have the advantage of high precision in comparison with other sensors such as ultrasonic, electromagnetic, and electrostatic sensors. This high precision comes from utilizing the wavelength of the optical light as a scale, which is shorter than 1 μm.
This innovative progress led to the invention of the interferometer, which gained maturity in the nineteenth century. In that period, the sources of light were emission lamps such as the mercury lamps, sodium lamps, and so on. The emission lamp was not convenient from the viewpoints of intensity, stability, and coherence. This stimulated scientists to contrive new ways of using optics. In the twentieth century, after the invention of the laser, interferometers gained popularity and their applications expanded widely. The laser interferometer had many variables that could be adapted to the target situation. With the growth of the industry, optical sensors are now being installed in factories, laboratories, and in various establishments related to the scientific fields.
The white light interferometer uses white light sources such as mercury lamps and halogen lamps. It is used as a measurement tool for sample surfaces. The low coherence of the white light source is utilized for higher accuracy. The coherence is based on the spectrum width of the white light on which is based the coherent length. It is very useful in checking products in terms of quality, damage, accuracy, and so on. It is widely used in industrial applications.
Optical coherence tomography (OCT) is also a low coherence interferometer. The principle is the same as the white light interferometer, but OCT provides a cross-sectional image of the sample. The white light interferometer measures the sample plane, while OCT measures points of the sample in depth direction reconstructs a cross-sectional image. To make its use easier, fiber-optics is installed into the OCT structure. A superluminescent diode (SLD) is utilized to render light to the fiberoptic device with high efficiency. The OCT technique was invented in the late 1980s [1]. It mainly evolved in the medical field, especially in the field of ophthalmology in the 1990s [2,3,4,5,6]. From the 2000s, many commercialized products were released and new technologies installed into the OCT to obtain higher accuracy and high-speed measurement [7,8,9,10,11,12,13].
OCT is a noninvase and nondestructive measurement method. It has attracted attention for application in other fields as well, including the medical fields (dentistry, dermatology, and internal medicine) [14,15,16,17,18]. Its application also extended to various plants [19,20,21] and industries [22,23,23,24,25,26,27]. It has been commercialized, however, only for applications in ophthalmology. It is currently suitable for eye measurement, but has not been optimized for applications in other parts of the human body.
From the viewpoint of industrial applications, OCT technology will have a high affinity to industrial samples because the white light interferometer has expanded in this field. Nonetheless, OCT has not seen popular growth in the industrial field because of the problem of flexibility and cost. Industrial samples have a variety of morphologies and sizes. The perspective of OCT measurement in industrial application is not only on structure analysis, but also on the condition and the change it effects on the sample. Industrial OCT should be compact, low-cost, and have the flexibility to adapt to the sample.
Section 30.2 describes the needs and demands from optical sensors in industrial applications.
Section 30.3 explains the principle of OCT technology.
Industrial OCT is explained in Section 30.4.
Its applications are mentioned in Section 30.5.
In Section 30.6, the future directions of industrial OCT are stated.
The summary and references are included in Section 30.7.
30.2 CURRENT NEEDS AND SOLUTIONS OF INDUSTRIAL APPLICATIONS FOR OPTICAL SENSORS
Optical sensors have been utilized to measure and diagnose the condition and appropriate structure of industrial materials for a long time. These devices are interferometer, optical displacement meter, moire inspection, stereoscopy, holography, and so on. Especially after the innovation of laser, these devices and methods have had an advantage of high resolution in comparison with other sensing methods such as ultrasonic or electrical devices.
Interferometers using laser have become an essential tool to examine the roughness of a material surface on the order of a few micrometers. Figure 30.1a shows a fundamental laser interferometer called a Michelson interferometer. The beam of a coherent light source was collimated and divided into two halves by a beam splitter (BS): one going to the reference mirror (M) (reference path) and the other to the target (measurement path). The interference is caused because of the concave–convex shape of the target surface when each reflected beam of light goes back to the BS and combines on it. The interference fringes appear on a screen representing the concave–convex shape of the target with the resolution of the beam’s wavelength. This means that the interference fringes show the difference of the optical path on the scale of the beam’s wavelength. The coherency of the laser beam is high, and the coherent length becomes long. Even if the difference of optical path between the reference and the measurement paths becomes large, the interference will occur thanks to the long coherent length of the laser. On the other hand, the light reflected from the interior structure of the target also interferes with the reference light, and it is hard to distinguish it. The laser interferometer is used for the surface profile with high precision on the order of optical wavelength.
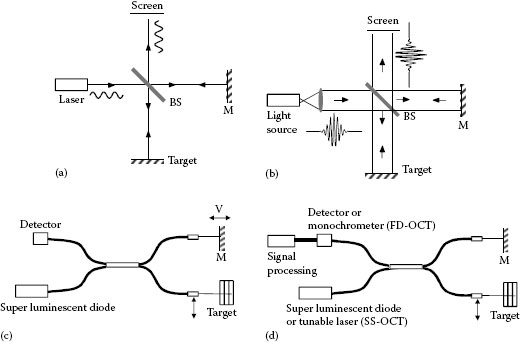
FIGURE 30.1 Optical interferometers. (a) Interferometer (b) white light interferometer (c) time-domain OCT (d) spectral-domain OCT.
The white light interferometer is a low-coherence interferometer and is shown in Figure 30.1b. The low coherency is characteristic of a light source with a wide spectrum. The wide-spectrum light source has a short coherent length. The white light interferometer utilizes this short coherent length to measure the concave–convex shape of the target surface. The interference occurs only when the optical length of the reference path is just matched with that of the measurement path. The difference between the paths is allowed to be only a few micrometers. The laser beam has speckle because of light coherency, and the result measured by the laser interferometer is always influenced by the speckle. A wide-spectrum light source has fewer speckles because the beam has a wide spectrum. The obtained waveform data become clear without the speckle effect. This is one of the main features of the white light interferometer. Industrial materials with rough surface, polished surface, and so on are targets.
The interior monitoring of the targets or materials is no less important than their external form. The interior structure is the first target, while clack, bubble, and uneven concentration are the other targets of interior monitoring.
OCT is a form of low-coherence interferometer. The principle of measurement in a laser interferometer and a white light interferometer is image measurement, while the principle of OCT measurement is fixed-point measurement. The former interferometer mainly measures the external form and displacement, while OCT obtains the cross-sectional image. The low-coherence light is directed into an optical fiber so that the influence of background light may be avoided. The output beam of the optical fiber is circular and its collimation is easy. It is hard to make the white light enter into the optical fiber with high efficiency. OCT utilizes an SLD, which has the same structure as a laser diode but lacks one of the mirrors on the edge surface. An SLD has the characteristics of a laser-like collimation property, while its emission spectrum is like that of a light-emitting diode (LED), that is, wide spectrum. The optical paths of the interferometer consist of an optical coupler. The output beams are collimated or focused with a collimator or lens. The scanning in the direction of depth is conducted by a movable reference mirror. This is called time-domain OCT and is shown in Figure 30.1c. Due to the movement of the reference mirror, the interference position shifts in the direction of depth. The interference occurs only when both lengths of the optical paths are matched. To obtain the cross-sectional image, the measurement probe or the target is moved to a vertical direction against the optical axis.
OCT has made progress in the field of ophthalmology. Its development started in the 2000s. Its technology and product value are sufficiently mature. In the initial stage of OCT development, the time-domain OCT (TD-OCT) was evolved. The piezo transducer was used to generate a stable interferogram, which is the interference waveform, and the another stage was installed for depth scanning [2,28,29]. A change in optical path length is obtained by stretching the coiled optical fiber, utilizing, for example, an off-axis Galvano mirror [30,31,32]. In the 2000s, non-scanning OCTs became the mainstream. These were called spectral-domain OCTs (SD-OCTs), which included Fourier-domain OCT (FD-OCT) and swept-source OCT (SS-OCT) [7,9,11,12]. This method does not use the movable reference mirror, that is, the nonmechanical scanner, while the signal information from the depth direction is obtained as it is piled up and analyzed in the frequency domain. The nonmechanical scanning method progresses the repetition speed of measurement upto the CCD imaging in real time. FD-OCT installs a monochrometer in place of a detector [7]. The SS-OCT utilizes a variable-wavelength laser in place of the low-coherence light source [12]. This is shown in Figure 30.1d. SD-OCT obtains the depth information by analyzing the detected signal in the frequency domain with the signal-processing method. The high speed and high precision will be achieved by these methods, while these high specifications need long memory and high-speed signal processing. The system should be impregnable against vibration.
This ophthalmologic OCT, however, has not been able to dominate industrial applications up to now. Industrial OCT has several requirements [22,23,24,25,26,27]. Although it is too expensive to install medical OCT in industrial fields, it is not the only reason preventing its prevalence. The ophthalmologic target, that is the human eye, can fix the specification of OCT. In other words, the system specification of OCT is optimized due to the target. By this consideration, high speed and high resolution are the current trends of OCT development. In the industrial fields, there are various kinds of targets. Size, material, structure, and measurement point are different for each. The optical probe, which throws the incident beam onto the target, should be changed because of the target. There are many restrictions in adapting ophthalmologic OCT to industrial fields. To apply the OCT technology in industrial use, the system should have the flexibility to adapt it to various kinds of targets. It is better that the system be simple, compact and low-cost.
The authors finalized such a concept of industrial OCT by 2000, and its portable version was developed in 2009. The system has a unique feature that can meet industrial needs. The short-term targets are structure monitoring of the exterior and interior of industrial materials, such as glass, plastic, and polymeric films. In half a decade, these targets have spread not only to industrial fields, but have also expanded to include the plant/food field and basic health-care.
This chapter explains the OCT technique and describes its principle including the theoretical expansions, devices, and signal processing in detail.
The amplitude of the beam is given by the sine or cosine curve as follows:
where Ai, k0, and ω0 are optical amplitude, wave number, and angular velocity of the incident beam, respectively. At first, we consider the interference of a single-wavelength beam such as a laser beam. The optical system is a Michelson interferometer as shown in Figure 30.2. The beam transmitted by a light source is separated into two beams with the same amplitude. The two beams are sent in quite different directions against plane mirrors, where they are brought together again to form interference fringes. The intensity of the interfered beams is expressed by the following equation:
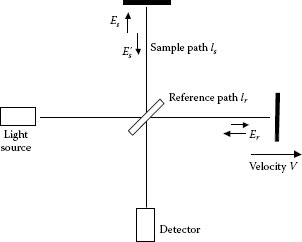
FIGURE 30.2 Michelson interferometer.
where
Er, Es, and , are optical amplitude on the reference path, reflected amplitude, and amplitude on the sample path, respectively
id, idc, and are the interference intensity, the direct current part, and the alternating current part, which give the following expressions
The time average is expressed as “〈 〉”.
where
Ar and As are optical amplitudes on the reference path lr and sample path ls, respectively
Δl is the path difference between them
The interference intensity repeats blinks due to the change in the path difference. The ideal singlewavelength beam never attenuates the interference intensity with any path difference.
Next, we suppose the light source of the interferometer has a spectrum of a Gaussian distribution (Figure 30.3), which is written as the following equation where Δk is the spectrum width:
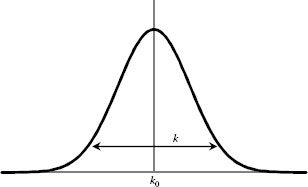
FIGURE 30.3 Gaussian distribution of incident beam.
The alternating current part of the interference intensity is rewritten as follows:
Equations 30.1 through 30.5 express the convolution between the two beams. Here, using the following relations,
we may then write
In this expression, the coherence length is defined as
As a result, the alternating current part of the interference intensity has the following expression:
The coherence length is decided by the spectrum width λk. Using the wavelength, this is rewritten as follows:
where λ0 and Δλ are, respectively, the center and the width of the spectrum of the light source.
Equations 30.1 through 30.9 explain how an optical light source with a Gaussian spectrum generates an interference intensity that is spindle-shaped, as shown in Figure 30.4. The waveform of the interference intensity is called an “interferogram.” The Gaussian spectrum is applied not only to low-coherence light but also to laser and LED.
When the mirror on the reference path moves with a constant speed V, the path difference can be rewritten with the required time t, which would cause it:
That is, it depends on the velocity. The reflected beam from the moving mirror undergoes a Doppler shift. Due to the speed of the moving mirror, the wavelengths of the two beams from each of the paths are subject to be turned away. As a result, the interference intensity is exponentially small due to the moving speed of the mirror.
The interferogram shows the coherency, and its coherence length depends on the spectrum width of the light source. From another viewpoint, the spectrum width assumed directly depends on the time interval Δt in order to maintain a certain frequency v0(= c/λ0) of the single-wavelength beam, where c is the speed of light. The relationship between the time interval Δt and the spectrum width Δv is as follows:
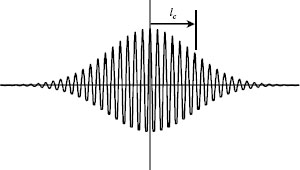
FIGURE 30.4 Alternating current part of interference intensity.
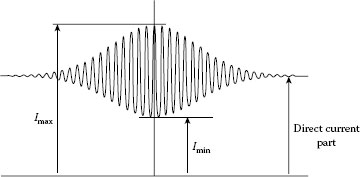
FIGURE 30.5 Interference intensity.
From this point of view, the coherence length lc is defined as the path difference Δl (=|ls–lr|) when the visibility of the interference intensity is equal to . The visibility is defined by the following equation and its meaning is depicted in Figure 30.5:
That is, the alternating current part of the interference intensity (30.1 through 30.7) is equivalent to |G(Δl)| = 1/2. Then,
Solving (30.1 through 30.12), the coherence length is represented as
By the following relationship
the coherence length is matched with Equations 30.1 through 30.8. This can be described in various ways as follows:
The actual OCT signal includes the noninterference signal and the interference signal, which are given in Equations 30.1 through 30.3 as idc: direct current part and : alternate current part. The noise part will be involved in the signal. To obtain an interference signal with adequate amplitude, signal processing is essential. The circuit diagram of signal processing on simple OCT is illustrated in Figure 30.6. The optical signal from here the interferometer, a Michelson interferometer, is changed to the electrical signal via a detector (PD). The current signal is transformed to voltage through a transimpedance amplifier. The signal intensity is magnified by a pre-amplifier and the direct current part and noise part are eliminated by an active filter used as a band-pass filter. The active filter has the center frequency, sometimes called beat or carrier frequency, which is synchronized with the speed of the movable mirror on the reference path. The relationship between the beat frequency λ0 and the mirror speed V are as follows:
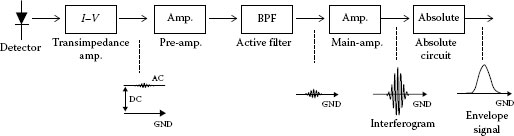
FIGURE 30.6 Circuit diagram of signal processing on OCT.
The selected signal’s amplitude is modified by a main amplifier. The interferogram is obtained here. As the cross-sectional image of OCT often treats the interferogram signal as a signal point, the envelope waveform is estimated by an absolute circuit. The interferogram has a spindle shape, which swings its amplitude to a plus or minus value equally, and the opposite value is turned up and smoothed through a low-pass filter. The absolute circuit functions in this procedure. Each interference signal is changed to the envelope waveform owing to the movable mirror’s motion. The crosssectional image is reconstructed by shifting the observation point in vertical direction against the optical axis.
OCT is a cross-section imager of the target. Now its techniques have some variations for interior diagnosis. SD-OCTs including FD-OCT and SS-OCT are technical methods to abandon the scanning in the depth direction, while the depth information is derived from analyzing the obtained signal. With nonmechanical scanning, these techniques become high-speed and high-resolution. These methods, however, fix their measurement range and resolution according to the light source, that is, depending on its spectrum characteristics, and it is hard to change them for each target. For high resolution the optical probe needs to be solid. The flexibility of the measurement will be less. Ophthalmologic OCT is specialized for the human eye, while flexibility of the system’s configuration and measurement is essential for industrial application, in which the targets will have different size and specification.
Ophthalmologic OCT has a robust optical probe to refrain from oscillation. Ball sizes of the human eye are almost the same, and its optical probe has a fixed focus on the retina. On the contrary, industrial OCT should be able to cover various kinds of targets. The targets in industrial application are transparent materials such as glass, plastic, and polymeric film, and scattering or absorbing materials such as paper, paint, crystals, and biological tissue. It will be desirable to change the following parameters in the system according to the target:
Measurement range and accuracy
Numerical aperture and working distance of the optical probe
Scanning speed and repetition rate
Measurement range should be lengthened or shortened depending on the target. Biological tissues may not need high accuracy at all because these tissues are soft and have elasticity. On the other hand, industrial materials are mostly hard, and sometimes need high accuracy, especially for high positioning accuracy. It is preferable to have a flexible working distance of the optical probe in order to expand or shorten it as the measuring situation may demand. The scanning speed will be adjusted according to the observation method depending on whether it is fixed-point measurement or crosssectional imaging. The former gives information of length, while the latter is an imager. The sensitivity of OCT measurement may sometimes be too high, and the strong reflection from the target surface may lower or influence the dynamic range of a detector. The background optical noise, which does not contribute to the interference, is also reflected by the target surface, and should be removed.
From the viewpoints of redundancy, compactness, and low cost, we have selected TD-OCT. The resolution of its measurement is uniquely decided by the spectrum width of the low-coherence light source. The resolution of SD-OCT is linked to the observation range. The measurement range and the working distance of TD-OCT can be fixed without relying on the resolution. As the measurement data directly reflects the interior structure, it makes the ensuring judgment easy.
TD-OCT needs mechanical scanning to shift the interference point in the depth direction. Typical TD-OCT utilizes the piezoelectric transducer to generate the beat frequency of the interferogram. The scan in the depth direction is conducted at another scanning stage. This method is hard to speed up with a stable scanning technique. The stability of scanning depends on the stage accuracy. In consequence, the long-path scanning stage must have a solid platform to maintain accuracy. For industrial use, it may be often difficult to fix the position of the measurement sample precisely. It is also hard to shorten the working distance between the sample and the measurement probe. As a result, industrial OCT should have flexibility in the working distance and measurement range designs. The probe design for the long depth and the scanning speed should be optimized for each target.
The repetitive scanning motion should also be stable. In this study, the long optical path scanning mechanism was developed as shown in Figure 30.7 [33]. This consists of a rotating corner reflector and a fixed mirror. The scanning range depends on the rotation radius of the reflector. The scanning speed (repetition rate) is variable according to the rotation speed of the reflector. The optical path length is derived by the following equations. The following examples of the optical path change and the beat frequency of the interferogram are shown in Figure 30.8a and b, respectively:
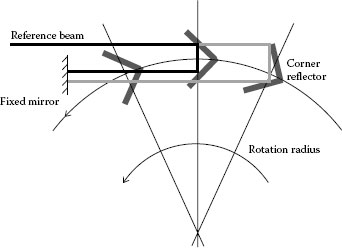
FIGURE 30.7 Long-path scanning algorism.
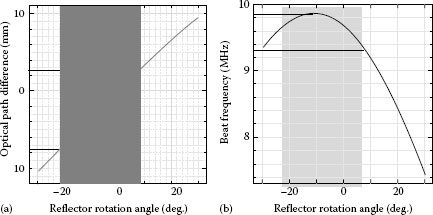
FIGURE 30.8 Optical characteristics of scanning algorism. (a) Optical path difference. (b) Beat frequency shift.
The rotating radius and speed of the reflector are 10 mm and 50 rps (= 3000 rpm), respectively. The gray area in each graph indicates the optical path difference of 10 mm. The rotating corner reflector generates the quasi-linear motion. The divergence from the linear motion is 1%–3% within the rotation angle of ±20°. The interferogram changes its frequency by about 1 MHz within the above rotation range.
The portable OCT scanner has a sophisticated structure. Its current compact structure is composed of an SLD light source, an optical fiber unit, a motor unit for optical path change, and a detector circuit as shown in Figure 30.9. The SLD light source is of a fiber pigtail type, witch is specially fabricated by Anritsu Co. Ltd. Its power is up to 3 mW[max]. Its wavelength is 0.8 or 1.3 μm and its spectrum width is <60 nm. The resolution of TD-OCT is defined by the spectrum width of the light source, which is 6–8 μm for the portable OCT. This SLD light source has an isolator and does not have a cooler. A radiator can make the light source stable when the output of its optical power is refrained. A cooling fan is used for the radiator for long operations where the output is close to the maximum (a few milliwatts). The fiber assembly is specially developed. It consists of a 2 × 2 optical fiber coupler and two collimators in its fundamental structure. Measurement and reference paths have collimators. The optical probe is attached on the measurement path and consists of other lens optics to control the numerical aperture (NA) of the probe and the depth of field. The detector circuit is inserted to transfer the optical signal to the electrical signal with adequate modification. The signals are gathered in a PC through an A/D converter. To obtain a stable result, the multiple signals are averaged and the crosssectional image is constructed to visualize the data. The reflector is fixed on the rotating disc and the disc is directly connected to a servo motor, which can control its rotation speed with a dedicated driver.
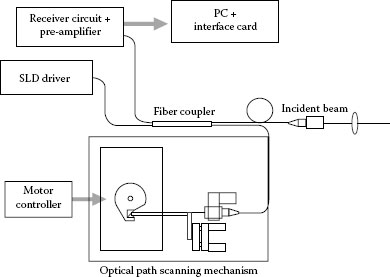
FIGURE 30.9 Portable OCT scanner.
An example of the concrete setup is summarized in Table 30.1. The scanning range is about 12 mm when a reflector rotates at a radius of 10 mm. The scanning speed is 25 scan/s. Position accuracy is <1 μm. The divergence from the linear motion is corrected by using Equation 30.1. Figure 30.10 shows a snapshot of the portable OCT scanner. Its size is 120 mm × 70 mm × 160 mm. It is handy and works with a DC power supply or a battery.
The wavelength, measurement range, and scanning speed are decided according to the target. The optical probe should be also designed according to individual requirements. The optical probe defines the working distance between the probe edge and the target surface. It receives the backscattering light from the target with an adequate NA. It is designed from 0 (parallel beam) to 0.3 according to the target. A plate-like target is measured with a narrow NA, while a high-scattered target such as a biological tissue is observed with a wide NA. The spot size of the incident beam becomes 0.5 mmϕ (NA = 0) and 5 μmϕ (NA = 0.3). The NA of the optical probe controls the depth of the field. A narrow NA has a long depth of field. On the contrary, a wide NA has a short depth of field. Measurement data will be obtained by combining the measurement range depending on the reflector motion and the depth of field on the optical probe. The design of the optical probe has several assemblies of lenses as shown in Figure 30.11. The upper case uses only a single lens, that is, it utilizes the NA of the optical fiber. The middle case adds a concave lens to expand the beam size. The control of the NA and the depth of field is easier in the middle than in the upper case. The bottom one adds an extra lens to make a parallel beam in the probe. This structure is useful to adjust the interference point on the focal point. As a result, the differences among them are ease of optical arraignment, simpleness, and probe size.
TABLE 30.1
Portable OCT Scanner
SLD Light Module |
Anritsu Co. LTD |
Wavelength |
1.3 μm |
Spectral width |
61.2 nm |
Fiber module |
Tatsuta Electric Wire & Cable Co., LTD |
Scanning mechanism |
Maxon DC Servo motor |
Rotation |
25 scan/s (1500 rpm) |
Rotation radius |
10 mm |
Resolution |
7 μm |
Position accuracy |
<1 μm |
Scanning range |
12 mm |
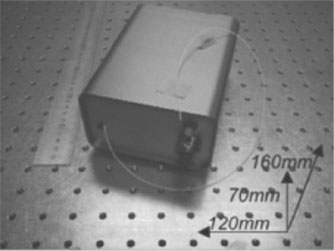
FIGURE 30.10 Portable OCT scanner, smallest one.
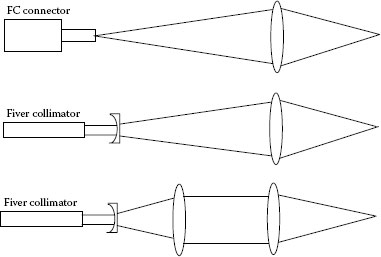
FIGURE 30.11 Optical probe assembly.
The portable OCT can be installed in a factory as embedded equipment on the production line. The targets comprise interior monitoring such as crack and air bubble detection of plastic products, uneven fluctuation of materials and paints, and accuracy evaluation of casting. For industrial use, the cross-sectional image is not always essential. In many cases, manufacturing products are moving in a factory line. The fixed-point measurement and its multichannel measurement can accommodate the demands of industrial use.
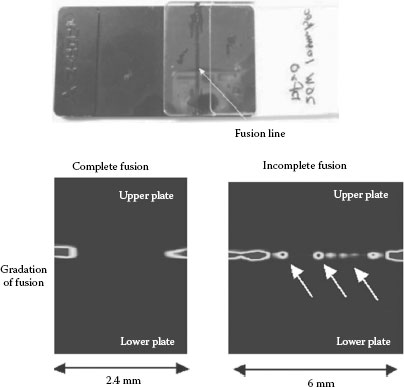
FIGURE 30.12 Evaluation of laser fusion on plastic plates.
Figure 30.12 shows one of the measurement results of an industrial product, which is the evaluation of laser fusion on plastic plates [24]. The laser fusion machine focuses on the boundary between the upper and lower plastic plates and melts it to bring the two plates together. The portable OCT can check and evaluate its condition by following the fusion process. The spot size of the OCT beam is equal to the beam spot of the laser fusion, and there is no need of a cross-sectional image. Here, however, the cross-sectional image is obtained by moving the probe in a perpendicular direction to the optical axis (depth direction) to visualize the quality of the fusion. When laser fusion is conducted perfectly, the boundary surface between the upper and bottom plastic plates disappears. Then the scanner does not receive any signal from the fusion part as shown in the left OCT image of Figure 30.12. The gradation of the reflected interferogram intensity is observed on the edges of the fusion part (circular mark on the left OCT image). It is dependent on the spot profile of the laser fusion; in other words, the intensity distribution of the laser beam. On the other hand, when the fusion is incomplete, the scanner receives the reflected interferogram signal from the boundary surface as shown in the right OCT image. The obtained OCT image clearly shows the difference. In the actual operation, the alert from the quality check of the OCT fixed-point measurement is enough to inform the operator regarding the mis-fusion.
Figure 30.13 shows the measurement of a transparent laminated tube (mayonnaise tube). Thin films of six to seven layers are detected. As the difference between the refractive indices of these files was small, the interference intensities inside the tube were small. The layer structure is clearly distinguished. The thickness of each layer is different at a part of the laminated tube. The individual difference is a target of the portable OCT.
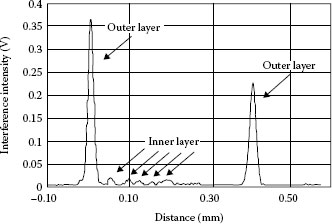
FIGURE 30.13 Transparent laminated tube (mayonnaise tube).
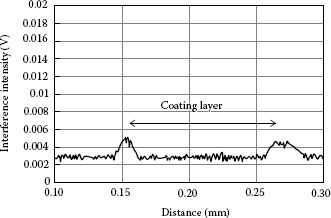
FIGURE 30.14 Tablet coating (thickness measurement).
There is a large demand for methods of thickness measurement for glass, polymeric film, plastic, and so on. Thickness fluctuation, precision, and layer structures are targets of industrial OCT measurement. Tablet coating (wafer) of medicine was observed as shown in Figure 30.14. The merit of portable OCT is not only direct measurement of a tablet, but also indirect measurement. The portable OCT can measure tablets through the packaging because the measurement range is wide enough. There is no need of precise positioning of the targets. The wavelength of portable OCT is near infrared light (0.8–1.6 μm), and there is little influence of color. Industrial materials come in a wide variety of sizes (thickness). The portable OCT can adjust its measurement range to the target size easily. The flexibility of the portable OCT is suitable for industrial use. The portable OCT can ne expanded to accommodate new functions to fulfill industrial demands. In a factory, a certain procedure can be conducted on multiple lines following the same routine. In such a case, the portable OCT can separate the optical probe into the number of lines functioning. To realize this, an optical switch is installed in the portable OCT. The optical switch produced by LEONI Co. Ltd. was so small that it could be installed in the chassis of a portable OCT as shown in Figure 30.15. When all the probes have the same length of optical fiber, the optical switch changes its channel at every reflector rotation.
Large targets such as combination lens, crystal block, and liquid tank need a long measurement range, while traditional optical sensors use a long linear stage to scan a long range. Such a sensor would be large, heavy, and high cost. The portable OCT can expand the measurement range by enlarging the radius of the rotating reflector. The radius of 60 mm, which is the same as that of a compact disc, has the measurement range of 100 mm. To rotate a large disc, the jitter of its rotation and its wobbling should be controlled. Figure 30.16 shows a high-precision rotating disc considering the mentioned task. The rotary encorder can correct the distortion from the linear motion. It is not easy to get the accuracy of 1 mm in the measurement range on the order of >100 mm, but the portable OCT has the ability to achieve this requirement. Furthermore, the 3 × 3 fiber coupler can add a reference port. When these two reference ports have different optical path lengths, the measurement range can expand to twice as long as for a single reference port without impairing the accuracy [35]. The arrangement of the reference path lengths can add the function not only of enlarging the measurement range, but also of increasing the repetition rate at one rotation.
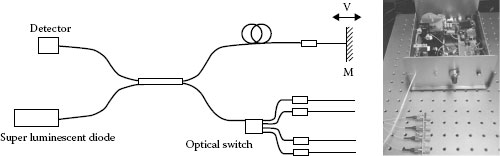
FIGURE 30.15 Multichannel probe on a portable OCT.
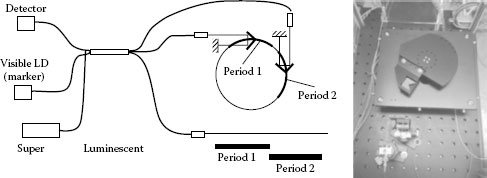
FIGURE 30.16 Long-path scanning on a portable OCT.
Medical OCTs, including in ophthalmology, internal medicine, dentistry, and dermatology, are productive applications [5,12,13,25]. The ophthalmologic OCT can be successfully installed in a hospital, whereas other installations are still in the study phase. The main impediment is the cost. The introduction of OCT apparatus requires space, cost, and specialists. The portable OCT could be applied to the medical field because it achieved the same sensitivity as the medical OCT (the dynamic range is lower than the current medical OCT), although not in the same direction as medical OCTs. To fulfill basic health care is the purpose of the portable OCT.
The portable OCT for dentistry was specialized for its optical probe, which was a stick-like body with a diameter of 10 mmϕ having a one-directional auto-stage. The NA of the optical probe was controlled to be 0.14. The depth of field was designed as 5 mm. The caries check was demonstrated with this portable OCT and the result is shown in Figure 30.17. Caries occurs just under the surface. The caries of CO, the initial stage of caries, could be easily monitored for depth and area.
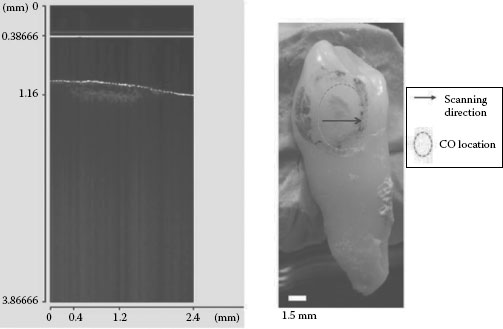
FIGURE 30.17 Caries monitoring.
Another OCT measurement of dentistry is the boundary layer detection. The boundary layer between enamel and dentin is called the enamel–dentin junction (EDJ) and its recognition is important for artificial tooth and implant placement. The depth of EDJ is about 2–3 mm. The portable OCT can visualize it with a long measurement range as shown in Figure 30.18. However, intricate positions of teeth cannot be easily reached using the optical probe in an adequate manner. To use the portable OCT beneficially, the form of the optical probe and measurement method should be defined in the medical scenario.
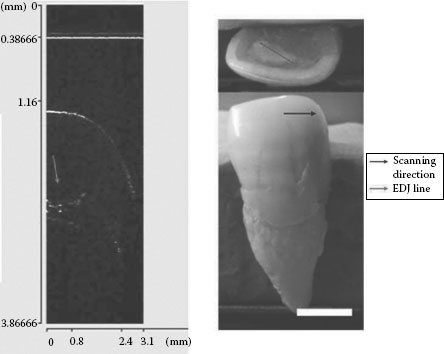
FIGURE 30.18 EDJ monitoring.
The human skin is a scattering material for visible to infrared light to penetrate. The propagation depth to obtain the interference signal on medical OCT measurement is about 0.7 mm. The cross-sectional image is often reported for studies in dermatology [14,15,17]. On another front, the application of the portable OCT for skin measurement is unique. Basic health care and the cosmetic perspective are the main targets of the portable OCT. As the portable OCT can be compact and low cost, it is easy to install in a cosmetics counter and a medical interview scene. To adapt the portable OCT to skin measurement, the optical probe should have a high NA of 0.3 because the measurement depth is short and the scattered light should be gathered with a wide angle. The depth of the field of the high-NA probe should be about 1 mm. In this application, the portable OCT does not construct a cross-sectional image, but a fixed-point measurement is conducted. The optical probe is lightly vibrated to average out the individual speckle-like interior signals. An accumulation of about 1000 times was conducted for a stable evaluation. The measurement depth was thus about 0.5–0.6 mm.
Figure 30.19 shows an example of skin measurement by the portable OCT. the effect of cosmetics for skin care is visualized. The interference intensity was corrected by multiplying the square of the distance. The vertical axis was represented by the log-scale. The normal skin of the arm has a two-layer structure, of which the first is the epidermal layer and the second is the dermal layer. The normal thickness of the epidermal layer is about 0.2 mm. The patient in Figure 30.19 has dry skin. The peak of the second layer is therefore not clear. After cosmetic care by applying a foundation and a lotion to the skin, the second peak from the dermal layer becomes clear. It is clearly seen that the water retentivity of the lotion is more effective than that of the foundation.
Atopic dermatitis causes severe damage to the skin structure. This damage is not exclusive to the epidermal layer; it also seeps into the dermal layer. Figure 30.20 shows such damage of atopic dermatitis. The second peak of the dermal layer was spoiled. It is now clear compared with the normal skin. The epidermal layer was also subject to influence. There may be no need to visualize such skin conditions with a cross-sectional image. Fixed-point observation such as with a stethoscope is useful for a medical interview scene.
The other application of the current portable OCT is in the ophthalmologic field. Here too, the portable OCT is directed toward basic health care. The fitting of the contact lens and the combination of the optical power between the naked eye and the contact lens are targets for the portable OCT. Of course it is possible to evaluate such targets with traditional ophthalmologic OCT. The current sophisticated medical OCT, however, has a long, firm optical probe. To measure the optical power, the eye should be unblocked, that is, the eye should be focused on a target. The portable OCT has the flexibility to design the optical probe to unblock the eye because the design of the optical probe is separated from the resolution factor and has a long measurement range.
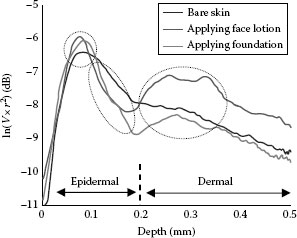
FIGURE 30.19 Skin measurement through cosmetics.
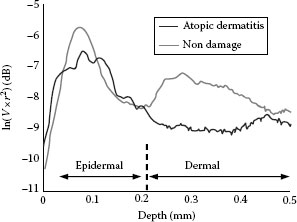
FIGURE 30.20 Atopic dermatitis measurement.
Some of the applications mentioned are now in clinical practice. To install the portable OCT for clinical use as a basic health care tool or a cosmetic counter, further research on its usability will have to be pursued. This is because the users will not be professionals. From this perspective, simple structure of the device and direct manifestation of the observed information are important in medical care, especially basic health care. The portable OCT can be operated with a battery. It is useful in rural clinics and may be installed in developing countries.
Up to now, a wide variety of targets have been evaluated by the portable OCT for industrial use. Of course, not all of these targets are suitable for the portable OCT. Details of these, however, are summarized in Table 30.2. This shows the direction of the targets sorted by categories. Now several Japanese companies are producing commercial products of the portable OCT. They may come as a built-in system, stand-alone apparatus, or custom-made device.
The future perspective of the industrial OCT is described in the following terms.
Some of the industrial targets do not have a precise position in the production process. For example, to monitor the manufacturing process, the thickness of the target must be tracked by a sensor. In such a case, the industrial OCT with tracking can be installed. Its applications can be for injection stroke, chemical vapor deposition process, polishing process, and so on.
TABLE 30.2
OCT Applications of Industrial Use
Industrial use |
Displacement, thickness, reflective index, solution concentration, crack check, volume change, time response, vibration |
Plant and food processing |
Plant factory, growth monitoring, food processing, freshness check, seal check |
Basic health care and cosmetics |
Ophthalmology, internal medicine, visceral examination, dentistry, dermatology, cosmetics |
Sample point measurement of large targets is a strong need in industry. The large area of the targets does not always need whole scanning. The optical probe of the industrial OCT on a large positioning system will satisfy such needs. A large glass plate, thick acrylic material, thin film sheet, and so on are examples of large targets for industrial application.
Variation and yield ratio among production lines can be evaluated by multichannel OCT. This is mentioned in Section 30.5.
30.6.2 VARIATION OF INDUSTRIAL OCT PRODUCTS
The targets of industrial OCT are spread over a wide variety of fields. To keep pace with all of them by means of custom-made OCTs is not efficient because it requires great care. Modulation of the optical path change mechanism, optical fiber assembly, electrical circuits for the SLD driver, signal processing, and PC interface are necessory.
Some targets are visualized as a cross-sectional image, but the current portable OCT has the ability to produce two to three images in 1 s. When the operator needs higher speed, the multichannel OCT can be installed to conduct high-speed processing; otherwise, the light source should be changed into an SS light. The cheep and compact SS light will be selectable.
Monitoring not only the interior structure but also the deterioration and deformation with time will become the target of the industrial OCT. Painting material, plastic plate, and ABS resin are such targets. The extinction coefficient has information on the material quality [35,36,37].
30.6.3 APPLICATION FOR PLANT MEASUREMENTS
Plants vary considerably in size, brand, and so on. To evaluate them, statistical measurement is effective. The calibration curve method will also be installed. Furthermore, it is helpful to tie up specialists in biology with the practical farmer to analyze the results of plant OCT measurement. Environmental response, growth response, freshness assessment, and food processing are good applications for the portable OCT. To install the portable OCT in the field of growth of a plant, the system should be “portable” with battery-driven facility, operability, and resistance to dust, vibration, and so on.
The measurement method should be selected depending on whether fixed-point measurement or cross-sectional imaging is required. On the medical interview scene or cosmetic counter, simple system and direct result are important for nonprofessional operators and subjects. Restriction of the application to only necessary information leads to its low cost and simplicity of use.
The current portable OCT is a TD-type OCT. It does not involve the latest technology in comparison with the medical OCT. Its scanning speed, especially, is much slower than that of the current SD-OCT. The high scanning speed of the SD-OCT, however, is for real-time observation of three-dimensional or four-dimensional structures of the target. High-speed signal processing is also needed to calculate the huge memorized data. The portable OCT is simple for analyzing the obtained data because the obtained interferogram directly represents the condition of the interior structure of the target. The scanning speed is not so high, but it is enough for most of the industrial applications. Instead, the portable OCT has a feature of wide flexibility for the designs of the optical probe and the measurement range. It is adequate for the variety of industrial targets.
The applications of the portable OCT for medical use are directed toward basic health care and cosmetics. From the viewpoint of simple operation, small apparatus, and low cost, the portable OCT can be easily installed in such fields. Cross-sectional images of the teeth are useful to check caries and EDJ, while skin condition can be evaluated by fixed-point observations. An easy-to-use approach and direct representation of the desired information are important for the medical interview scene and cosmetics formulation.
In the near future, the medical OCT will continue to develop state-of-the-art technology to pursue the new demands of medicine in the current direction, while it becomes a low-cost and singlefunction technique in another direction. On the other hand, the industrial OCT will expand across wide fields by improving the formulation of the system and modular technology. The portable OCT in fundamental medicine will be installed in areas separate from the medical OCT.
1. H. H. Gilgen, R. P. Novak, R. P. Salathe, W. Hodel, and P. Beaud, Submillimeter optical reflectometry, J. Lightwave Technol., 7, 1255, 1989.
2. D. Huang, E. A. Swanson, C. P. Lin, J. S. Schuman, W. G. Stinson, W. Chang, M. R. Hee et al., Optical coherence tomography, Science, 254, 1178–1181, 1991.
3. M. R. Hee, J. A. Izatt, E. A. Swanson, D. Huang, J. S. Schuman, C. A. Puliafito, and J. G. Fujimoto, Optical coherence tomography of the human retina, Arch. Ophthalmol., 113, 325–327, 1995.
4. A. Can, J. S. Duker, T. H. Ko, J. S. Schuman, and J.G. Fujimoto, Ultra-high resolution optical coherence tomography of retinal pigment epithelial tear following blunt trauma, Arch. Ophthalmol., 124, 281–283, 1996.
5. B. W. Colston, M. J. Evertt Jr., L. B. D. Silva, L. L. Otis, P. Stroeve, and H. Nathel, Imaging of hard- and soft-tissue structure in the oral cavity by optical coherence tomography, Appl. Opt., 37, 3582–3585, 1998.
6. J. M. Schmitt, Optical coherence tomography (OCT): A review, IEEE J. Quantum Electron., 5, 1205–1215, 1999.
7. M. Wojtkowski, R. Leitgeb, A. Kowalczyk, A. F. Fercher, and T. Bajraszewski, In vivo human retinal imaging by Fourier domain optical coherence tomography, J. Biomed. Opt. 7, 457–463, 2002.
8. W. Drexler, Ultrahigh-resolution optical coherence tomography, J. Biomed. Opt., 9, 47–74, 2004.
9. S. Jiao, R. Knighton, X. Huang, G. Gregori, and C. Puliafito, Simultaneous acquisition of sectional and fundus ophthalmic images with spectral-domain optical coherence tomography, Opt. Exp., 13, 444–452, 2005.
10. C. C. Rosa, J. Rogers, J. Pedro, R. Rosen, and A. Podoleanu, Multiscan time-domain optical coherence tomography for retina imaging, Appl. Opt., 46, 1795–1808, 2007.
11. I. Grulkowski, M. Gora, M. Szkulmowski, I. Gorczynska, D. Szlag, S. Marcos, A. Kowalczyk, and M. Wojtkowski, Anterior segment imaging with spectral OCT system using a high-speed CMOS camera, Opt. Exp., 17, 4842–4858, 2009.
12. Y. Shimada, A. Sadr, A. Nazari, H. Nakagawa, M. Otsuki, J. Tagami, and Y. Sumi, 3D evaluation of composite resin restoration at practical training using swept-source optical coherence tomography (SS-OCT), Dent. Mater. J., 31, 409–417, 2012.
13. C. K. S. Leung and R. N. Weinreb, Anterior chamber angle imaging with optical coherence tomography, Eye, 25, 261–267, 2011.
14. V. R. Korde, G. T. Bonnema, W. Xu, C. Krishnamurthy, J. R. Moore, K. Saboda, L. D. Slayton et al., Using optical coherence tomography to evaluate skin sun damage and precancer, Lasers Surg. Med., 39, 687–695, 2007.
15. M. Mogensen and L. Thrane, OCT imaging of skin cancer and other dermatological disease, Biophotonics, 2, 442–451, 2009.
16. R. Steiner, K. Kunzi-rapp, and K. Scharffetter-Kochanek, Optical coherence tomography: Clinical applications in dermatology, Med. Laser Appl., 18, 249–259, 2003.
17. K. Koenig, Hybrid multiphoton multimodal tomography of in vivo human skin, Intra Vital, 1, 11–26, 2012.
18. H. Yabushita, B. E. Bouma, S. L. Houser, H. T. Aretz, I. Jang, K. H. Schlendorf, C. R. Kauffman et al., Characterization of human atherosclerosis by optical coherence tomography, Circulation, 106, 1640–1645, 2002.
19. J. W. Hettinger, M. P. Mattozzi, W. R. Myers, M. E. Williams, A. Reeves, R. L. Parsons, R. C. Haskell, D. C. Petersen, R. Wang, and J. I. Medford, Optical coherence microscopy. A technology for rapid, in vivo, non-destructive visualization of plants and plant cells, Plant Physiol., 123, 3–16, 2000.
20. T. H. Chow, K. M. Tan, S. G. Razul, C. M. Tay, T. F. Chia, and W. T. Poh, Diagnosis of virus infection in orchid plants with high-resolution optical coherence tomography, J. Biomed. Opt., 14, 014006, 2009.
21. V. V. Sapozhnikova, V. A. Kamenskii, and R. V. Kuranov, Visualization of plant tissues by optical coherence tomography, Russ. J. Plant Physiol., 50, 282–286, 2003.
22. M. Wurm, K. Wiesauer, K. Nagel, M. Pircher, E. Götzinger, C. K. Hitzenberger, and D. Stifter, Spectraldomain optical coherence tomography: A novel and fast tool for NDT, Fourth International Workshop NDT in Progress, Prag, Czech Republic, pp. 225–232, 2007.
23. B. G. Goode, OCT aims for industrial application, Laser Focus World, 45, 41–45, 2009.
24. T. Shiina, M. Satoshi, and T. Honda, Factory built-in type simplified OCT system for industrial application, IEEE J. Trans. EIS, 129, 1276–1281, 2009 (written in Japanese).
25. C. Todea, M. L. Negrutiu, C. Balabuc, C. Sinescu, F. I. Topala, C. Marcauteanu, S. Canjau, G. Semez, and A. G. Podoleanu, Optical coherence tomography applications in dentistry, TMJ, 60, 5–17, 2010.
26. P. Merken, R. Vandersmissen, and G. Yurtsever, Optical coherence tomography: OCT supports industrial nondestructive depth analysis, Laser Focus World, 47, 2–8, 2011.
27. G. Song and K. Harding, OCT for industrial applications, SPIE Proc., 8563, 2012.
28. J. A. Izatt, M. D. Kulkarni, H. Wang, K. Kobayashi, and M. V. Sivak, Jr., Optical coherence tomography and microscopy in gastrointestinal tissues, IEEE J. Quantum Electron., 2, 1017–1028, 1999.
29. M. Leahy, J. Hogan, C. Wilson, H. Subhash, and R. Dsouza, Multiple reference optical coherence tomography (MR-OCT) System, Proceeding of SPIE 8580, 8, 2013.
30. J. A. Izatt, M. R. Hee, G. M. Owen, E. A. Swanson, and J. G. Fujimoto, Optical coherence tomography in scattering media, Opt. Lett., 19, 590–592, 1994.
31. G. J. Tearney, M. E. Brezinski, B. E. Bouma, S. A. Boppart, C. Pitris, J. F. Southern, and J. G. Fujimoto, In vivo endoscopic optical biopsy with optical coherence tomography, Science, 276, 2037–2039, 1997.
32. G. J. Tearney, B. E. Bouma, and J. G. Fujimoto, High-speed phase- and group-delay scanning with a grating-based phase control delay line, Opt. Lett., 22, 1811–1813, 1997.
33. T. Shiina, Y. Moritani, M. Ito, and Y. Okamura, Long optical path scanning mechanism for optical coherence tomography, Appl. Opt., 42, 3795–3799, 2003.
35. A. B. Vakhtin, K. A. Peterson, D. J. Kane, E. H. Jordan, G. Hansen, and M. Teicholz, Combination of Fourier-domain optical coherence tomography and photo-stimulated luminescence piezo-spectroscopy as an NDE tool for thermal barrier coatings, ASME Proceedings, Ceramics, pp. 275–279, 2007.
36. G. Popescu and A. Dogariu, Scattering of low coherence radiation and applications, Eur. Phys. J. Appl. Phys., 32, 73–93, 2005.
37. G. Yao and L. V. Wang, Monte Carlo simulation of an optical coherence tomography signal in homogeneous turbid media, Phys. Med. Biol., 44, 2307–2320, 1999.