
CONTENTS
34.2 Zone-Plate Interferometer
34.2.1 Zone-Plate Interferometer of A-Type
34.2.2 Zone-Plate Interferometer of B-Type
34.2.3 Zone-Plate Interferometer of C-Type
34.3 Lateral-Shearing Interferometer
Precision mirrors for optical instruments are manufactured by grinding, polishing, or cutting substrates. To manufacture the mirrors with higher precision shape, many cycles of measurements and corrections by the polishing or cutting are repeated in the manufacturing process. The manufacturing time is, therefore, long. And furthermore, the setting error of the mirrors is caused by attaching and detaching the mirrors. To avoid the error and to reduce the time of machining, the shape measurements of the mirrors on the manufacturing machine are essential. As a geometrical optical measurement, a new type of Hartmann test was developed using an optical fiber grating and applied on the manufacturing machine [1]. However, the data obtained by the method are only located at individual spots. In interference methods, on the other hand, the data are obtained at each pixel. Therefore, the spatial resolution of the interference methods is higher than that of the geometrical optical method. This chapter discusses some on-machine shape measurements by using interferometer.
34.2 ZONE-PLATE INTERFEROMETER
A zone-plate interferometer, which is a common-path instrument, was proposed by Murty [2] to measure the shape error of a large concave mirror and zone-plate interferometers of several mode types were developed by Smartt [3]. To test aspherical surfaces, a holographic zone-plate interferometer was presented by Nakajima [4]. A zone-plate interferometer is not much affected by air turbulence and machine vibrations. The zone-plate interferometer needs no real reference surfaces because the reference wavefront produced by a zone-plate is used as a reference surface. Spherical or aspherical surfaces, therefore, can be measured easily by using the zone-plate interferometer. In this section, zone-plate interferometers of three types are explained.
34.2.1 ZONE-PLATE INTERFEROMETER OF A-TYPE
Test surfaces used for the measurement are symmetrical with respect to an optical axis z. A zone-plate is a circular grating such as a Newton ring, as shown in Figure 34.1. The zone-plate must be arranged perpendicularly with respect to the optical axis. Figure 34.2 shows that illumination beams are transmitted and diffracted through the zone-plate [5]. The beams transmitted toward the test surface focus at the center O of the test surface. Part of the beams diffracted to many directions is used for the zone-plate interferometer. The direction of the beams used for the interferometer is perpendicular to the test surface. The measurement of an arbitrary point C on the test surface is performed as follows. Points C and D are symmetrical with respect to the optical axis. Points A and B on the zone-plate are symmetrical with respect to the optical axis. The arrow in the solid line passes through the zone-plate at A, reflects at the center O of the test surface, diffracts at B to the direction E. We denote the diffracted diverging light beam and the diffracted converging light beam of the first order as +1 and −1, respectively. The light beam of (0, +1), of which a typical path is indicated as A−O−B−E in Figure 34.2, generates a wavefront, does not involve the shape error, and acts as a reference beam.
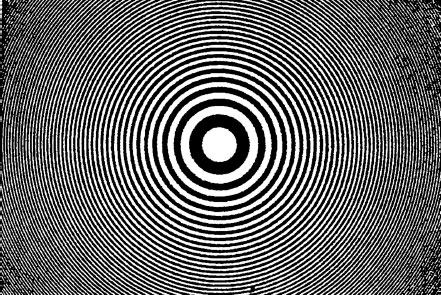
FIGURE 34.1 Part of zone-plate.
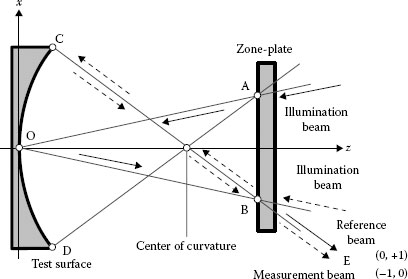
FIGURE 34.2 Diffracted and transmitted beams through a zone-plate.
The (−1) beam diffracted at B, as shown by the arrow in the broken line, goes to the test surface and reflects at C. When the shape of the test surface is manufactured precisely as the designed shape, and the test surface and the zone-plate are located in position, the arrow in the broken line reflects perpendicularly at C, passes through B to the direction E. The light beam (−1, 0), of which a typical path is indicated as B−C−B−E in Figure 34.2, generates a wavefront, involves the shape error, and acts as a measurement beam. Reference and measurement light beams make a fringe pattern on an image plane. We called the zone-plate interferometer, zone-plate interferometer of A-type.
A zone-plate has the following transmittivity distribution T(x) by which the reference beam reconstructs a designed surface:
where
λ is the wavelength of a light source
AO is the distance between A and O
AD is the distance between A and D
Because the designed shape of the test surface is given, T(x) is calculated by a computer. The reference and the measurement beams pass through the aperture and interfere on the image plane. The interference fringes indicate the shape difference between the designed surface and the test surface. Schematic diagram of the zone-plate interferometer is shown in Figure 34.3.
If the zone-plate is not located precisely in the right position, precise measurements cannot be performed. In the interferometer, the arrangement of the positioning of the zone-plate is performed by moire technique: A moire fringe pattern appears when the interference fringes formed by beams 2 and 3 interfere with the zone-plate grating. When the zone-plate is located in the right place, the moire fringe pattern of a spherical test surface is null and the pattern of an aspherical surface is concentric circles.
To observe the interference fringes on the image plane, only beam 2 is used whereas beam 3 is cut off with mirror 5 inserted between beam splitter 1 and lens 3. Beam 2 is reflected on the test surface and becomes beam 4 which is shown as reference and measurement beams in Figure 34.2. Beam 4 is guided with mirrors 5 and 6 to the rear surface of the interferometer. Unnecessary diffraction beams shown by broken lines in Figure 34.3 are eliminated by an aperture in order to observe clear interference fringes on the image plane. The fringe pattern on the image plane is taken by a charge coupled device (CCD) camera.
Figure 34.4 is a photograph of the zone-plate interferometer mounted on an ultraprecision cutting machine. The zone-plate used for the experiment is a photo plate and has a pattern calculated to reproduce the shape of the designed surface.
Two test surfaces are spherical concave mirrors with a curvature radius of 140 mm and a measuring diameter of 10 mm and are manufactured by the precision cutting machine. One mirror with very small error is called the mirror without shape error. The other is called the mirror with shape error. The mirrors were measured during machine running at a speed of 900 rpm, the same as the cutting speed of the mirrors.
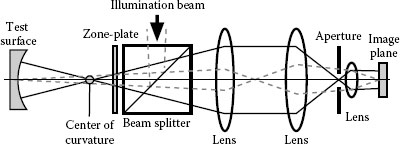
FIGURE 34.3 Schematic diagram of the zone-plate interferometer of A-type.
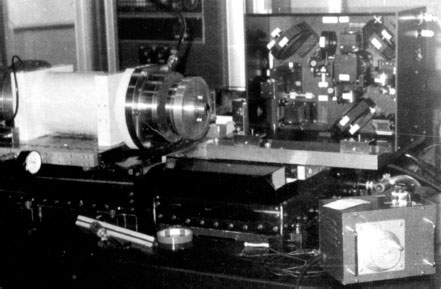
FIGURE 34.4 Photograph of the zone-plate interferometer of A-type.
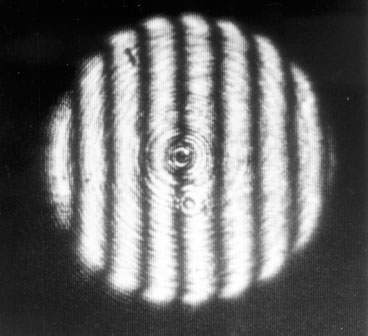
FIGURE 34.5 Interference fringes obtained by moving the zone-plate interferometer perpendicularly to the optical axis (spherical mirror without shape error).
Experimental result of the mirror without shape error is shown in Figure 34.5. The fringe pattern is modulated by a carrier component. A fringe pattern of the spherical mirror with shape error is shown in Figure 34.6. The shape error is obtained by analyzing the fringe distortion. Figure 34.7a and b is a three-dimensional (3D) plot and a contour map of the shape error of the spherical mirror, respectively.
To verify the results by zone-plate interferometer, the same test surfaces were measured with the Fizeau interferometer. Fringe patterns obtained with the Fizeau interferometer are shown in Figures 34.8 and 34.9. Figure 34.10a and b is a 3D plot and a contour map of the shape error of the spherical mirror, respectively. They are calculated by a fringe-scanning method [6]. Comparison of Figure 34.7 with Figure 34.10 shows that the results obtained by two different methods agree well.
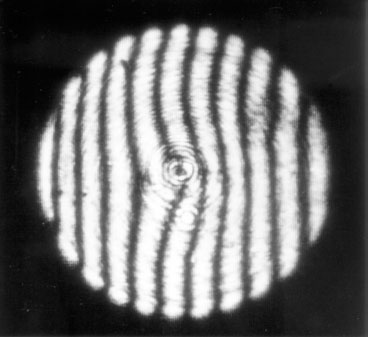
FIGURE 34.6 Interference fringes obtained by moving the zone-plate interferometer perpendicularly to the optical axis (spherical mirror with shape error).
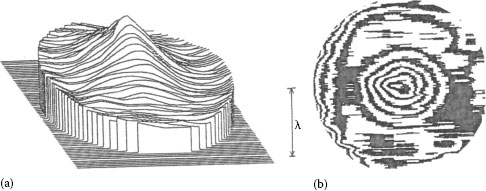
FIGURE 34.7 (a) Three-dimensional plot of the shape error of a spherical mirror analyzing by the zone-plate interferometer and (b) contour map of the shape error of a spherical mirror analyzing by the zone-plate interferometer. The height between adjacent contour lines is 0.05 μm.
34.2.2 ZONE-PLATE INTERFEROMETER OF B-TYPE
In the zone-plate interferometer of A-type, a diffracted light beam of (-1, 0) is used as a test light beam and that of (0, +1) is used as a reference light beam. Numerical aperture (NA) of the lens, which is used as an observation lens, depends on the NA of the mirror being tested because the lens has the focal point at the center of the curvature of the mirror and the light emanating from the entire surface of the mirror to the lens expands over the lens. When a mirror with a large NA is measured, an observation lens with an NA larger than that of the mirror should be used. Furthermore, when the mirror surface has a steep asphericity, the light focused by an imaging lens is astigmatic. The light does not converge to a small point but forms a blurred point. Use of an aperture stop with a large diameter does not result in a clear fringe pattern because extraneous diffraction wavefronts are not effectively blocked out by the aperture stop. In the former interferometer, therefore, it is difficult to measure the shape error of mirrors with a large NA and a steep asphericity.
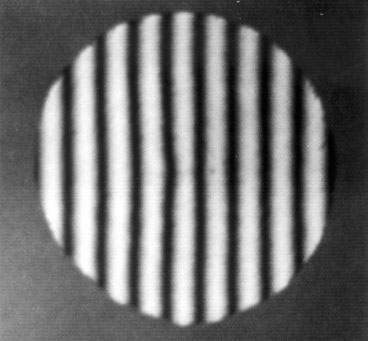
FIGURE 34.8 Fizeau interference fringes (spherical mirror without shape error).
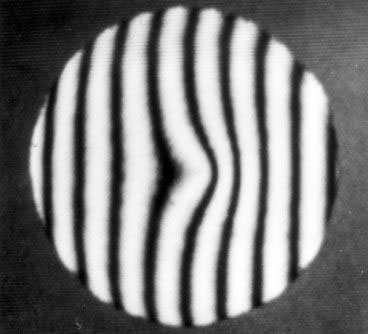
FIGURE 34.9 Fizeau interference fringes (spherical mirror with shape error).
Honda et al. proposed a zone-plate interferometer to measure the primary mirror of an astronomical telescope with a large aperture; a collimated laser light beam is used as the incident light to a zone-plate [7]. A diffracted light beam of (+1, +1) and that of (0, 0) are used as the test light beam and the reference light beam, respectively. Because the mirror has a hole at its center, another small flat mirror is placed in the hole as a reference mirror. A mirror with a steep asphericity can be measured by the interferometer. The fringes obtained by the interferometer are, however, affected by the machine vibration because the reference mirror and the mirror under test have respective vibrations.
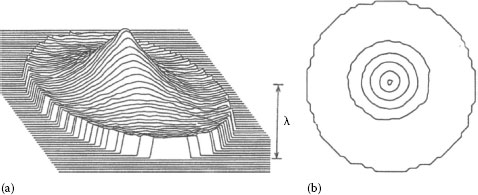
FIGURE 34.10 (a) Three-dimensional plot of the shape error of a spherical mirror analyzing by the Fizeau interferometer and (b) contour map of the shape error of a spherical mirror analyzing by the Fizeau interferometer. The height between adjacent contour lines is 0.05 μm.
To measure the shape error of mirrors with a large NA and a steep asphericity on the machine, a zone-plate interferometer applying a diffracted light beam of (−1, −1) and of (0, 0) is developed [8].
The zone-plate is illuminated by a laser light beam converging on the center O of the mirror surface as shown in Figure 34.11. An illumination system, not shown in this figure, is inserted between lenses L3 and L6. The zone-plate is made in such a way that one of the first-order diffracted lights illuminates the entire surface of the mirror. The diffracted light beam of −1, of which a typical path is indicated as E−P−B−C in Figure 34.11, generates a wavefront impinging on the mirror surface perpendicularly to the designed one.
The light beam is reflected by the mirror surface being tested and impinges on the zone-plate. It is again diffracted by the zone-plate. The diffracted light beam travels along a path indicated as B−P−E. The wavefront of the diffracted light beam involves the shape error of the mirror being tested and, therefore, the diffracted light beam of (−1, −1) is used as the test light beam. The diffracted light beam of (0, 0), actually non-diffracted light beam, of which typical path is indicated as F−Q−A−O−B−P−E, generates the spherical wavefront coming from the center of the mirror surface being tested so that the wavefront does not involve the shape error and is used as the reference light beam. Fringes obtained by the interferometer are scarcely affected by the machine vibrations, because the reference position is located at the center O of the mirror being tested.
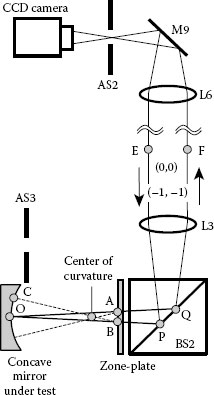
FIGURE 34.11 Schematic diagram of the zone-plate interferometer of B-type. Note: AS, aperture stop; BS, beam splitter; L, lens; M, mirror. (From Nomura, T. et al., Opt. Rev., 3, 34, 1996. With permission.)
Lens L3 used as an illumination lens is also used as an observation lens. The lens has the focal point at the center of the mirror surface and receives only lights reflected on the area between P and Q, as shown in Figure 34.11, that is, the concave mirror under test lens does not depend on the NA of the test mirror. The shape error of a mirror with a large NA is, therefore, measured by the improved interferometer. Because the wavefront from lens L3 to lens L6 is a plane, a small spot appears at aperture stop AS2. Extraneous wavefronts are, therefore, blocked out almost completely by the aperture stop. Clear interference fringes are observed even though the mirror surface has a large steep asphericity. The zone-plate interferometer of B-type is shown in Figure 34.12.
The dimensions of the zone-plate interferometer of B-type are 300 × 220 × 315 mm. Optically parallel glass plates with a diameter of 50.0 mm and a thickness of 3.00 mm were used as substrates of the zone-plates. The zone-plates used for the experiments were of phase type and were manufactured with an instrument consisting of an ultraprecision lathe and an Ar laser with a wavelength of 458 nm [9]. Pitch manufactured with the instrument is limited to a minimum of 2.0 μm. The accuracy of the zone-plate grating is 0.1 μm. The zone-plates were manufactured by the following procedure: (1) the glass plates were coated with photoresist so that they could be used as photographic plates; (2) the photographic plates were mounted in the chuck of the lathe and rotated; (3) grating lines were drawn on the plates by exposing them to a beam from an Ar laser mounted on the lathe; (4) the photoresist exposed to the laser beam was removed by development; (5) the entire surfaces of the plates were coated by SiO2; and (6) the plates were submerged in a solvent and the unexposed photoresist and its SiO2 coating were removed, leaving behind the SiO2 coated on the exposed grating lines. Therefore, the zone-plate gratings have a binary phase structure [7]. The back surfaces of the zone-plates were coated with SiO2 to prevent reflections from the surfaces. The intensity of the test light beam should be equal to that of the reference light beam to obtain interference fringes with a high visibility. The zone-plates were made in such a way that the first-order diffraction efficiency of the zone-plates was equal to the zero-order diffraction efficiency.
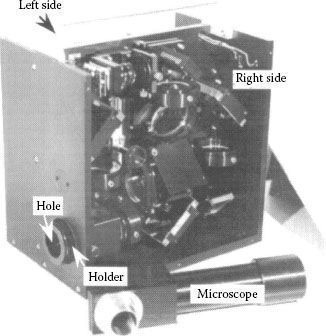
FIGURE 34.12 Photograph of the zone-plate interferometer of B-type. (From Nomura, T. et al., Opt. Rev., 3, 34, 1996. With permission.)
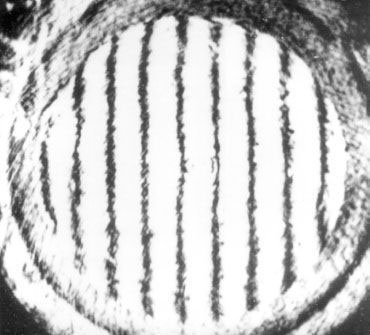
FIGURE 34.13 Fringe pattern of a spherical mirror obtained by the improved interferometer. (From Nomura, T. et al., Opt. Rev., 3, 34, 1996. With permission.)
Two metallic mirrors were manufactured by the ultraprecision cutting machine and used as mirrors to be tested. One was a spherical mirror with a curvature radius r of 140 mm and a diameter d of 30 mm (NA: d/r = 0.21). The other was a parabolic mirror with a focal length f of 70 mm, a diameter of 50 mm (NA: d/2f = 0.36), and the shape difference from the same sphere was 4.45 μm maximum at the margin.
The interferometer was moved perpendicularly to the optical axis to obtain straight interference fringes. Figure 34.13 shows a fringe pattern formed on the spherical mirror; this fringe pattern was observed on the entire surface of the mirror in spite of the large NA. The fringe pattern of the parabolic mirror was observed in spite of its steep asphericity (Figure 34.14).
34.2.3 ZONE-PLATE INTERFEROMETER OF C-TYPE
A simple type of zone-plate interferometer to measure precisely the positioning error of a cutting tool is discussed [10]. We called the interferometer, zone-plate interferometer of C-type. The zone-plate is made in such a way that the first-order diffracted light beam that diverges from the center line travels in a direction perpendicular to the mirror surface and the diffracted light beam that converges is directed to the vertex of the mirror. The diverging diffracted light beam is reflected from the entire surface of the mirror and is nominally recollimated at the zone-plate. Therefore the light beam (+1, +1), of which a typical path is indicated as B−D−B−F in Figure 34.15, generates a wavefront, involves the shape error, and acts as a measurement beam. On the other hand, the converging diffracted light beam is reflected at the vertex of the mirror and is recollimated at the zone-plate. Therefore the light beam of (−1, −1), of which a typical path is indicated as A−O−B−F in Figure 34.15, generates a wavefront, does not involve the shape error, and acts as a reference beam. Other unnecessary rays of diffracted light beam are removed by an aperture stop. Reference and measurement light beams make a fringe pattern on an image plane.
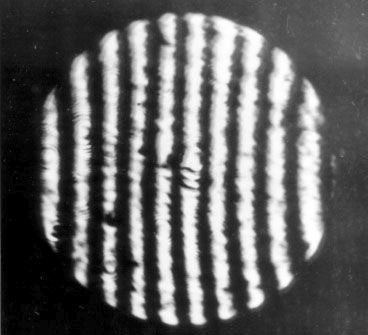
FIGURE 34.14 Fringe pattern of a parabolic mirror obtained by the zone-plate interferometer of B-type. (From Nomura, T. et al., Opt. Rev., 3, 34, 1996. With permission.)
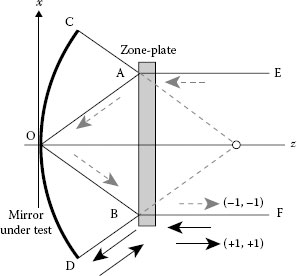
FIGURE 34.15 Diffracted and transmitted beams through a zone-plate.
Schematic diagram of the zone-plate interferometer C-type is shown in Figure 34.16. A zone-plate is set at the midposition between the vertex of the spherical mirror being tested and the center of curvature of the mirror. The error in the shape of the mirror and the positioning error of the tool can be determined by analyzing the interference fringes.
To determine the position of the mirror, reference flat mirror M5 is used. The collimated light reflected on beam splitter BS goes to mirror M5, is reflected by it, and goes to the CCD camera. When mask 1, which has a hole in it, is set in front of the mirror under test, the light reflected by mirror M5 and the light reflected at the vertex of the mirror under test make interference fringes on the image plane of the CCD camera. The mirror under test is adjusted until null interference fringes appear, and the mirror is then in the correct position. When the mirror is being measured, mask 1 in front of the mirror is removed and mask 2 is inserted in front of reference flat mirror M5.
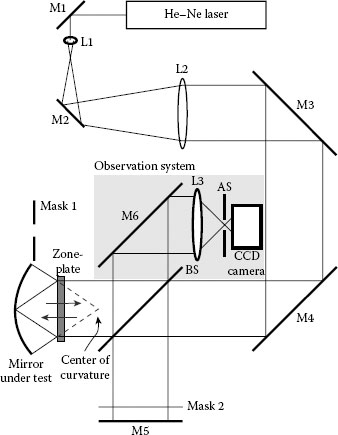
FIGURE 34.16 Schematic diagram of the zone-plate interferometer of C-type.
The location of the tool is indicated by Cartesian coordinates, as shown in Figure 34.17. The z-axis is along the spindle of the lathe and the x- and y-axes are perpendicular to the z-axis. The cutting tool moves in the xz-plane from the minus side of the x-axis to the vertex of the mirror. We assume that the feed error of the tool is negligible. The surface of a mirror is concave and symmetrical with respect to the z-axis. The positioning error in the y-direction causes an error in the shape near the vertex. This positioning error can be determined by observing the shape near the vertex with a microscope and removed easily. The positioning error in the z-direction causes an error in the thickness of the mirror but does not cause an error in the shape of the mirror surface. The positioning error in the x-direction influences the entire surface of the mirror, and is discussed in this chapter.
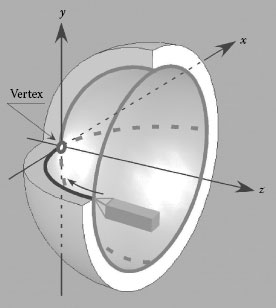
FIGURE 34.17 Location of a tool in Cartesian coordinates.
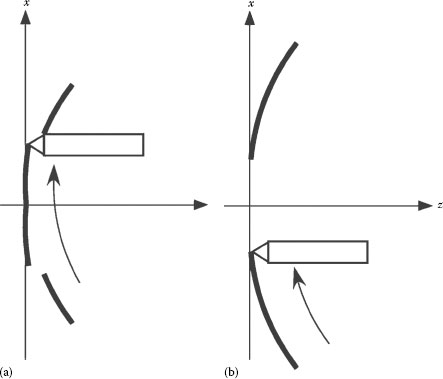
FIGURE 34.18 Profiles of concave mirrors manufactured with an ultraprecision lathe; (a) tool is mounted on the plus side of the correct position and (b) tool is mounted on the minus side of the correct position.
Let us suppose that a spherical concave mirror is being manufactured with a tool that moves from the minus side of the x-axis to the vertex of the mirror. If the tool is positioned on the positive side of the correct position side of the correct position, that is, if the final position of the tool is on the plus side of the x-axis, the mirror will be manufactured as shown in Figure 34.18a. On the other hand, the mirror shown in Figure 34.18b will be manufactured by a tool that is positioned on the negative side of the correct position.
Spherical and aspherical mirrors are manufactured with an ultraprecision lathe. Suppose that the designed spherical concave mirror with a radius of curvature R and the manufactured mirror are illuminated by laser light diverging from center of curvature A of the reference mirror, as shown in Figure 34.19. The designed mirror and the manufactured one are the reference mirror and the mirror being tested, respectively. Furthermore, suppose that the error in the shape of the manufactured mirror is caused only by the positioning error of the tool. Arc a indicates the profile of the reference mirror and arc b indicates the profile of the manufactured mirror, if the tool is attached on the negative side of the correct position.
The reference light reflected from the reference mirror and the test light reflected from the manufactured mirror will produce concentric interference fringes on the mirror surface. Twice the distance BB′ shown in Figure 34.19 is equal to the optical path difference between the two rays of light. The distance BB′ is given by the following equation:
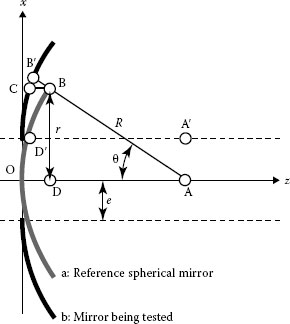
FIGURE 34.19 Optical path difference between the reference spherical mirror and mirror being tested.
where BC is given by Equation 34.3.
If N is the fringe order and λ is the wavelength of the laser light, BB′ can be expressed by Equation 34.4.
The error e is derived from Equations 34.2 through 34.4 and is given by the following equation:
When r is sufficiently small compared to R and λ is sufficiently small compared to r, the above equation becomes approximately
This equation is also valid when the tool is mounted on the positive side of the correct position, as shown in Figure 34.18a.
The absolute value of the error is calculated by Equation 34.6. The sign of the positioning error is determined by the following method. The manufactured mirror is moved to the minus side of the x-axis or the interferometer is moved to the plus side until the interference fringes without the carrier component are observed along the x-axis on half of the mirror. If the fringes without the carrier component are observed on the right side of the mirror, the sign of the error is minus because the upper part of the arc a is superimposed on the upper part of the arc b. On the other hand, if the fringes without the carrier component are observed on the left side of the mirror, the sign of the error is plus. The distance between the original position of the mirror and the position after the movement of the mirror is equal to the absolute value of the positioning error.
The zone-plate interferometer of C type is shown in Figure 34.16. That is 410 × 300 × 320 mm in size and is mounted on a moving stage of the ultraprecision lathe. Two spherical concave mirrors with the interferometer are measured. Test mirror 1 had been manufactured with a tool that had some positioning error on the minus side of the x-direction. Test mirror 2 had been manufactured with the tool set at the correct position. The design dimensions of the test mirrors 1 and 2 were a radius of curvature of 140 mm, a diameter of 30 mm, and a thickness of 50 mm. The zone-plate used for the experiments was a computer-generated hologram manufactured with an instrument that consists of an ultraprecision lathe. Optically parallel glass plate with a diameter of 50.0 mm and a thickness of 3.00 mm was used as the substrate of the zone-plate. The minimum pitch of the zone-plate gratings was 3 μm. The first-order diffraction efficiency of the zone-plate was 38%.
When spherical concave mirrors are measured, measurement errors can be caused by a number of factors: the setting of the zone-plate, the optical elements of the zone-plate interferometer, the wavefront transmitted through the substrate of the zone-plate, and the analysis of the fringes. The total error with respect to the shape measurement was less than 0.18 μm, that is, the fringe order was 0.57. By substituting 0.57 into N in Equation 34.6, the error e caused by the tool positioning can be measured with an accuracy of less than 1.7 μm.
Figure 34.20a shows the fringe pattern of the test mirror 1 which was manufactured with the tool with some positioning error. The maximum order N of the interference fringes was nine. When the order of the interference fringes is substituted in Equation 34.4, the positioning error e is 27 μm.
The mirror was moved to the minus side of the x-axis and interference fringes without the carrier component were obtained on the x-axis for half of the mirror. Figure 34.20b shows the fringe pattern when the mirror was moved −27 μm in the x-direction. The positioning error is, therefore, 27 μm on the minus side of the x-axis. Figure 34.20a and b is the interference fringes obtained by the Fizeau interferometer.
Simulations were performed by the ray tracing method for the same conditions as those of the experiments, and the results are shown in Figure 34.21a and b. The fringe patterns obtained in the experiments agreed well with the fringe patterns obtained by the computer simulation of the experiments (Figure 34.20). After the experiments, the positioning error of the tool was corrected and test mirror 2 was manufactured with the tool set at the correct position (Figure 34.22).
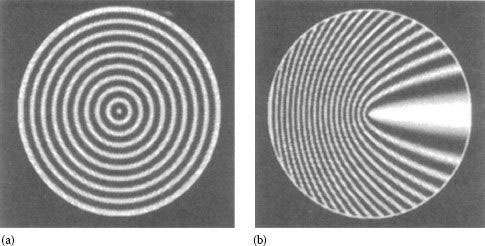
Figure 34.20 Fringe patterns obtained by computer simulation for test mirror 1: the positioning error of the cutting tool was −27 μm; (a) fringe pattern without a carrier component and (b) fringe pattern with a carrier component.
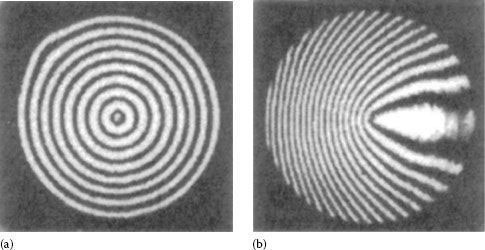
FIGURE 34.21 Fringe patterns obtained by the zone-plate interferometer for test mirror 1: (a) fringe pattern without a carrier component and (b) fringe pattern with a carrier component on the half of the mirror along the x-axis.
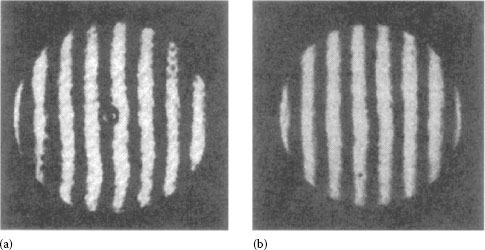
FIGURE 34.22 Experimental results for test mirror 2: (a) fringe pattern obtained by the zone-plate interferometer of C type and (b) fringe pattern obtained by the Fizeau interferometer.
34.3 LATERAL-SHEARING INTERFEROMETER
Lateral-shearing interferometry has been used extensively in diverse applications such as the testing of optical components and systems and the study of flow and diffusion phenomena in gases and liquids [11]. The method of lateral-shearing interferometry consists of displacing the defective wavefront laterally by a small amount and obtaining the interference pattern between the original and the displaced wavefronts. A lateral-shearing interferometer proposed by Yatagai and Kanou have employed a fringe-scanning method using a piezoelectric-driven mirror to measure the interference fringes obtained by the interferometer precisely [12]. The interferometer is, however, affected by mechanical vibrations and air turbulence because it is not a common-path type. Murty proposed a lateral-shearing interferometer in which a wavefront under test can be sheared by a single parallel flat or a slightly wedge-shaped plate [13]. To produce a compact and lightweight interferometer, Shakher et al. proposed a shearing interferometer using holo-lenses that are made by the interference between diverging spherical and plane wavefronts [14]. A common path lateral-shearing interferometer with a minimum number of optical components is developed that is not affected by the mechanical vibrations and the air turbulence [14]. In the lateral-shearing interferometer, a plane parallel glass plate is used to shear the wavefront under test. A fringe-scanning method using a slight tilt of the glass plate is used to measure the fringes obtained by the interferometer precisely. In the interferometer discussed in this section, similarly, zone-plates that are computer-generated holograms are used to produce a compact interferometer for measuring spherical and aspherical surfaces.
Figure 34.23 is a schematic diagram of the common-path lateral-shearing interferometer. A laser beam collimated by lenses 1 and 2 becomes a spatially coherent plane wavefront beam and illuminates a zone-plate. The beam is diffracted at the zone-plate and goes to the mirror being tested. In the interferometer, two zone-plates are used. One zone-plate is used to determine the design position of the mirror being tested. The other zone-plate is used to measure the error in the shape of the mirror. The first zone-plate is made in such a way that the first-order diffracted light beam converges at the vertex of the mirror surface. The diffracted light beam reflected from the vertex of the mirror is diffracted at the zone-plate and nominally recollimated. The recollimated light beam is reflected at the beam splitter and goes to a plane parallel glass plate. The glass plate is used to shear the wavefront of the recollimated light, that is, lateral-shearing interference fringes are produced by the optical path difference between the wavefront reflected from the front surface of the parallel glass plate and that from the rear surface.
When the mirror being tested is located at the design position, null interference fringes are obtained. After the mirror has been placed at the design position, the zone-plate is replaced with the other zone-plate to measure the error in the shape of the mirror. The zone-plate is made in such a way that the first-order diffracted light beam converges on the optical axis and travels in a direction perpendicular to the surface of the mirror under test and illuminates the entire surface of the mirror. The light is reflected from the mirror, is diffracted at the zone-plate, and is nominally recollimated. Therefore, the zone-plate functions as a null lens. Extraneous light beams are blocked out almost completely by the aperture stop located at the focal point of the zone-plate.
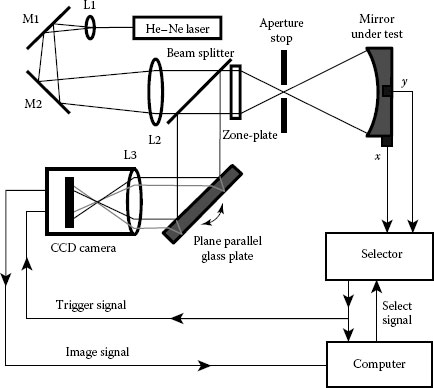
FIGURE 34.23 Schematic diagram of a lateral-shearing interferometer.
The wavefront under test may be expressed as W(x, y), where (x, y) are coordinates of a point of measurement P. When this wavefront is sheared in the x-direction by an amount S, the sheared wavefront at the same point is W(x − S, y). The resulting optical path difference ΔW(x, y) at P between the original and the sheared wavefronts is W(x, y) − W(x − S, y). When S is small, the optical path difference is written as follows:
where
λ is the wavelength of the light source
n is the order of the interference fringe
The interference fringes obtained by the lateral-shearing interferometer represent the derivative of the aberration in the laterally sheared direction of the wavefront under test. By integrating the phase distribution, the shapes of cross sections of the mirror under test in the laterally sheared direction are obtained. To get the two-dimensional (2-D) wavefront shape, integration is performed in two mutually perpendicular directions, that is, in the x-direction and y-direction. Because the mirror under test is mounted on the chuck of the lathe and revolves on the axis of the lathe spindle, the mirror can be measured at one position and then measured again when the mirror has revolved through 90°. Consequently, mutually perpendicularly sheared interference fringes can be obtained. The shapes of the wavefront cross sections in the two directions are calculated independently. The center line parallel to the y-axis is used for comparing relative heights in the shape of the cross section in the direction. When the shear distance is long, the measurement area becomes small and high-frequency components of the shape error obtained by the fringes are lost. On the other hand, when the shear distance is too short, the wavefront cannot be analyzed because no fringes are obtained. Therefore, the shear ratio is generally from 10% to 20% of the diameter of the wavefront under test. Photograph of the lateral-shearing interferometer is shown in Figure 34.24.
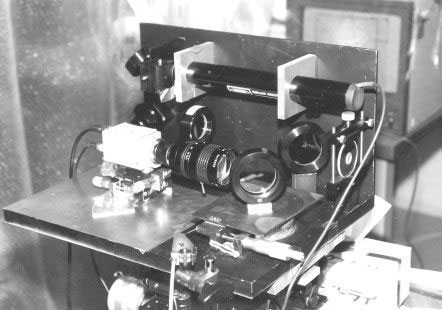
FIGURE 34.24 Photograph of the lateral-shearing interferometer.
The fringe-scanning method [13,14] is applied to analyze the fringes precisely. A slight tilt of the glass plate produces an optical path difference between the two wavefronts, that is, the wavefront reflected from the front surface of the glass plate and that from the rear surface, and gives a change in the phase of the fringes. Four laterally sheared fringe patterns are obtained by a CCD camera. The phase distribution of the fringe pattern is analyzed from these four patterns. Consequently, the error in the shape of the mirror under test is obtained by these calculations.
Two metallic concave mirrors were measured by the interferometer shown in Figure 34.24. One was a concave spherical mirror with a diameter of 100 mm, a radius of curvature of 500 mm, and a thickness of 30 mm. The other was a concave parabolic mirror with a diameter of 50 mm, a focal length of 70 mm, and a thickness of 60 mm. These mirrors had been manufactured on an ultraprecision lathe in advance, were reattached to the chuck of the lathe, and were revolved at 400 rpm. Figure 34.25 shows a photograph of the experiments. The position sensors shown in Figure 34.23 detect the positions of the mirrors, that is, in the x-direction and the y-direction.
When the mirrors reach the directions required to measure, the sensors feed trigger signals to the computer and the CCD camera and fringe patterns are recorded with the computer. Optically plane parallel glass plates with a diameter of 50.0 mm and a thickness of 3.00 mm were used as the substrates of the zone-plates and as the plate used to shear the wavefront under test. The zone-plates used for the experiments were the same zone-plates measured by the zone-plate interferometer of C-type.
Four interference fringes of the concave spherical mirror were obtained with this lateral-shearing interferometer in which the wavefront was sheared in the x-direction. In the measurement, phase shifts were introduced in steps of λ/2 between each interference fringes; similarly, another four interference fringes of the mirror were obtained with the interferometer in which the wavefront was sheared in the y-direction. The phase distribution analyzed by the fringe-scanning method is shown in Figure 34.26a and b. After the phase unwrap procedure of the phase distribution [9] had been carried out, the phase distributions were integrated along the two sheared directions. The error in the shape of the mirror under test was analyzed from the results. Figure 34.27a and b shows the error in the shape of the concave spherical mirror as measured by the lateral-shearing interferometer.
The spherical mirror was measured by a Fizeau interferometer for comparison with the experimental results as measured by the lateral-shearing interferometer [15]. In the Fizeau interferometer, the fringe-scanning method using a piezo electric driven reference mirror was used. Figure 34.28a and b shows the error in the shape of the mirror as measured by the Fizeau interferometer. The peak-to-valley value obtained by the Fizeau interferometer was 3.18λ inside the 79 mm diameter circle, indicated as a white circle. These results agreed well with those obtained with the lateral-shearing interferometer. The concave parabolic mirror was also measured by the lateral-shearing interferometer. Figure 34.29a and b shows the phase distribution of the parabolic mirror as measured by the lateral-shearing interferometer. Figure 34.30a and b shows the error in the shape of the parabolic mirror as measured by the lateral-shearing interferometer. A pattern of concentric contour lines with equal interval is observed. The positioning error of a cutting tool can contribute to the formation of the pattern.
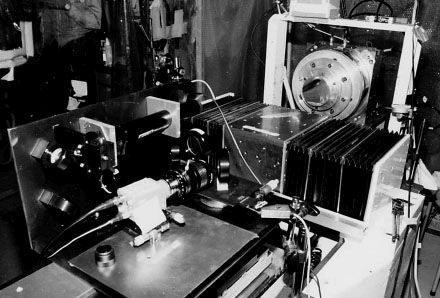
FIGURE 34.25 Photograph of the measurement system.
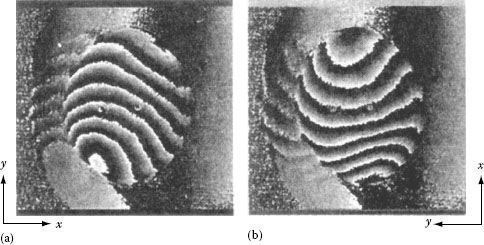
FIGURE 34.26 Phase distribution of the concave spherical mirror as obtained by the lateral-shearing interferometer: (a) phase distribution in the x-direction and (b) phase distribution in the y-direction.
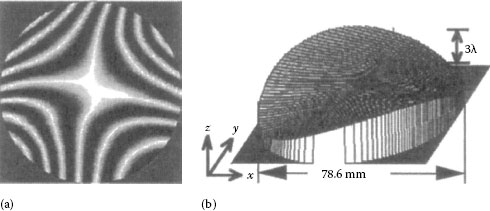
FIGURE 34.27 Error in the shape of the spherical concave mirror obtained by the lateral-shearing interferometer: (a) contour map indicating the error in the shape of the concave spherical mirror and (b) 3D plot of the error in the shape sheared directions. The error in the shape of the mirror under test was analyzed from the results.
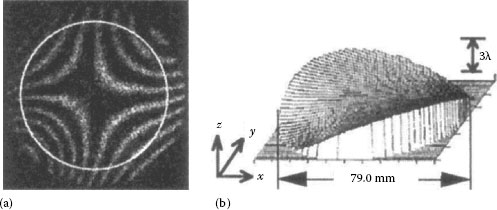
FIGURE 34.28 Error in the shape of the spherical concave mirror obtained by a Fizeau interferometer: (a) interference fringes obtained with a Fizeau interferometer and (b) 3-D plot of the error in the shape.
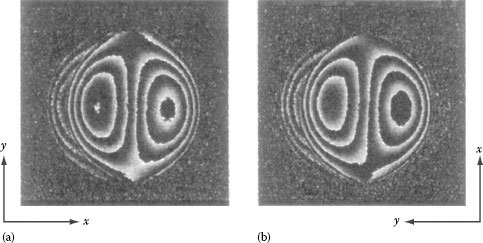
FIGURE 34.29 Phase distribution of the parabolic mirror as obtained by the lateral-shearing interferometer: (a) phase distribution in the x-direction and (b) phase distribution in the y-direction.
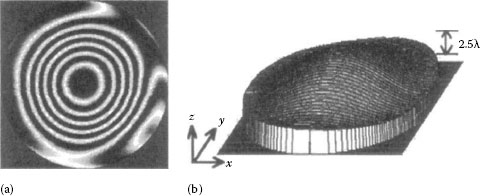
FIGURE 34.30 Error in the shape of the parabolic mirror obtained by the lateral-shearing interferometer: (a) contour map indicating the error in the shape of the parabolic mirror and (b) 3-D plot of the error in the shape.
1. Kohno, T. and Tanaka, S., Figure measurement of concave mirror by fiber-grating Hartmann test, Opt. Rev., 1, 118, 1994.
2. Murty, M. V., Common path interferometer using Fresnel zone-plates, J. Opt. Soc. Am., 53, 568, 1963.
3. Smartt, R. N., Zone-plates interferometer, Appl. Opt., 13, 1093, 1974.
4. Nakajima, K., Measurement of quadric surface by using zone-plate, Jpn. J. Opt., 14, 365, 1985 (in Japanese).
5. Nomura, T. et al., Shape measurement of workpiece surface with zone-plate interferometer during machine running, J. Prec. Eng., 15, 86, 1993.
6. Burning, J. H., Digital wavefront measuring interferometer for testing optical surfaces and lenses, Appl. Opt., 13, 2693, 1974.
7. Honda, T. et al., Zone-plate null interferometer for measuring aspherical mirror with large aperture, Proceedings of SPIE, International Symposium on Optical Fabrication, Testing and Surface Evaluation, Tokyo, Japan, (Optical Fabrication, Testing and Surface Evaluation), Vols. 1720–1736, p. 305, 1992.
8. Nomura, T. et al., Zone-plate interferometer for measuring the shape error of mirrors with large numerical aperture and steep asphericity, Opt. Rev., 3, 34, 1996.
9. Nomura, T. et al., An instrument for manufacturing zone-plates by using a lathe, J. Prec. Eng., 16, 290, 1994.
10. Nomura, T. et al., Zone-plate interferometer to measure the positioning error of a cutting tool, J. Prec. Eng., 20, 112, 1997.
11. Malacara, D., Lateral shearing interferometers, In Optical Shop Testing, New York: Wiley, p. 105, 1992.
12. Yatagai, T. and Kanou, Y., Aspherical surface testing with shearing interferometer using fringe scanning detection method, Opt. Eng., 23, 357, 1984.
13. Murty, M. V., The use of a single plane parallel plate as a lateral-shearing interferometer with a visible gas laser source, Appl. Opt., 3, 531, 1964.
14. Shakher, C., Godbolr, P. B., and Gupta, B. N., Shearing interferometer using holo-lenses, Appl. Opt., 25, 2477, 1986.
15. Nomura, T. et al., Shape measurements of mirror surfaces with a lateral shearing interferometer during machine running, J. Prec. Eng., 22, 185, 1998.