17
Internet of Things Control Center with Node-RED
In this project, you’ll create an Internet of Things app to control your favorite household electronics from a web server using Node-RED, a powerful and easy-to-use tool for Internet of Things applications.
PARTS REQUIRED
Raspberry Pi
Breadboard
DHT22 temperature and humidity sensor
4.7 kΩ resistor
Two 5 mm LEDs
Two 330 Ω resistor
Jumper wires
SOFTWARE REQUIRED
Node-RED DHT node
Node-RED dashboard
You’re going to create a Node-RED application that controls outputs and reads inputs in the local network. You’ll use it to control LEDs, as well as to read and display temperature and humidity values using the DHT22 sensor—all remotely through a web server.
INTRODUCING NODE-RED
Node-RED is an open source visual wiring tool for building IoT applications that comes already installed on your Pi’s operating system and is designed to run perfectly with the Pi.
Node-RED uses visual programming, with blocks called nodes that you wire together to perform a certain task, simplifying much of the programming significantly. Node-RED allows you to prototype a complex home automation system quickly and simply, giving you more time to spend on designing and making cool stuff.
We won’t cover everything that Node-RED can do in this project, but here’s a brief breakdown if you want to explore further:
- Access the Pi’s GPIOs.
- Establish a connection with other boards like the Arduino and ESP8266.
- Create a responsive graphical user interface.
- Communicate with third-party services.
- Retrieve data from the web.
- Create time-triggered events.
- Store and retrieve data from a database.
Installing the DHT22 Nodes
Although the Node-RED software comes already installed with the Pi’s operating system, it doesn’t come with a node able to read from the DHT22 sensor. We need to install that first, by installing npm (Node Package Management) like so:
pi@raspberrypi:~ $ sudo apt install npm
When prompted, type Y and press ENTER. The installation may take a few minutes. Then, enter the following command to upgrade npm to the latest 3.x version, which is the version recommended for use with Node-RED:
pi@raspberrypi:~ $ sudo npm install -g [email protected]
pi@raspberrypi:~ $ hash -r
These commands will output a warning message, but don’t worry—it’s harmless, so you can ignore it.
Next you’ll download and unzip a C library for the Raspberry Pi. You need this library to control DHT22 through Node-RED. At the time of writing, the latest version of the library is 1.55. Before you install the library, go to http://www.airspayce.com/mikem/bcm2835/ and check the latest version. Then, enter the following commands, replacing the 1.55 highlighted in italics with the latest version.
pi@raspberrypi:~ $ wget http://www.airspayce.com/mikem/bcm2835/
bcm2835-1.55.tar.gz
pi@raspberrypi:~ $ tar zxvf bcm2835-1.55.tar.gz
Finally, enter the following list of commands to compile and install the nodes needed to control the DHT22 sensor and add dashboard support:
pi@raspberrypi:~ $ cd bcm2835-1.55
pi@raspberrypi:~/bcm2835-1.55 $ ./configure
pi@raspberrypi:~/bcm2835-1.55 $ make
pi@raspberrypi:~/bcm2835-1.55 $ sudo make check
pi@raspberrypi:~/bcm2835-1.55 $ sudo make install
pi@raspberrypi:~/bcm2835-1.55 $ cd
pi@raspberrypi:~ $ sudo npm install -–unsafe-perm -g node-dht-sensor
pi@raspberrypi:~ $ sudo npm install --unsafe-perm -g node-red-
contrib-dht-sensor
pi@raspberrypi:~ $ sudo npm install --unsafe-perm -g node-red-
dashboard
With all of that installed, reboot your Pi. Now we’ll give you a quick tour of Node-RED.
Getting Started with Node-RED
To open Node-RED, go to the terminal and enter the following:
pi@raspberrypi:~ $ sudo node-red start
Your terminal window should show something like Figure 17-1. The highlighted line shows your localhost’s Raspberry Pi IP address followed by the number of the port the Node-RED server is running on. Localhost is a hostname that means “this computer” and resolves to the IP address shown in the terminal window: http://127.0.0.1. Using this IP address you can access Node-RED only in your Raspberry Pi browser. To access Node-RED in any browser on your local network, you need to find your Pi’s IP address.
NOTE
Usually, instead of going to the terminal, you can open Node-RED by going to the taskbar main menu and clicking Programming ▸ Node-RED. However, in this project, you need to start Node-RED from the terminal because DHT22 nodes require administrator permission.
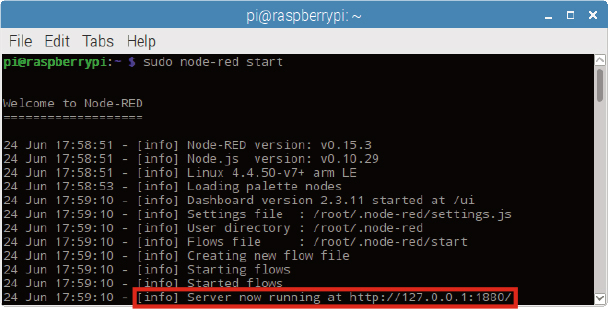
FIGURE 17-1: Starting Node-RED from the terminal
To find your Raspberry Pi IP address, enter the following in the terminal:
pi@raspberrypi:~ $ hostname -I
Open Chromium and enter http://<Pi IP address>:1880/, replacing <Pi IP address> with your Raspberry Pi’s IP address. Your Node-RED page server should open as shown in Figure 17-2.

FIGURE 17-2: The Node-RED editor in your browser
On the left you’ll see a list of blocks, or nodes. Nodes are grouped according to their function; scroll down the list to see what you have. We’ll just cover a small number of existing nodes in this project, including nodes from the input, Raspberry_Pi, function, and dashboard sections, illustrated in Figure 17-3.

FIGURE 17-3: Some of the Node-RED nodes
The center box of your Node-RED page is the flow section; this is where you drag the nodes and wire them together to build your application. On the right are several tabs: the info tab shows information about a selected node, the debug tab is used for debugging purposes, and the dashboard tab is where you organize the user interface widgets of your application. Finally, the Deploy button saves the changes made to the flow and executes it. Next you’ll wire up your hardware, and then put together your flow in Node-RED.
WIRING THE CIRCUIT
You should already be familiar with LEDs and the DHT22 sensor, but for a refresher on the DHT22 sensor, check Project 12. To wire the circuit, follow these instructions:
Connect 5 V and GND from the Pi to a red and blue breadboard rail, respectively.
Insert two LEDs into the breadboard. Wire the shorter lead of each LED to the GND rail through a 330 Ω resistor. Wire the longer lead of one LED to GPIO 18, and the longer lead of the other LED to GPIO 17.
Insert the DHT22 into the breadboard (with the raised side facing you) and wire it according to the following table. Your completed circuit should match Figure 17-4.
DHT22 |
RASPBERRY PI |
1 |
3.3 V |
2 |
GPIO 4 and 3.3 V (via 4.7 kΩ resistor) |
3 |
Don’t connect |
4 |
GND |

FIGURE 17-4: Wiring the DHT22 and two LEDs to the Pi
CREATING THE FLOW
The script, in this case, is the flow you’ll make in Node-RED. This flow will allow you to do the following:
- Control an LED with an on and off switch. This LED will also be time-sensitive, which means it will automatically light up and turn off at a specific time that you set.
- Control another LED with PWM using a slider to act as a dimmer switch.
- Read the temperature from the DHT22 sensor and display it on a time-versus-temperature chart.
- Read the humidity from the DHT22 sensor and display it on a gauge.
First you’ll make the user interface you’ll use to control the components from your server.
Creating the Dashboard User Interface
Nodes from the dashboard section provide widgets that show up in your application user interface (UI) to control components. Every widget—like a button, slider, or chart—you add to the flow has to be associated with a group that tells the widget where it should appear on the UI.
You’ll also need tabs, which are like pages in your application (like tabs in a browser). Groups are sections within a tab, where you can group widgets together. In any project, you’ll need to create tabs and groups in your dashboard to organize the widgets in the UI. You’ll build a tab called “Home” with one group called “Dashboard.”
Using Figure 17-5 as a reference, select the dashboard tab ➊ in the top right and then press the + tab button ➋ to create a new tab under the Tabs list. Click edit to edit the tab ➌ and enter the name Home. Once that’s created, press the + group button ➍ to create a new group; then click edit ➎ and enter the name Dashboard.

FIGURE 17-5: Creating tabs and groups in the dashboard
To see how your dashboard currently looks, go to http://<Pi IP address>:1880/ui in your browser, replacing <Pi IP address> with your Raspberry Pi’s IP address you got earlier. As you can see in Figure 17-6, your user interface is empty at the moment because you haven’t added any widgets, so let’s add some functionality next.

FIGURE 17-6: The Node-RED user interface
Wiring the Nodes
Now you’re going to add nodes to your flow. Your flow will control the LEDs connected to the Raspberry Pi GPIOs and read temperature and humidity from the DHT22 sensor.
Adding a Switch and Scheduling Events
Go back to the Node-RED editor and add two inject nodes from the input section by dragging them into the flow. When you drop them in the flow, their name will change to timestamp. Add a switch from the dashboard section, and an rpi gpio output node (the one with a joint on the left side) from the Raspberry_Pi nodes section. Arrange the nodes and wire them as shown in Figure 17-7.
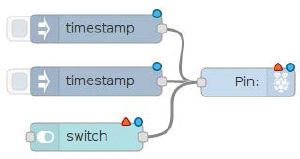
FIGURE 17-7: The flow for controlling LED 1
This set of nodes controls the LED connected to GPIO 17. This LED can be controlled remotely with an on and off switch, and it is also time sensitive; timestamp 1 determines the time the LED lights up, and timestamp 2 determines the time the LED turns off.
If you double-click a node, a new window will open that allows you to edit the node’s properties. Double-click the first timestamp node and edit its properties like so: set the payload number to 1, which sends 1 to the Raspberry Pi GPIO 17 when this node is triggered. In the repeat field, select at a specific time and choose the time and day you want your LED to light up; you’ll choose the time to turn it off in timestamp 2. We chose 19:00 (7 PM) for all days of the week. You can choose whatever times and days you want. The name field lets you name the node, and in our case we’ve called it On at 7PM. When you’re done editing your node, click the Done button. Figure 17-8 shows the properties we set for this node.
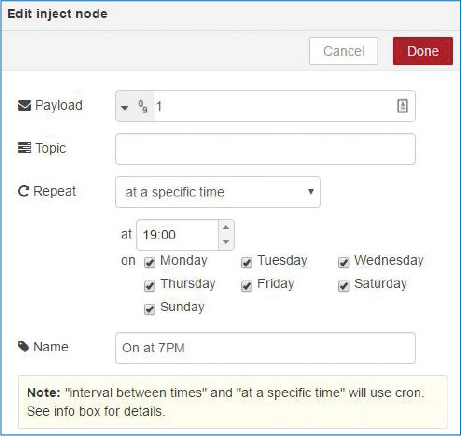
FIGURE 17-8: Editing the inject node properties
Edit the other nodes’ properties to match those in the following table.
NODE |
PROPERTIES |
timestamp |
Payload: number 1 |
timestamp |
Payload: number 0 |
switch |
Group: Dashboard [Home] |
pin |
GPIO: GPIO17 – 11 |
To run your Node-RED application, click the Deploy button at the top right. This will also save the changes. To see how your application looks, go to http://<Pi IP address>:1880/ui in the browser. At this point, it should look like Figure 17-9.

FIGURE 17-9: The user interface with the LED 1 control switch
Click the switch to test whether you can control the LED connected to GPIO 17. If not, go back and make sure you’ve wired your nodes correctly and set the right properties.
Adding a Slider
Now, you’ll add the nodes to control the brightness of the LED connected to GPIO 18. Drag a slider and an rpi gpio output node into the flow, and arrange them as in Figure 17-10.
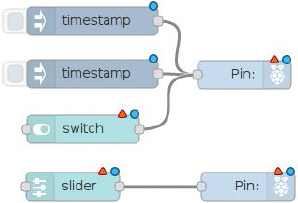
FIGURE 17-10: The flow for controlling LED 1 and LED 2
Edit the new nodes’ properties as shown in the following table.
NODE |
PROPERTIES |
slider |
Group: Dashboard [Home] |
pin |
GPIO: 12 – GPIO18 |
This new set of nodes controls the LED connected to GPIO 18 using PWM. Moving the slider will change the LED brightness. Click the Deploy button, go to the Node-RED UI, and test your application. It should look something like Figure 17-11.
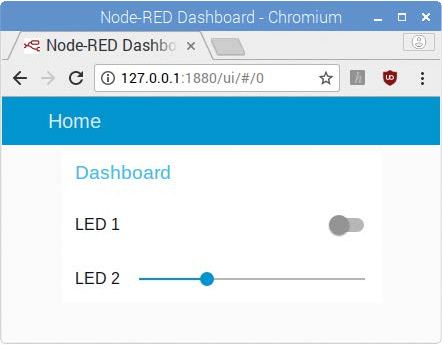
FIGURE 17-11: The user interface with the LED 1 switch and the LED 2 slider
Adding a Temperature Chart and Humidity Gauge
Finally, to create a temperature chart and a humidity gauge, drag an inject node, rpi dht22 node, function node, a chart, and a gauge to the flow. The chart and the gauge are dashboard nodes. Arrange the nodes so your flow looks like Figure 17-13.

FIGURE 17-12: The complete Node-RED flow
Edit the new nodes’ properties with the settings in the following table.
NODE |
PROPERTIES |
timestamp |
Payload: Boolean true |
rpi-dht22 |
Sensor model: DHT22 |
chart |
Group: Dashboard [Home] |
f |
Name: Get humidity |
gauge |
Group: Dashboard [Home] |
Click the Deploy button and once again test your application. Remember, if you run into any trouble, make sure that your properties match the tables here and double-check the wiring of your nodes against the figures.
RUNNING YOUR APPLICATION
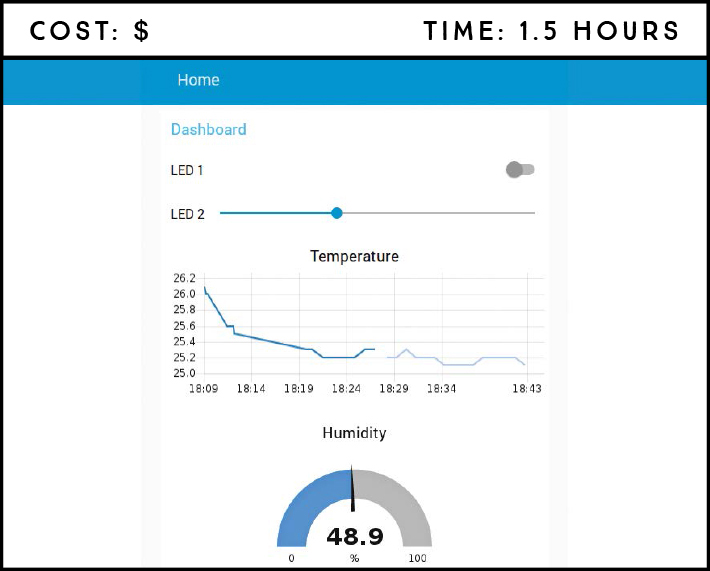
Congratulations! You’ve built your first IoT application with Node-RED. Go to http://<Pi IP address>:1880/ui to see how your user interface looks. You can access this URL using any browser on the local network, whether that’s on your computer or smartphone. Figure 17-13 shows the final circuit you can control using your Node-RED application.

FIGURE 17-13: IoT project with Node-RED
Your application has a switch to control LED 1, which is also time sensitive; a slider to control the brightness of LED 2; and a chart and gauge to display temperature and humidity.
TAKING IT FURTHER
This project just scratched the surface of what Node-RED can do. Here are some ideas for taking this project further:
- Replace the time-sensitive LED with a relay and a lamp (refer to Project 16 for an introduction to the relay module).
- Add more sensor readings to your application, like the smoke sensor and movement detection.