
CONTENTS
19.3.1 Intensity Detection Method
19.3.2 Focus-Error Detection Method
19.3.4 Contrast Detection Method
19.3.5 Conoscopic Holography Method
19.3.6 Chromatic Confocal Imaging Method
19.4.1 Shape from Focus/Defocus Method
19.4.2 Pattern Projection Method
19.4.2.1 Traditional Techniques
19.4.2.2 Digital Techniques in Pattern Projection
19.4.2.3 Trends in Profilometry
A great number of research papers on profilometry have been presented, but few systems have been commercialized up to now. Especially three-dimensional profilometry (3D profilometry) [1] is one of the most important topics in the present academic study and in industrial research. Conventionally, a coordinate measuring machine (CMM) with a contact type of stylus (so-called touch probe or touch sensor) has been popular in various fields. However, recent rapid and remarkable progress in optical techniques and computer technology has been bringing novel noncontact type of 3D measuring machines. In addition to the traditional contact probe, a lot of non-noncontact probes based on laser triangulation or optical coaxial principle have become popular.
What fields in academic study and/or industry require noncontact 3D measuring systems? Electrical and electronic engineering (semiconductors, various elements and devices, etc.), mechanical engineering (aircrafts, car, machine tool, engines, gears, dies, etc.), optical engineering (lenses, prisms, etc.), civil engineering, medicine (medical and biomedical imaging, live body, internal organs, endoscopic application, etc.), dentistry (teeth, oral cavity, etc.), apparel industry (human body, clothing, etc.), cosmetics industry (human face, body, skin, etc.), security (face, biometrics, etc.), industrial design, and so on.
However, it is extremely difficult to systematically classify various noncontact measurement methods, hence let us consider several methods from the viewpoint of “stand-off-distance (SOD)” (Table 19.1).
A lot of academic principles and practical systems have been reported which are represented in Figure 19.1. There exist numerous methods in addition to these. But this fact is not desirable, because it is meant that the powerful and versatile method that is applicable to any purpose does not exist. All requests cannot be covered by only one principle.
Contact Methods |
Mechanical Stylus |
Noncontact methods |
|
Optical principles |
|
Point-wise measurement |
Optical stylus and laser probe |
Line-wise measurement |
Optical section |
Full-field measurement |
|
Close range |
Confocal microscopy and interferometry |
Short range |
Moire method and space encoding method |
Middle range |
Pattern projection method |
Long range |
Photogrammetry and laser tracker |
Far range |
Range finder |
Nonoptical methods |
Capacitance, magnetism, and ultrasonics |
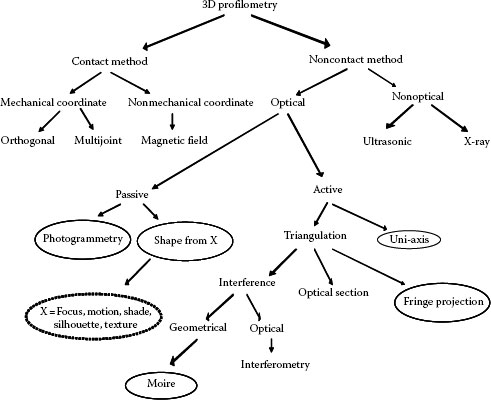
FIGURE 19.1 Classification of methods for 3D profilometry.
Most of these methods are reviewed exhaustively in Chapter 20. Topics such as moire method and photogrammetry as well as interferometry are independently described in other chapters. In the following sections, a limited number of principles will be discussed.
One of traditional 3D profilometry is stereoscopy which has a long history in practical use. However, until the 1970s, we had to rely on photographic recording, and optical measuring instruments precisely calibrated were indispensable. Consequently, a very long time was required in mathematical calculation for data analysis.
One example is shown in Figure 19.2 where nine astronauts were examined by stereo-photography to check change of body shapes in advance to and after the Skylab flight in space. According to a report [2], they lost their total weight, and region change is found especially in their thighs which became thin. We should pay attention to devices like a tape measure and the reference targets and optical arrangement which are still informative in elementary experimental work.
At present, this kind of stereoscopic photography is revised up to digital photographic method described in detail in Chapter 22. This digital photogrammetry is potentially one of the powerful tools due to rapid progress in a megapixel charge-coupled device (CCD) camera and PC technologies. In my personal and a little dogmatic opinion, digital photogrammetry in addition to range finding method based on time-of-flight principle may grow up to a standard tool in 3D profilometry.
Looking back at the history of 3D profilometry, it was difficult in the 1960s to capture a 3D shape of an objective by a single shot of a photographic picture. “Moire topography,” invented by Prof. Hiroshi Takasaki in 1970, brought an innovative progress in 3D profilometry, because he succeeded in expressing the 3D shape by moire contours which give intuitive understanding of 3D shapes [3]. The picture shown in Figure 19.3 was given to the author with a message that “Both of two pictures should be used at the same time because these are stereoscopic pair of moire photos. These pair is available to know a hill or a valley on the surface shape.” picture is not useful to identify concavity or convexity of the shape. As is easily understood, moire topography can be classified into a stereoscopic principle, because the optical configuration consists of two optical axes: one for projection and the other for observation.
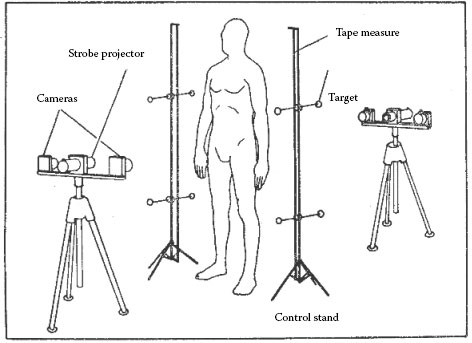
FIGURE 19.2 Experimental setup for stereographic method. (Courtesy of Prof. M.W. Whittle.)
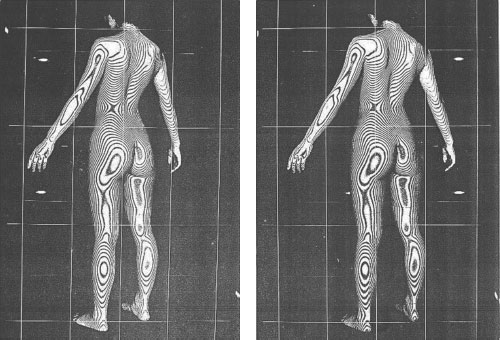
FIGURE 19.3 Stereo-pair of moire pictures. (Courtesy of Prof. Hiroshi Takasaki.)
The details of moire method are explained in Chapter 9. The fundamental principle of this moire method was adapted by various pattern projection methods. Here, the term “pattern projection method” implies a concept that totally covers moire topography, fringe projection, structured light method, space encoding, and others.
Today, an optical probe based on optical triangulation is attached to the conventional CMM (usually equipped with a stylus). Figure 19.4 shows an optical scheme for triangulation method, where a beam spot projected onto an objective surface is focused through a lens on the focal plane of a detector (CCD or position-sensitive device [PSD] is popular). The position of the beam spot (A′, B′, C′, etc.) varies in accordance with the position of a beam spot on the sample surface (A, B, C, etc.). By a simple geometrical relations between A, B, C, etc. and A, B, C, etc. we can easily find the distance or displacement from this probe to the target point A, B, C, etc. This optical arrangement looks, at a glance, simple, but the “Scheimpflug rule” (another similar principle called “Hinge rule” is found in discussion on view camera focus [4]) has to be satisfied to make the spot sharply focused. The lens plane LP and the focal plane FP should intersect on the point P along the beam projection axis. This principle is well known in designing a view camera. In order for the beam spot to be in focus, the three fundamental planes, the film plane, the lens plane, and the plane of sharp focus, need to be converged along one common line (Scheimpflug line).
A measuring system of a human body is represented in Figure 19.5 which was developed in 1986 by a project team under financial support of the Japanese government. Using this “measuring capsule unit,” the mesh data over the surface points from the shoulder to the thighs can be captured with every 4 mm separation in 3 min. The body was horizontally scanned by a laser beam from six directions, and the light spot was detected by six CCDs. At the same time, these six sensors are moved down from the shoulders to the thighs in 120 s. They intended to use these data to manufacture clothes, shoes, and chairs. However, mainly because of long calculation time by “minicomputer” at that time, this interesting project did not fully succeed in commercial applications. However, today, owing to 30 years of technological progress, similar systems are commercially successful in the apparel and shoes markets.

FIGURE 19.4 Principle of triangulation method.
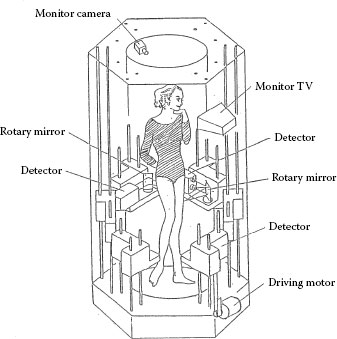
FIGURE 19.5 Body measuring capsule unit. (From the document of human body measurement project in Japan.)
In this section, fundamental techniques used for two-dimensional profile measurement are described. This kind of optical sensor based on triangulation is in widespread use and sometimes called a “laser displacement meter.” One of shortcomings inherent to this principle is in that it has two optical axes: for projection of a beam and for detection of the beam spot. This optical configuration causes “occlusion” that some area over the object is not measured due to blocking of the light. To solve this problem, a uniaxis arrangement (coaxis or line-of-sight arrangement) is required.
19.3.1 INTENSITY DETECTION METHOD
A lot of papers have been reported to meet this requirement. One of fundamental trials is shown in Figure 19.6 where the intensity change due to displacement of a light spot is detected [5]. One result shows such accuracy as 0.25 μm over the range of 12.7 μin. was attainable 30 years ago. This schematic of the system is shown in Figure 19.6. An image of a pinhole source (S) is projected on a surface of a sample (O) through the beam splitter BS1 and the microscopic objective (L). The light reflected from the sample surface forms the images at P1 and P2. A large area photodetector measures the total intensity I1 at P1. Another detector with a slit in front of it measures the intensity I2 of a part of the light through the slit. The intensity I1 is a measure of the reflectivity of the sample surface, and the intensity I2 is a measure of the displacement along the optical axis. The output signal of the system should be given by normalizing I2 by I1 to be I2/I1. If the sample surface is displaced a small amount z longitudinally, the position of the image P2 shifts by the amount of M2z (M, lateral magnification). Using a simple geometrical approximation for z ≪ d/M2, the intensity is expressed as a function of a displacement z as follows:
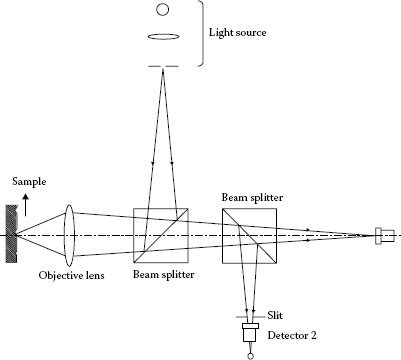
FIGURE 19.6 Optical scheme of intensity detection method. (Courtesy of Dr. Takeo Sawatari.)
TABLE 19.2
Characteristics of the Prototype (1979)
Stand-off distance |
1.38 μm |
Linear range |
12.7 μm |
Linearity |
±1.0% |
Error |
Max. 0.25 μm |
Minimum spot size |
10 μm |
Scanning speed |
2.3 μm/s |
where
I2(z) and I2(0) are the intensities of the detector Ph2 at the longitudinal surface positions z and 0 (reference position), respectively
Δs is the slit width
r0 is the radius of the pupil of the objective lens
b is the distance from the pupil plane of the lens to the initial image point P2 (for z = 0)
As the sample is moved in x direction, z is calculated by the equation, that is, the profile of the surface is obtained by this principle.
The profile of a machined surface obtained by this optical transducer correlates well with the result by a mechanical profilometer with a diamond stylus. This paper was published in 1979, and the specification of the prototype instrument shown in Table 19.2 may not be surprisingly high at this point of time. However, this suggestive paper is still useful to know the fundamental principle of intensity detection method in profilometry.
19.3.2 FOCUS-ERROR DETECTION METHOD
A number of methods have been proposed for a noncontact displacement sensor using the focus-error detection system. The most fundamental principles were presented in 1980s including the astigmatism [6], knife-edge [7], and critical-angle methods [8]. These methods can attain high resolution by using simple optical configurations.
In Figure 19.7, focus-error detection using astigmatism method is shown where a cylindrical lens is inserted intentionally to produce anastigmatic aberration.
A quadrant detector (with four elements) is available to judge where the object surface is positioned: whether at the focus position or this side or that side of the original focus point.
The critical-angle method using a right angle prism is presented by Kohno and other three persons in 1988 [8], and this excellent principle was adopted to a commercial instrument called HIPOSS (high precision surface sensor). Inspection of machined surface by single point diamond turning and semiconductors require noncontact precise surface sensors instead of conventional mechanical stylus methods. The main reason was in that the conventional stylus may scratch the surface of soft metal, thin films, and silicon wafer. One result showed such high resolution as 1 nm in the vertical direction and proved to be applicable to a surface with inclination of ±5° by this compact and light weight system.
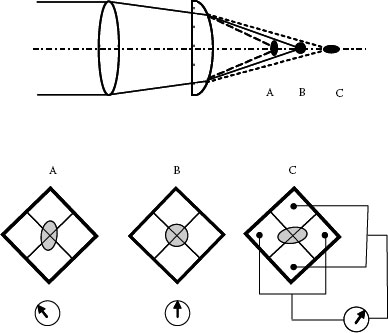
FIGURE 19.7 Principle of astigmatism method.
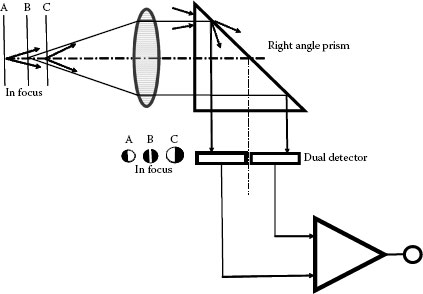
FIGURE 19.8 Principle of critical-angle method. (Courtesy of Prof. Tsuguo Kohno.)
Figure 19.8 shows the principle of the method. After passing through the microscope objective, the reflected light converted into parallel flux if the surface under test is in focus at the position B. A total reflection prism is located to reflect the light at the critical angle, and thus, the same levels of light intensity are incident on the photodetector with dual element. Consequently, the out-of-focus signal becomes zero. When the object surface is at position A, close to the lens, the light flux diverges slightly after passing through the lens. As a result, the light on the upper side of the optical axis shown in the figure strikes the prism at an angle smaller than the critical angle. This causes the light to be reflected, and it passes out of the prism. The light on the lower side of the optical axis is totally reflected at a large incidence angle, creating a difference in the output of the photodiodes and thereby producing an out-of-focus signal. At position C, far from the lens, the opposite phenomenon occurs and a signal with the reverse sign is obtained (Table 19.3).
TABLE 19.3
Specifications of Rodenstock Model RM 600 3-D/C
Vertical measuring range |
300 μm |
Vertical resolution |
0.01 μm |
Horizontal measuring range |
100 × 100 mm |
Horizontal resolution |
1 μm |
Sampling rate |
2000 Hz, maximum |
Maximum measuring speed |
260 mm/min |
Maximum positioning speed |
800 mm/min |
Maximum load |
20 kg |
Specimen table size |
185 × 185 mm |
The real optical system of a microfigure measuring head is illustrated in Figure 19.9. A laser diode with a 780 nm wavelength is incorporated in this head, and a polarized beam splitter (PBS) and a quarter-wave plate is provided to serve as an optical isolator. This design is employed to prevent noise caused by light radiation process. A half-mirror is used to split the optical paths to avoid any effects of object surface inclination on the measured results. By calculating the next signal
displacement in the vertical direction can be exclusively detected. The arrangement that the light is reflected toward inside the prism improves detection sensitivity. Figure 19.10a shows one measurement result together with the result using a stylus method (Figure 19.10b). Another principle is based on Foucault method. One example is shown in Figure 19.7 where the focal point is determined by using a pair of dual-element detectors. Here the objective lens is controlled to find the focal point by detecting the balance of light volume given to this pair and the up-and-down moving distance of the lens gives the distance from the lens to the measuring point, that is, surface profile [9] (Figure 19.11).
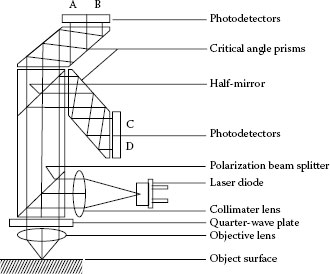
FIGURE 19.9 Optical layout of HIPOSS system. (Courtesy of Prof. Tsuguo Kohno.)
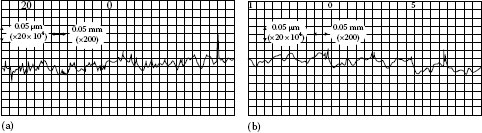
FIGURE 19.10 Comparison of measurement result of diamond turned Al surface: (a) by HIPOSS and (b) by mechanical stylus. (Courtesy of Prof. Tsuguo Kohno.)
One more similar commercial system is the Rodenstock Model RM 600 3-D/C topography measuring station which is used for mapping the topography of the surface [10]. It is applicable not only to conventional surface but to delicate surfaces which may be damaged by a contact stylus. Also a noncontact optical sensor which uses a dynamically focused infrared laser is incorporated. Focal point diameter is approximately 2 μm. The displacement of the objective lens is measured inductively, and this change is proportional to the vertical displacement of the surface point to be measured.
However, it is frequently indicated that unreasonable displacement signals, which do not appear in the case of a stylus instrument, are superposed on measurement results, depending on the material and processing method of the surface. One reason of this problem is the speckle noise included in the reflected light due to scattering at the measured surface. To solve this problem, a novel optical stylus for surface profiling system is reported which consists of a displacement measurement optical system based on the knife-edge method [11].
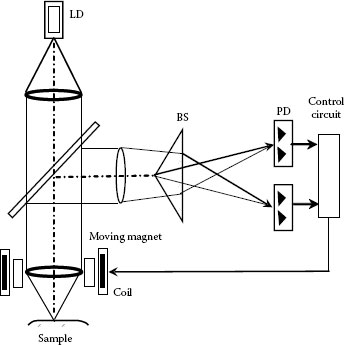
FIGURE 19.11 Principle of focus detection method (UBM, UB16).
Optical stylus measurement system using any kind of focus-error detection makes use of segmented photodiodes to detect reflected light. The displacement signal is obtained from the difference in an output of each photodiode. The intensity distribution of reflected light is supposed to be uniform or to follow a Gaussian distribution. But the speckle pattern causes unequal intensity distribution, when microirregularity exists on a measuring surface. It can be seen that speckle pattern changes according to location even for the same sample. Consequently, if reflected light with the unequal speckle pattern is received by a segmented photodiode, the displacement signal might be affected by the speckle and measurement error might be arisen. Figure 19.12 shows the configuration of a displacement measurement system for removing the influence of speckle noise (intensity irregularities). In the figure, section A enclosed by the broken line represents the displacement measurement optical system using the knife-edge method, and section B the system for detecting speckle noise. The light source is LD (λ: 670 nm) with a beam diameter of 3.5 field lens L2, f = 50 mm. Light irradiated from an LD is focused onto the measuring surface by the objective lens L1. The light reflected back from the surface passes through the beam path in the reverse direction, and is deflected by a PBS. One beam of light is passed through a knife-edge and detected by two-segmented photodiode (2PD-1), and displacement signal Esn is operated. The other reflected beam of light is bent by the beam splitter (BS) and directly detected by 2PD-2, and signal Er is operated. Here, Esn is a displacement signal in which the speckle noise is included, while Er is a signal having the speckle noise only. Operating difference between Esn and Er, that is, Es = Esn – Er, can therefore generate a displacement signal with the speckle noise removed.
These principles mentioned earlier are similar or essentially same with the principle that have been used for optical pickups used for digital memory disks such as a compact disk (CD) or a DVD (digital versatile/video disk). This means commercially manufactured CD pickups are potentially available for distance sensor to measure the surface profile.
Bartoli et al. proposed to revise an optical pickup (SONY KSS-210A) to utilize as a displacement sensor [12]. The use of principles for CD pickups as distance sensors in optical profilometry is a well-established practice. A sophisticated application of this device is: by making use of builtin objective lens-tracking actuator of the pickup to perform one-dimensional beam scanning of the sample. This prototype profilometer is made up of a standalone sensor-actuator optical head that can be easily positioned on samples of complex shapes with every orientation and can be operated by a remote control system. When two-dimensional scanning is unnecessary or even impossible, as for surface quality inspection of bulky mechanical pieces, a device that uses a CD pickup as both the sensor and the actuator is cheaper, faster, lighter, more compact, and more versatile than standard object-scanning setups that use x–y translation stages. A lateral scan range of 800 mm and a vertical scan range of 160 mm are achieved. This example suggests a good application of devices manufactured in large numbers. These products are reliable because of quality control in manufacturing.
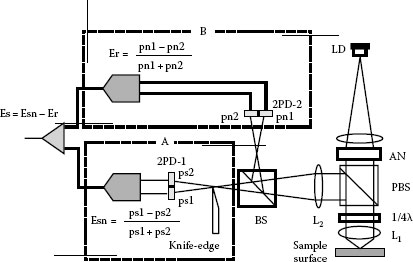
FIGURE 19.12 Configuration of optical stylus sensor for removing speckle noise. Notes: A, focus error detection system by the knife-edge method; B, measurement system for the intensity irregularity. (Courtesy of Prof. Hiroya Fukatsu.)
Another principle is found in Figure 19.13 where a kind of coaxial confocal microscopic method is found [13]. The waist point of a laser beam projected on the specimen surface is scanned along the longitudinal axis by a moving mirror and timing that the spot size becomes smallest is measured. Generally, in coaxial confocal microscopic method, a beam irradiated from LD is focused on a target point on the surface through the lens.
Then the reflected beam moves back through the lens to the detector with a pinhole in front. In most of the cases, this focused point is controlled by the lens so as to be in focus, that is, to be in conjugation with the pinhole. Therefore, if the lens is moved up and down, this system works as a displacement meter to give a distance to the measuring point. However, moving the lens speedily is not always easy, and here a small and light weight mirror is moved to control the spot position. Schematic construction of a prototype sensor is seen in Figure 19.14, and some specifications are also shown in Table 19.4.
19.3.4 CONTRAST DETECTION METHOD
Several types of optical sensors based on triangulation are widely used for many applications due to their simple technique. Triangulation may be applied to both displacement detection and profile measurement. Many optical displacement sensors based on triangulation use semiconductor PSD or CCD (Table 19.5).
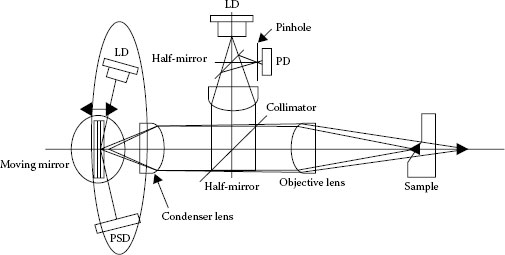
FIGURE 19.13 Principle of confocal coaxial sensor head. (Reproduced on the basis of the Japan Patent No. 3809803.)
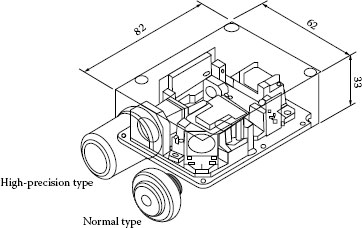
FIGURE 19.14 Configuration of prototype model. (Reproduced on the basis of the Japan Patent No. 3809803.)
TABLE 19.4
Main Features of Two Prototype Models
Type 1 |
Type 2 |
|
Stand-off-distance (mm) |
13.8 |
12.0 |
Measuring range (μm) |
±50 |
±500 |
Linearity (μm) |
±0.5 |
±2.0 |
Resolution (μm) |
0.01 |
0.1 |
TABLE 19.5
Specifications of a Prototype Probe
Stand-off distance |
2.3 mm |
Linear range |
150 mm |
Vertical resolution |
1 μm |
Linearity |
±1.3% |
Projected pattern size on the object |
900 μm |
These sensors produce erroneous measurements if the surface of the object is not uniform in color or if it is inclined at an angle. In these cases, the intensity of light received by the detector varies with color or angle and the output signal shows erroneous indication of displacement. Such defects are attributed to the fact that light projecting and receiving units are not on the same optical axis but lie along two different axes. Various kinds of displacement sensors that adjust a focus along a single axis have been developed to overcome this type of error. To solve the problems relating to the influence of color or inclination of an object surface, an apparatus designed to sense the variation of contrast of a projected pattern is developed [14]. This sensor uses the variation of contrast of the edges of a quadrant pattern of light and shade region that is projected on an object along a single optical axis.
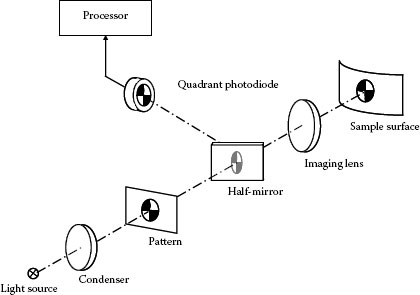
FIGURE 19.15 Optical arrangement for contrast detection method.
The optical system for displacement detection is shown in Figure 19.15. A quadrant pattern consisting of highly distinct light and dark regions is projected by an objective on the object’s surface. The quadrant pattern image thus projected on the surface is reimaged by the lens and reflected by a half-silvered mirror onto a quadrant photodiode (hereafter referred to as 4PD) of the same size as the original quadrant pattern. The pattern projected on the surface is such that it can be observed by the naked eye. The size of the pattern useful for detection can be adjusted on the 4PD by selecting the appropriate objective lens. Contrast of the quadrant pattern image becomes higher when the image and the surface of the object coincide. The image on the surface becomes low in contrast as the object is displaced from this ideal image position. Thus, the axial displacement of the surface along the optical axis is determined by sensing the contrast of the image as is shown in Figure 19.15, the contrast of the pattern is obtained as signal S is computed so that it is largely uninfluenced by differences of reflectivity of the surface or variations of the intensity of the light source. Signal S is given by
where
I1 and I3 are the signals due to the bright regions of the pattern
I2 and I4 are the signals due to the dark regions of the pattern
In the case of an objective lens of 20× magnification, the range of measurement of this displacement sensing apparatus is linear from 100 to 250 μm behind the image position.
When the surface is inclined by 30°, errors remain within 3%. Error due to color variations is the same. The measurement technique may be used at inclinations up to 45°. The results obtained with the objective lens of 20× magnification are summarized in Table 19.5, which indicates that vertical resolving power obtained over a range of 150 pm was 1 μm. Although the visual diameter of the pattern projected on the measurement object surface is 900 μm, the actual diameter used is 200 μm, since the region where light is detected on the 4PD corresponds to a central region with the diameter determined within a range of 200 μm.
19.3.5 CONOSCOPIC HOLOGRAPHY METHOD
As is mentioned previously, there are a lot of reports and proposals on a coaxial type of optical probes. Among these sensors, one of the most successful commercial products is known as “ConoProbe” (Optical Metrology Ltd.) [15,16]. Figure 19.16 shows the optical arrangement to represent the fundamental principle. This shows the arrangement used for conoscopic hologram recording. Let a light wave with wavelength λ propagate in a birefringent crystal at an angle φ relative to the optical axis. If the ordinary and extraordinary indices of refraction are no and nE, respectively, and their difference is Δn = nE – no, then two orthogonally polarized waves will propagate, one with an index of refraction no (the ordinary ray), and the second, the extraordinary ray, with an index of refraction nE given approximately by
The phase retardation between the extraordinary and ordinary waves is given by
where L indicates the length of the crystal and θ ≪ 1.
This expression means that the incident angle (which is dependent on the distance from the target point) determines this retardation Δϕ, that is to say, distance from the target point to the crystal is given by Δϕ. And, due to this phase retardation Δϕ, interference similar to polarization interference is brought. The interference fringe shown in the figure varies in accordance with the angle θ, that is, the distance to the object. Displacement can be calculated by processing the fringe pattern.
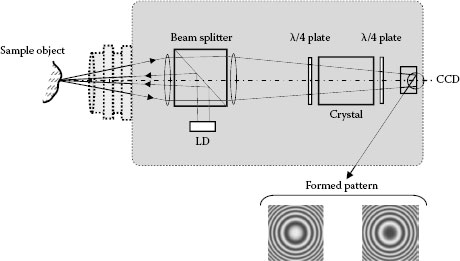
FIGURE 19.16 Principle of ConoProbe sensor. (Courtesy of Dr. Gabriel Y. Sirat.)
19.3.6 CHROMATIC CONFOCAL IMAGING METHOD
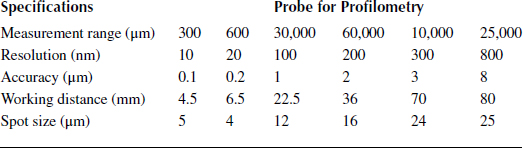
A commercialized optical sensor named “CHR” is constructed on the basis of a quasiconfocal microscopic configuration with extended range in z-direction [17]. This extension, a large range of measurement, is attained by spectral (chromatic) coding in the z-axis. In traditional confocal microscopy, when x–y scanning is added, we obtain the image of a plane located at the same distance from the objective lens, eliminating influence from points outside this thin plane. This property is called “optical sectioning” in z-direction, and it constitutes the principal feature of confocal microscopy. As is easily understood in Figure 19.17, this optically sectioned plane is determined by the wavelength to be used (now the wavelength: λ0). Then, if we change the wavelength λ continuously (instead of moving some mechanical element like a lens), we can achieve “dynamic focusing” easily.
Details of this sensor are described on the webpage of STL SA, and the characteristics of the CHR sensor are given as follows:
• The principle of confocal imaging yields an excellent spatial resolution regardless of ambient illumination.
• The chromatic coding ensures that measurement is insensitive to reflectivity variations in the sample and allows to work with all types of materials, transparent and opaque, specular or diffusing, polished or not, with no need to treat the sample prior to measurement.
• The use of a white light source and not of a coherent source (laser) eliminates completely all the difficulties associated with speckle.
This principle is so simple that it has been known for a long time; however, it was not easy to produce commercial products. Because the indispensable key devices such as spectrometers were not small and because small optical elements like lenses were not so popular. Due to miniaturization of elements and devices (such as a palm-top spectrometer), pen types of CHR sensors are now available in the market. Some specifications are shown in Table 19.6.
The innovative setup of chromatic confocal imaging opens new ways for simultaneous extended field confocal scanning optical microscopy and 3D profilometry with an absolute reference surface in situ.
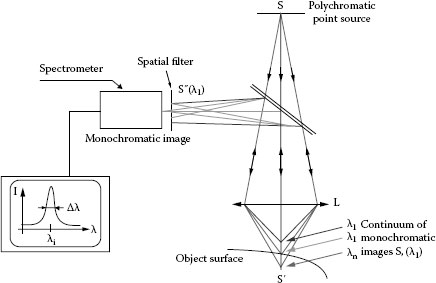
FIGURE 19.17 Principle of CHR sensor. (Courtesy of STILL, SA, France.)
TABLE 19.6
Examples of CHR Sensors for Profilometry
In addition to noncontact measurement, optical methods using an imaging technique have such an excellent feature that one scene can be captured in one moment. Therefore, a full-field measurement (sometimes called “whole-field measurement”) is an attractive matter in two- and three-dimensional profile measurements, and this “full-field measurement” cannot be attained by the point-wise measurement techniques described in Section 19.3.
19.4.1 SHAPE FROM FOCUS/DEFOCUS METHOD
One of techniques for three-dimensional profilometry is classified into “shape from X” methods in which only one camera (not one pair of cameras) is incorporated. Many SfX methods have been proposed. For example, X represents “shade,” “silhouette,” “motion,” “texture,” and so forth. One principle mentioned already [14] suggests its potential applicability to full-field measurement, because the fact that contrast variation of a projected pattern depends on distance might have been extended to the full-field measurement. In fact, one excellent method called “shape from focus/defocus” was developed to find applications mainly in semiconductor industry [18].
The methods based on triangulation including pattern projection methods suffer from serious drawbacks. One is occlusion, which brings shadings due to two optical axes. Another is multiple reflection caused by specular parts on the object surface. Furthermore, the fringe analysis method such as phase shift method and Fourier-transform method also have a drawback that measurement results are wrapped in a 2π area. This means these methods have difficulty in measuring the surface with discontinuities such as large steps and/or isolated areas. One method without any of these drawbacks is the confocal method. The confocal method performs surface measurement by using optical sectioning capability. This method allows for measurements with an accuracy of less than 1 μm and does not have any drawback inherent to triangulation, because the axes of lighting optics and imaging optics are coaxial. However, the confocal method is a time-consuming method. Since it takes several tens of seconds per scene for measuring, the method is not appropriate for in-line inspections. In order to accelerate the confocal method, there are three problems to overcome. First, conventional confocal microscopes cannot perform high-speed imaging, because the laser-scanning system takes a lot of time for 2D scanning and the Nipkow-disk scanning system cannot obtain sufficient light intensity by short time exposure. Second, the number of confocal images to be processed is enormous.
Finally, the z-axis stage, which conventional confocal systems use for axial scanning, cannot scan fast in discrete steps.
Figure 19.18 shows the construction of the nonscanning multiple-beam confocal microscope. In several respects, this system is based on the Nipkow-disk scan type confocal microscope. However, this system has no scanning mechanism. Instead of a scanning mechanism, this system has a stationary pinhole-array and a micro-lens-array that consists of the micro-lenses being coaxial to the pinholes in the pinhole-array. The pinhole-array and the micro-lens-array are fabricated on both sides of a glass substrate, and the number of pinholes in the pinhole-array, which is equal to that of micro-lenses, is almost the same as that of CCD pixels. The role of the reimaging lens is to form an image of the micro-lens-array on the CCD sensor, not to form the image of the pinhole-array onto the CCD sensor such as the Nipkow-disk system. The effects by using the micro-lens-array are as follows: (1) high illumination efficiency, (2) wide divergence angle, (3) no necessity of alignment between the pinholes and CCD sensor pixels. This system uses a halogen white lamp as its source instead of a coherent light source to eliminate noises by simple optics.
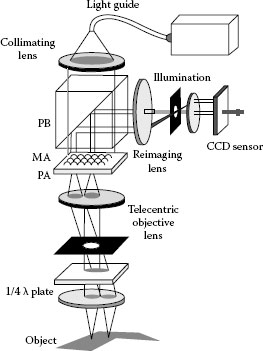
FIGURE 19.18 Nonscanning multiple-beam confocal microscope. Notes: PB, polarizing beam splitter; MA, micro-lens-array; PA, pinhole-array. (Courtesy of Dr. Mitsuhiro Ishihara.)
Let us describe this procedure referring to Figure 19.19. The confocal images I1, I2, …, In indicate the images that were obtained at positions z1, z2, …, zn where the image of the pinhole-array of the confocal system is formed. When pixel values at one certain identical location (xm, y1) in all images are arranged in the order of the z-axis position, we can see that the pixel values are obtained as sampled values from the axial response curve. The peak position of the response curve (zfocus) is estimated by an interpolation technique. When Gaussian function is adopted with the constant sampling interval Δz, the peak position zfocus is given by the next expression:
Figure 19.20 is a schematic diagram of the system which incorporates a rotating disk with different thickness of parallel glass plates embedded for adjusting the focus. The image processor with specific pipelined hardware permits to obtain a depth image with 14-bit resolution per pixel. In this system, since the image sequence contains 18 confocal images, it takes about 20 ms to obtain 1 image, and the total measurement time including data processing time is less than 0.4 s. Figure 19.21 shows two measurement results: (a) a Japanese coin, too specular for triangulation measurement and (b) a ceramics workpiece with a lot of poles 0.1–0.5 mm high. The measurement of the calibration standard verified that the system had a measurement speed of 0.4 s for the measurement range of 9.6 × 9.6 × 0.64 mm with an accuracy of 1 μm.
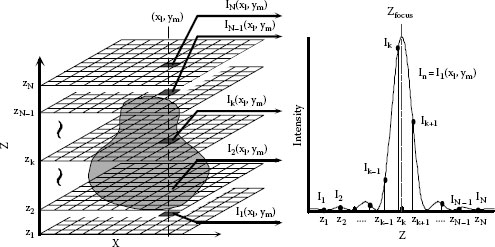
FIGURE 19.19 Principle of fast procedure of confocal images. (Courtesy of Dr. Mitsuhiro Ishihara.)
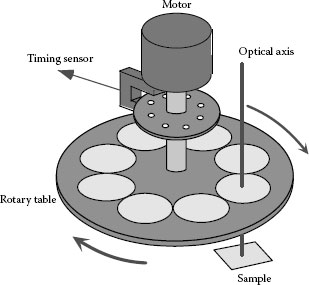
FIGURE 19.20 Fast focus shifting using rotary disk with glass plates. (Courtesy of Dr. Mitsuhiro Ishihara.)
19.4.2 PATTERN PROJECTION METHOD
Here we bundle several principles used for three-dimensional profilometry such as space encoding method, fringe projection method, structured light method, and even moire topographic method in one group called “pattern projection method.” When some kind of pattern (line pattern, grating pattern, checker board pattern, circle pattern, colored pattern, etc.) is projected onto an object to be measured, the pattern deformed in accordance to the surface profile of the specimen is captured from a different angle direction, and then this deformed image is analyzed by using some algorithm. We can easily understand the fundamental principle for space coding method in Figure 19.22.
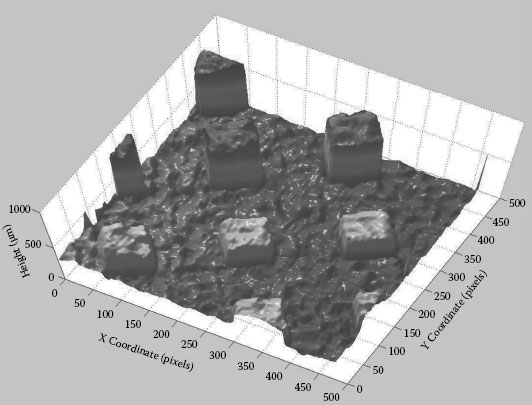
FIGURE 19.21 Measured example of ceramic workpiece with steep steps. (Courtesy of Dr. Mitsuhiro Ishihara.)
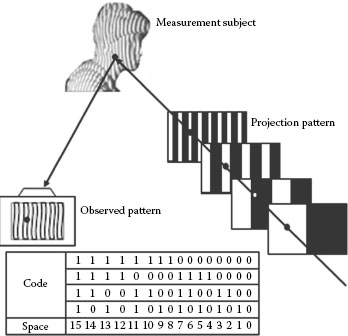
FIGURE 19.22 Space-coding method.
19.4.2.1 Traditional Techniques
Figure 19.23 also represents a fundamental optical arrangement for pattern projection methods. Any kind of reference pattern is projected onto an objective surface through a projection lens. Then, when the pattern is observed on another optical axis, a deformed or modulated pattern is seen. This deformed image involves every information on surface shape of the object. Hitherto a lot of patterns applicable to this technique has been proposed by many researchers. However, we should note two points: (1) the pattern should be formed easily, and (2) the deformed pattern needs be appropriate for analysis. Some examples are shown in Figure 19.24. This pattern should be matched with the analyzing algorithm. For example, a pattern with a sinusoidal intensity distribution is required to bring highly accurate result as far as phase-shifting techniques based on most popular three- or four-step shifting are applied. And sometimes switching a pattern to another one (changing the period of a line pattern) is requested. Figure 19.25 shows a fundamental necessity for changing the period of the reference pattern. To realize this idea, one interesting trial is found in using projection of optical interference fringe produced by acousto-optic technique [19].
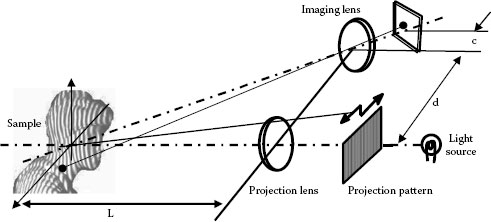
FIGURE 19.23 Fundamental arrangement for pattern projection method.
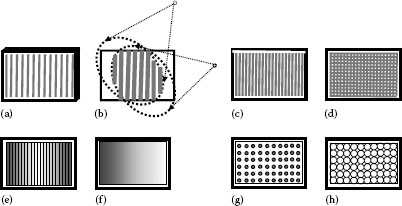
FIGURE 19.24 Various patterns for projection method: (a) Ruled grating, (b) interference fringe, (c) stripe LC grating, (d) DMD-based pattern, (e) colored pattern, (f) gradation pattern, (g) fiber grating, and (h) colored-dot pattern.
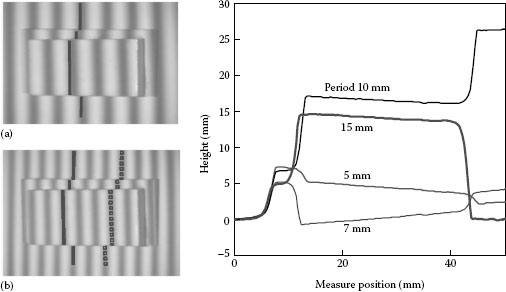
FIGURE 19.25 Necessity of period control in pattern projection method. (a) Period 15 mm and (b) period 10 mm.
For easy production of changeable pattern and giving phase-shifting, liquid crystal (LC) grating and digital mirror devices (DMD) are available. The architecture and functionality of the two digital technologies, namely, LC grating and digital light processing (DLP) using DMD, were extensively reviewed [20]. They have demonstrated experimentally that LCD projection supersedes DLP projection technology in terms of accurately producing a sinusoidal fringe pattern; however, the image preprocessing of each of the tested projectors was assumed similar. Future work should consider the validity of this assumption. DLP projection sources surpassed LCD in terms of the geometric precision of LCD in regard to the “screen door effect: tiny discontinuities in the digitally projected intensity distribution.” In addition, they demonstrated that for dynamic multichannel phase measuring profilometers, LCD projections brings lower color crosstalk relative to DLP projection technology. They occluded that such implications should be considered when designing triangulation-based optical profilometry systems.
19.4.2.2 Digital Techniques in Pattern Projection
Up to now, many methods and applications for three-dimensional shape measurement have been proposed, and recently, the measurement accuracy is becoming higher and higher. And, in most of the cases, phase-shifting technique is applied to analyze the projected fringe pattern. To attain highly accurate result in such measurement systems, phase-shifting technique should be applied under the fundamental assumption that the projected pattern is sinusoidal, not binary, in intensity distribution. However, sinusoidal pattern is not always easy to make and sometimes, defocusing in projection is used to bring quasisinusoidal pattern. However, this defocusing technique is not sufficient for the precise and accurate result. And, even if the pattern is exactly sinusoidal, we have to move the pattern precisely for phase-shifting technique. Conventionally the projected pattern is shifted by mechanically moving some element such as a grating. Even if an electric actuator may be used for moving the grating on a mechanical stage, this way of movement is not satisfactory for practical inspection on shop-floor, because it has problems such as a long measurement time due to mechanical movement and errors caused by unstable repeatability in positioning. In addition, we have necessity that the grating period should be adjusted appropriately in accordance with the measurement range and/or inclination of the sample surface. To overcome these problems, availability of a stripe-type LC grating instead of a conventional grating ruled on a glass plate or optical interference fringe has been proposed [21,22].
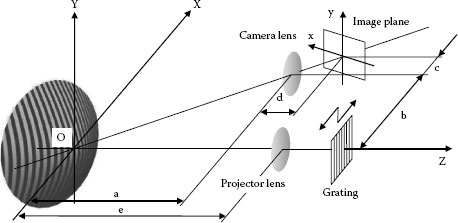
FIGURE 19.26 Principle of pattern projection method.
Figure 19.26 shows a profile measurement system using grating projection method based on phase-shifting technique. Here, the three-dimensional coordinate (X, Y, Z) of the point P on the sample is defined by the following equation using the period p of the original grating, phase ϕ(x, y) of the grating pattern on the image plane (x, y) of the CCD camera, the magnification m of the camera lens, and geometrical parameters shown in the figure:
where
Here, when the grating with the period of p is projected onto the object, the point T(X,Y,Z) on the surface of the object is captured at the point t(x,y) on the imaging plane. And the point T corresponds to the point C(w, 0, 0) on the X–Z plane.
The intensity distribution Ii (i = 1 ~ 4) of the projected pattern is given as follows:
where
I0 is an illuminated intensity
γ(x, y) is a contrast
ϕ (x, y) is the initial phase which expresses the profile
δi (i = 1–4) is given by shifting of 0, π/2, π, 3π/2, respectively
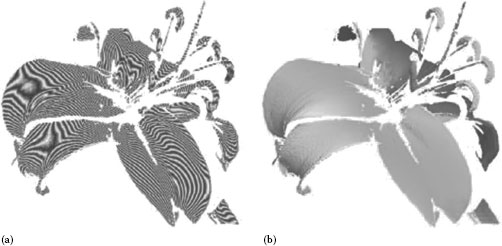
FIGURE 19.27 Example measurement of a lily; expression by (a) contours and (b) shading. (Courtesy of Dr. Masayuki Yamamoto.)
Here, “four-stepping phase-shifting algorithm” is adopted by which the phase ϕ(x, y) is determined as follows:
The phase distribution given by this equation is wrapped in a 2π area; hence, the final result should be produced after unwrapping procedure for smooth connection of phase.
The stripe-type LC grating is suited for applications such as phase-shifting technique, because the projected pattern can be electrically controlled without any mechanical movement of the optics. One example measured by a system using LC grating projection is shown in Figure 19.27.
Here, a newly structured LC grating is illustrated in Figure 19.28. This stripe-type LC grating of 40 mm × 60 mm in size with 960 stripes is developed for monochromatic use (without any colored filters). Owing to the stripe-type of periodical configuration, the intensity shows uniform distribution with smaller noise shown along the line. To realize high contrast of the LC grating, nematic (TN) type of liquid crystal is chosen. The characteristics of TN type are that they require low electric power, and smallness in size, and have a high dynamic range.
One application using this LC grating is shown in Figure 19.29 which indicates an optical configuration with dual-projection optics [23]. This system contains one CCD camera and two projection units with telecentric nondistortion lenses for simplification of calculation. This system was originally developed to explore applicative usage in semiconductor industry. Conventionally such problems were caused as occlusion and phase error due to halation from the surface. The first problems is inevitable as long as triangulation is adopted. The second one is caused mainly by unequal distribution of surface reflectivity of the BGA, CSP, solder bumps, etc. These problems can be solved by using dual-projection system. Two images from both directions are useful for redeeming mutual week points. One measurement result of a BGA is shown in Figure 19.30. Here the field of view is 14 mm × 14 mm and depth of field is approximately 1.0 mm. The three-dimensional expression of the BGA sample (a) and the cross section (b) are represented.
Experimental results verify this system is so flexible that it is appropriate for industrial applications.
19.4.2.3 Trends in Profilometry
In recent years, surface profile measurement has become more and more important in various industrial applications. Two-dimensional and three-dimensional optical profilometry has been successfully applied to various industrial fields such as shape measurement of a soft object including a human body as well as hard objects like a car body. For more prevalent use of commercial equipment, a few more tasks are proposed from the viewpoint of practical use. Let us introduce recent research works to cope with these requirements.
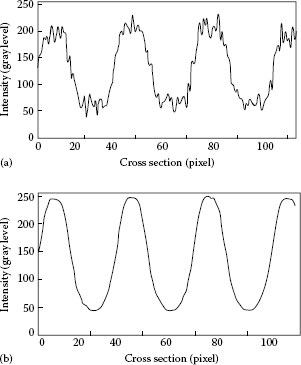
FIGURE 19.28 Grating using (a) matrix-type LC and (b) stripe-type LC.
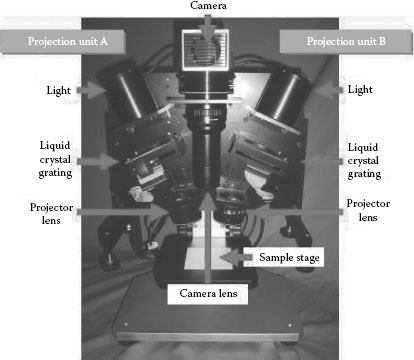
FIGURE 19.29 Dual-projection system with LC grating.
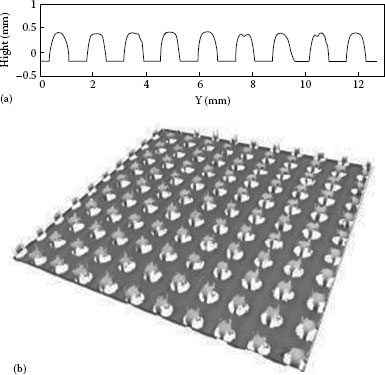
FIGURE 19.30 Measured result of BGA without occlusion. (a) Cross section of BGA and (b) reconstructed image of BGA without occlusion.
19.4.2.3.1 High-Speed Measurement
Nowadays high-speed measurement systems are too heavy in practical use of optical equipment for profilometry. The pattern projection method, one of the successful principles based on fringe analysis, has been widely applied to various academic and industrial fields. To expand this method to wider purposes such as quality check of manufactured components, three-dimensional sensing for robot vision, and dynamic analysis of a deforming object, high-speed measurement has to be attained immediately soon. There are two points to satisfy this request. First, data need to be acquired at one moment, and, second, the data have to be processed with high speed and accuracy to meet the purpose.
Phase-measuring systems have become increasingly popular in commercial equipment because of an accuracy superior to intensity-based measurement systems depending on optical sectioning or space coding technique. However, in fringe projection using phase-shifting technique, the resultant wrapped phase is modulo 2π. And this unwrapping problem has been a difficult and serious task for a long time. Traditional phase unwrapping algorithms involve the calculation of an arctangent function, which is a bottleneck in the case that real-time processing is required.
Coggrave and Huntley realized a high-speed profile measurement using a commercial projector and a pipeline image processor [24]. In the case of sinusoidal patterns projection using a commercial projector with DMD inside, the resulting fringe patterns are acquired by a CCD camera at a rate of 30 frames/s. The images are analyzed in real time using a pipeline image processor. The combination of four-step phase shifting and temporal phase unwrapping enables discontinuous objects to be profiled as easily as continuous ones. An optimized sequence of fringe pitches is used in which the spatial frequency is reduced exponentially from the maximum value. A total time of 0.87 s is required from the start of the measurement process to the final display of a surface profile consisting of 250,000 coordinates. An accuracy of 1 part in 2000 was achieved with a maximum fringe density of 16 fringes across the field of view. This pioneering research result verified possibility of real-time measurement for robotics and in-line measurement in manufacturing.
As another solution, one trial was proposed which also makes use of digital technique. In conventional grating projection based on analog technique, a pattern with sinusoidal intensity distribution was difficult, and moreover, rectangular pattern, triangle pattern, saw-teeth pattern, etc. were nearly impossible to produce. By taking advantage of a DMD projector, Huang, Zhang, and Chiang proposed a novel (or a little bit tricky) phase-shifting method, namely, the trapezoidal phase-shifting method, that used trapezoidal fringe patterns instead of the traditional sinusoidal ones [25]. By calculating an intensity ratio using a simple function, instead of phase using the arctangent function, they succeeded in increasing the calculation speed by at least 4.6 times with similar resolution, which made the real-time reconstruction of 3D shapes possible (even 40 frames/s at the resolution of 532 × 500 pixels). However, the use of trapezoidal fringe patterns led to some error due to image defocus (as is anticipated, sharp edges of trapezoidal patterns are easily blurred), even though the error is small, especially when compared to the traditional intensity ratio–based methods.
According to their paper [26], in the course of trying to deal with this error, they discovered that if they apply the algorithm developed for the trapezoidal method to sinusoidal patterns, considering the sinusoidal patterns as the defocused trapezoidal patterns, and then compensate for the small error due to defocus, they could preserve the calculation speed of the trapezoidal method while achieving the same accuracy of the traditional sinusoidal phase-shifting algorithm. This new three-step phase-shifting algorithm, which is much faster than the conventional three-step algorithm, can achieve the speedy processing by using a simple intensity ratio function to replace the arctangent function in the traditional algorithm. The phase error caused by this algorithm is compensated by using a lookup table. The experimental results showed that the new algorithm had the same accuracy, but was 3.4 times faster. By implementing this new algorithm in a high-resolution, real-time three-dimensional shape measurement system, a measurement speed of 40 frames/s at a resolution of 532 × 500 pixels has been achieved with an ordinary personal computer. In fact, this technique brought a surprising result, as shown in Figure 19.31, in real-time measurement.

FIGURE 19.31 Real-time measurement of human facial expression. The left figure is a real-time reconstruction of the right person’s face. (Courtesy of Prof. Song Zhang.)
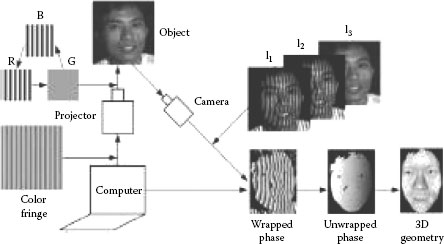
FIGURE 19.32 Schematic diagram for modified two-plus-one algorithm. (Courtesy of Prof. Song Zhang.)
One more result was presented by Zhang, who modified “two plus one phase-shifting algorithm” to alleviate the error due to motion [27]. The schematic diagram of this shape measurement system is shown in Figure 19.32. Their previous work encountered the problem of fast motion such as the facial geometric changes during speaking. In this trial, two fringe images with 90° of phase-shift and a third flat image (not the average of two fringe images with a phase shift of 180°, but a computer-generated uniform flat image) are collected. Their experimental result demonstrated that this system can satisfactorily measure the dynamic geometrical changes. The data acquisition speed attained up to 60 frames/s with an image resolution of 640 × 480 pixels per frame. This system is expected to be applied to online inspection in manufacturing, medical imaging, and computer graphics.
19.4.2.3.2 Reduction in Size and Weight
For the purpose of practical usage, a compact and light weight instrument is preferable. Occasionally, it is difficult to carry the measurement subjects into a measuring room, and moreover, on-line measurement (not off-line measurement) is always necessary in manufacturing process. Recently downsizing has been attainable owing to the rapid progress in device technology. In some cases, compact, portable, and light weight measurement systems are requested, even though the measurement accuracy is not so high. At the same time, high-speed image capturing is indispensable for easy use of such portable systems. Now a handy compact system like, say, a “3D camera” is also required for easy capturing of the objective shape from the fields like robot vision and security checking that do not need such high accuracy as tens of micrometers: One example is a commercial product in range finding (e.g., SwissRanger [28]) on the basis of the time-of-flight method. However, the resolution still remains at some tens of millimeters and beam scanning is required to cover the objective. And the low spatial resolution of 176 × 144 pixels is not available for 3D digitizing.
Hence, to meet the requirement described earlier, a trial that is now under development was reported [29,30]. In this case, the key point is the scanning mechanism. Various methods have been proposed and tried for optical sectioning, and, in most of the cases, devices such as a galvano-mirror, a rotating polygon mirror, or a prism were utilized. Moving elements such as a mirror or a prism may not have the following features: (1) small, compact in size and light in weight; (2) high-speed and stable scanning; and (3) wide scanning angle enough to cover the measuring area.
In considerations of these requirements, one comes to a conclusion that an MEMS scanning mirror is appropriate for the purpose. In fact, a range-finder type apparatus (based on time-of-flight principle) was already reported which made use of an MEMS (Micro-Electro-Mechanical Systems) scanner (manufactured by Nippon Signal Co.), and other prototype range finders (roughly 50 × 50 mm2 in size) have been announced to have appeared in the market.
In Figure 19.33, a beam from LD, when reflected by a single MEMS mirror, scans the sample objective to be measured. When the beam is scanned vertically or horizontally by the mirror, the beam makes a sheet of light. This sheet of light is projected onto the object and forms an optical cross section. In the figure, a cylindrical lens is used for making one sheet of light and the sheet is used for scanning. In this case, a MEMS mirror with a size of 4 mm × 3 mm (or 6 mm × 7 mm) is incorporated. Here a MEMS scanner “EcoScan” manufactured by Nippon Signal is used. In recent years, “linear scanning module” fabricated by Venture Forum Mie Ltd. has also been employed to illuminate the fringe pattern. These miniature mirrors are moved magnetoelectrically using resonance phenomenon in torsion bar structure which is effective for making a large scanning angle. Therefore, even small driving force is enough for attaining vibration with large amplitude angle. Details of this principle are described in the website of the manufacturer [31,32].
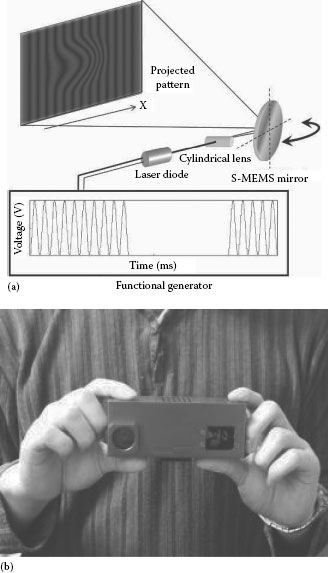
FIGURE 19.33 Optical layout for 3D measurement using one MEMS mirror. (a) Optical configuration of compact 3D camera and (b) prototype compact 3D camera. (From Wakayama, T. and Yoshizawa, T., Opt. Eng., 51, 013601–1, 2012.)
If two-dimensional scanning is applied by the MEMS (in truth, Lissajous figures are drawn in 2D scanning, not raster scanning), multiple sections are obtained. This means the various pattern projection methods are also applicable including FFT (Fast Fourier Transform) analysis and phase-shifting techniques.
The experimental results including a pattern formed on a plastic model in Figure 19.34a through d shows that a sharp pattern is possible and that the depth of the measurement field is large enough without blurring or distortion due to the lens. These figures show precisely shifted phases of fringe pattern at every 90°. Using phase-shifting algorithm, the 3D data are given in the same figure (Figure 19.34e). This technique has the potential not only to produce compact 3D cameras but also to realize high-speed 3D measurements.
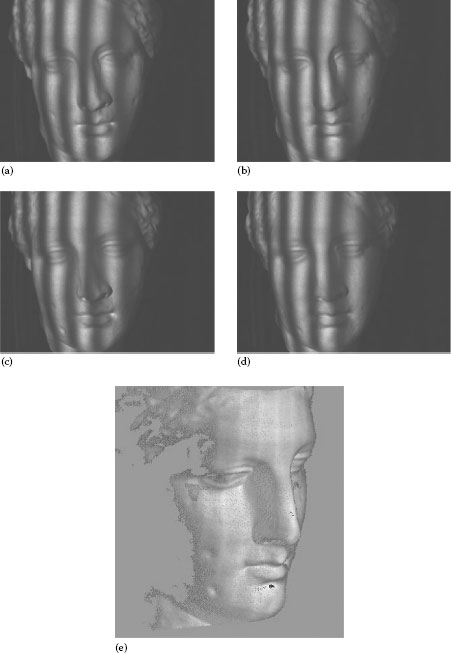
FIGURE 19.34 Measured example: (a) 0°, (b) 90°, (c) 180°, (d) 270°, and (e) 3D representation of a plaster figure. (Courtesy of Mr. Yoshihisa Kamakura.)
Conventional portable 3D cameras (P3D) are presently released from Nikon Corp., as shown in Figure 19.35a. The P3D can easily operate a built-in flat panel display to obtain the 3D data of samples. It captures the 3D shape in a short time with high accuracy. The details of the system is reported [33]. Figure 19.35b shows a result after connecting the 3D data captured from 11 different directions. This 3D camera can also be available in various industrial fields including medical applications [33].
A similar trial was represented in the paper “Cordless hand-held optical 3D sensor,” where reflection type with liquid crystal on silicon (LCOS) microprojection technology is incorporated in a digital projection unit together with an LED as the light source [34].
This sensor consists of this projection unit and two cameras in a stereo arrangement which is necessary to use the measurement principle “phasogrammetry.” In this technique, shown in Figure 19.36, two sequences of fringes rotated by 90°, generated by a digital projector, are projected onto an objects surface. The projected pattern is captured by two cameras at the same time to calculate subpixel accurate pixel corresponding to every pixel from this image sequence, using the principle of phase correlation [35].
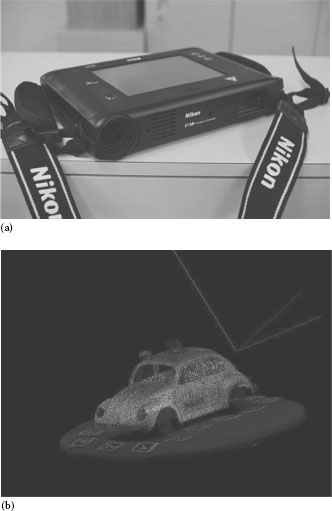
FIGURE 19.35 Portable compact camera system for practical use. (a) Portable 3D camera (P3D) and (b) a result of P3D. (Courtesy of Nikon Corp., Tokyo, Japan.)
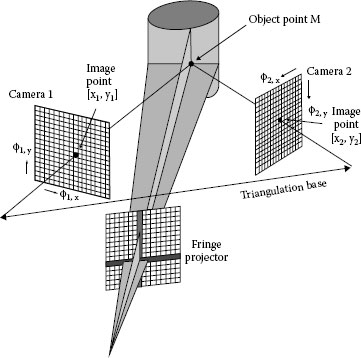
FIGURE 19.36 Fundamental principle of phasogrammetry. (Courtesy of Dr. Christoph Munkelt.)
The sensor head consisting of two cameras and a miniaturized projector weighs approximately 950 g and measures approximately 130 × 160 × 140 mm3 in volume. One result is shown in Figure 19.37 where a 30 × 25 mm2 patch of a thin paper was glued to demonstrate the sensing resolution in height.
Furthermore, the system can be utilized to acquire the all around shape of objects by using the phasogrammetric approach with virtual land marks. This allows for hassle-free and convenient walk-around scanning. Combined with the traditional advantages of “photogrammetry,” it enables high sensitive multiview 3D surface extraction, independent of the objects color, texture, and erosion. New application areas can be developed, where conventional 3D sensors did not offer the required flexibility, portability, speed, and resolution.
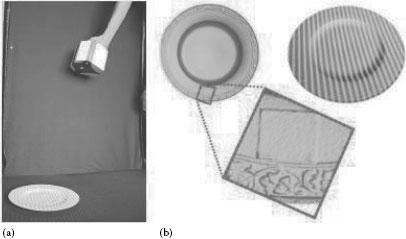
FIGURE 19.37 Hand-held sensor head using LCOSZ (a) and measurement result (b).
19.4.2.3.3 Hybrid Sensing in 3D Profilometry
As the commercial equipment based on optical profilometry becomes popular, strong requests for versatile systems that are applicable to any case are increasing. However, it is hard to meet the customer’s demands by using only one principle. Recently, demands from industry are accelerating diversification of methods for shape measurement. Hence, hybrid sensing or multisensor systems made up of one main principle and auxiliary methods have become widely used.
Here, one of such systems is introduced with focus on engine blocks measurement [36]. The main optical 3D sensor based on fringe projection method is able to digitize a 120 mm × 150 mm area of an engine block casting into up to one million points in just a few seconds. By mounting this optical 3D sensor onto a special horizontal arm CMM with three-translation and two-rotation axes along with a conventional touch probe working side by side, an engine block casting can be digitized into a huge point cloud data in about 40 min. The measured point cloud data can be compared with its CAD model to generate a color-coded deviation map in about 3 min.
As the heart of a high quality engine, engine blocks need efficient cooling and tight tolerances for crankshaft bearings, piston rings, and camshafts. Automakers have been casting engine blocks with iron for a century and have significantly refined their processes. However, as the heaviest individual component in a car, the engine block has been a major target for weight reduction. As one solution, automakers have been increasing their efforts in the past few years to replace traditional cast iron engine blocks by aluminum engine blocks in order to cut vehicle weight and improve fuel efficiency. As a result, the majority of current passenger cars from sedans to SUVs have aluminum engines.
High-pressure die-casting (HPDC) is the most commonly used process to produce aluminum engine blocks, in which molten aluminum is injected at high pressure into a metal mold by a hydraulically powered piston. HPDC machines conventionally include an aluminum injector assembly, a die assembly, a pressure accumulator assembly, a cast part take-out assembly, and a die spraying assembly.
The die assembly includes a fixed die and a movable die, which has a plurality of movable cores. The pressure accumulator supplies pressurized fluid for moving of the die between an open and closed position, and for clamping the dies in the closed position. After an engine block is formed and removed from the die assembly, it is needed to spray the dies to keep them clean. The die spraying process sometimes also includes application of a heated fluid to maintain portions of the dies at an appropriate elevated temperature to facilitate the flow and distribution of molten aluminum in the next casting operation.
Dimensional repeatability in engine block castings is one of the important quality issues, which every die-caster has to face on a daily basis. Metal shrinkage, casting machine conditions, die conditions, and consistency between different die sets can all contribute to dimensional repeatability in engine block castings. So far, conventional coordinate measurement machines (CMM) have been the standard tools to check the dimensional repeatability of castings. While a touch probe on a CMM measures one point at a time, it will take more than 30 min to check few hundred points on the casting. This has been the only tool so far to check the dimensional defects in the castings. However, a CMM does not automatically guarantee that a large number of bad castings will not happen. With a few hundred points on a casting measured, a CMM leaves a lot of surface areas on a casting unchecked assuming they are problem free. If defects hit on these usually-not-very-important and unchecked areas, it will usually cause a big problem and cost a lot of money. This is the current situation in die casting industry. That is why die-casters are always looking for a better way to improve their inspection abilities. The goal is to have an automatic machine to check all necessary areas on a casting by using the same amount of time as what a CMM does. An optical noncontact 3D measurement machine, which is based on structured lighting method, is selected to bring the casting inspection to the next level. A picture of this machine is shown in Figure 19.38.
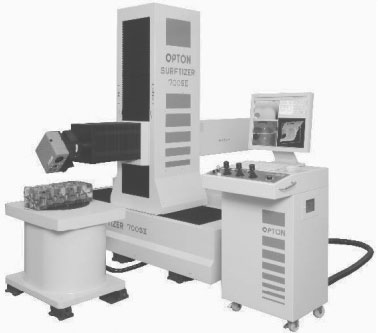
FIGURE 19.38 3D measuring machine with hybrid sensors. (Courtesy of Opton Corp., Aichi, Japan.)
This machine has basically an optical noncontact sensor (based on fringe projection method) head mounted on a special horizontal arm CMM with two additional rotary axes. Since this optical sensor head is heavier than a conventional touch probe, the structure of a conventional horizontal arm CMM cannot support such a heavy load. A special machine with much stronger arm has been used. Two additional rotary axes are used for rotating both the sensor head and the casting during the measurements to cover all the necessary casting surfaces. However, this machine is much more powerful than a conventional CMM due to the white light structured lighting sensor, which can digitize a 120 mm × 150 mm area into up to one million XYZ points in just few seconds. Therefore, it can measure one 120 mm × 150 mm patch at a time instead of one point at a time of a conventional CMM. Another important feature is that there is only one global coordinate system built in with the machine as default, which means there is no need to merge different views taken at different sensor head positions and orientations. The overall measurement accuracy of this machine is 0.05 mm, which is adequate for casting inspection. Figure 19.39 gives a close-up look at its sensor head. The white light sensor includes a grating projector and a digital camera. It can also have a conventional touch probe working side by side with the optical sensor. The touch probe equipped with this machine is mainly for setting up a user-defined coordinate system even before carrying out unattended measurement. The user-defined coordinate system is usually the CAD coordinate system. If the original point cloud data is already in the CAD coordinate system, there is no need to align them together when calculating the deviations between the point cloud and its CAD model.
As shown just below the touch probe, an optional laser sensor (ConoProbe sensor; single point measurement) is also included in this hybrid sensor head. This laser sensor is for the measurement of deep holes, which are not that easy to measure by using either the touch probe or the white light sensor. These holes are formed by pins in the die, which could be bent by molten aluminum. So this hybrid sensor head has three different sensors—the touch probe, the white light sensor, and the laser sensor (Figure 19.39 and Table 19.7).
An L4 engine block as shown in Figure 19.40 (left) has been measured. After the engine block is loaded onto the turntable, an operator selects a preset inspection routine to run, which typically includes the touch probe portion and the white light sensor portion. The touch probe is first used to measure several features on the engine block, such as pads (with a flat surface) and holes to set up a coordinate system to use. After that the white light sensor will be used to measure all the patches defined in the inspection routine. In Figure 19.40, each white dot means one measured XYZ points. After a casting has been measured into a huge set of point cloud, the next step is to compare the measured point cloud data on the casting with its CAD model. Since the measured point cloud data has already been in CAD model’s coordinate system due to the use of the touch probe, there is no need to align two datasets together. This simplifies the data processing a lot. As shown in Figure 19.41, all the points inside the tolerance (±0.2 mm in this case) will be shown in colors. Points that are on the positive side of its CAD surface (this means there are extra material) are shown in the red color. On the other hand, the blue color is assigned to those points that are inside its CAD surface (this means there are less material). The operator only needs to focus on these colors when reviewing all surfaces on the casting. If necessary, annotations can be created to see how serious the problem is and appropriate measures can be taken to address the problems found. In most cases, more likely the die service department will be informed to make necessary corrections on the die surfaces.
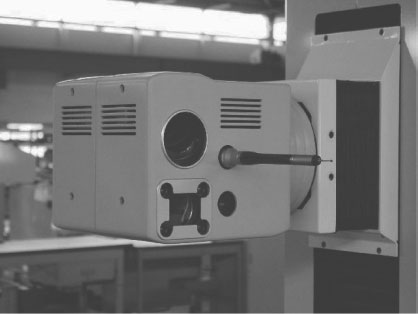
FIGURE 19.39 Auxiliary sensors attached to machine. (Courtesy of Opton Corp., Aichi, Japan.)
TABLE 19.7
Specifications of This Machine in Figure 19.38
Overall accuracy (mm) |
0.05 |
Measurable depth (mm) |
±50 |
Overall repeatability (mm) |
0.025 |
Max. measurable angle (°) |
±60 |
Sensor field of view (mm) |
120 × 150 |
Coordinate calc. time |
Up to 5 s/patch |
Stand-off distance (mm) |
300 |
Max. number of points/patch |
One million |
As shown in Figure 19.41, there are extra material (thickness from 0.885 to 1.674 mm) in area A and E showing in the figure. This is likely caused by die wearing at these edges. To correct them, some die material is needed to weld on and hand grinded back to proper radius. There are approximately 0.6 mm thick material missing in area C and D. Extra materials on the die surface at these locations may cause this. The problem at area C needs special attention, since the top surface of this casting will be machined into a flat surface. It is essential to make sure there is still enough material left in area C for the machining. Area D is on nonmachining surface. In case it does not need any immediate action, however, it may need to be watched continuously to make sure it never gets worse. Actually die repairing or reconditioning is a constant effort in die-casting and die conditions play a key role in the quality of final castings. Same casting usually has more than one set of dies (usually three sets). At the beginning all different sets of dies are identical. After dies are in service and go through several repairing, they will be different from each other. Maintaining dimensional consistency of a casting among different die sets is another reason for more thorough measurement on castings. We can see this color-code deviation map is very useful for monitoring the status of a casting process to assure dimensional repeatability of castings. It is even more important to have such a deviation map quickly after casting. This inspection process has provided die-casters a new powerful tool to monitor dimensional repeatability of castings.
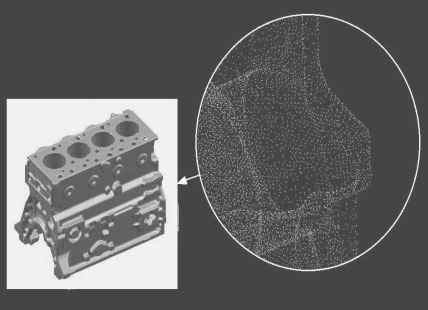
FIGURE 19.40 Measured engine and partial result showing points of cloud. (Courtesy of Opton Corp., Aichi, Japan.)
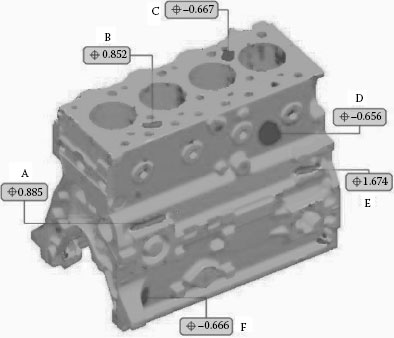
FIGURE 19.41 Measured result in comparison with CAD data. (Courtesy of Opton Corp., Aichi, Japan.)
19.4.2.3.4 Reconstruction of Shape
In addition to combination with CAD mentioned earlier, data acquired by 3D profiling technique are utilized in a lot of applications including clothes production in apparel industry based on human body measurement and preproduction samples for industrial designing for various merchandise using rapid prototyping. One sample is shown in Figure 19.42 (top) where a head (approximately 180 mm × 350 mm in size) of Bodhisattva (Buddhist saint) is measured by fringe projection method. This result is first used to fabricate a miniaturized sample model (with 40 mm in diameter) by milling operation. Ultimately, based on the same 3D data of the head part, this system (five-axis control micromilling system using a diamond pseudo-ball [0.03 mm in radius]) end mill succeeded in creating a 1 mm microreplica in height (right), taking account of collision between the tool and the workpiece [37]. Although this image is captured by SEM, it is verified that the system has possibility of producing three-dimensionally complicated shapes, which are required to make micromachines and microrobots in the future.
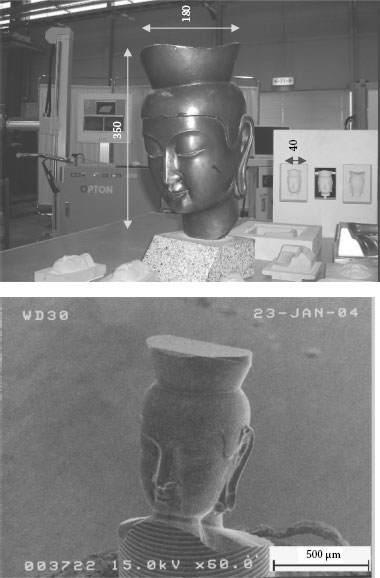
FIGURE 19.42 Measurement sample (Bodhisattva) and reproduced sample in reduced size by micromachining. (Courtesy of Prof. Yoshimi Takeuchi.)
19.4.2.3.5 Inner Profile Measurement
There are various requirements for measuring the inner diameter and/or inner profile of cylindrical objects like a pipe. Especially in mechanical engineering field, serious problems come from automobile industry, because the inner surface of engine blocks or other cylindrical parts are strongly requested to be inspected and measured by optical methods (not by the naked eyes using a bore-scope). Another necessity is known that the rehabilitation and maintenance of sewers is of importance to water and waste utility in urban life [38]. For these problems, hitherto, optical inspection using borescopes has been performed. However, observation and inspection and manual annotation of defects are not sufficient, because the method suffers from a lack of quantitative information and is not appropriate for computer analysis of the recorded data. In addition to the applications in mechanical industry, the medical and dental fields request methods for measuring the inner profile of the stomach, trachea, and oral cavity. If the inner diameter is large enough like water pipes or drain pipes, a complicated and large equipment may be applicable. However, small pipes with a diameter ranging from 10 to 200 mm are difficult to be inspected by such a large instrument as is used for sewers inspection.
The first revision is focused on forming a ring beam without such a mechanically moving device as a rotary mirror and on realizing simple and stable “optical sectioning.” In Figure 19.43, which shows the basic arrangement for the above-mentioned purpose, a miniature CCD camera checks inner defects like cracks at the same time with the profile of the inner wall [39]. In this figure, when the pencil beam from an LD is reflected at the sharp top of the conical mirror, the beam expands in a circular direction. This circular beam makes the inner profile by optical section. Figure 19.44 shows a result on a pipe used for mixing of two fluids. This part is produced by hydroforming process, the inner profile of which has to be checked to know if it is formed as designed. A measured result is shown in Figure 19.44 where some of optical sections measured by every 5 mm are arranged. On the basis of optically captured sections, inner profiles of the object are analyzed as shown in the figure. Figure 19.44g and h shows 3D inner shapes of the pipe at different view angles. The inner profile measurements are thus available to many practical applications in the fields of industry such as automobiles, aeroplanes, energy plants, and so on. Some other applications for fuel assembly of nuclear reactor can be found in Refs. [40,41].
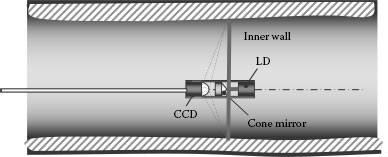
FIGURE 19.43 Miniaturized sensor for inner diameter and/or profile measurement.
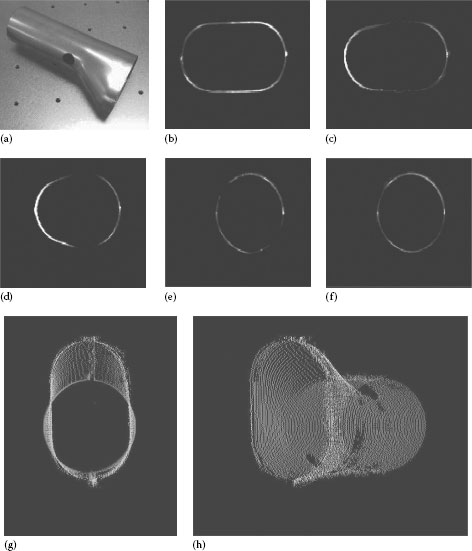
FIGURE 19.44 Measured result of inner profile: (a) Appearance of an irregularly shaped pipe and (b–d) profiles by every 5 mm distance from the end (b, 5 mm; c, 35 mm; d, 65 mm), (e) 95 mm, (f) 125 mm, (g) view angle 0°, and (h) view angle 45°.
In recent years, the inner profile measurement has been tried to such small pipes with the inner diameter smaller than 10 mm. To attain these trials, the ring beam device and a rigid scope camera are combined as shown in Ref. [42]. As a result, in addition to measurement of 3D inner profile, inspection of scratches and flaws on the inner wall of the small holes is successful. The future prospect for the inner profile measurement is becoming increasingly possible in various fields.
Principles for two- and three-dimensional profilometry are described here including a few applications for industrial usage. We are apt to emphasize the accuracy in metrological research works, but reduction of dimensional size and weight of the systems should also be considered for practical use.
The material in this chapter is based on papers and reports such as are impressive from my personal preferences. Naturally many other interesting principles and results have been reported up to this time, but some of the principles and even the commercialized products have disappeared due to severe filtering of availability and convenience in practical usage. While looking back at a lot of research papers, new ideas and rediscoveries were found. Further progress in profilometry is expected to push “3D metrology” to “3D engineering” that will cover industrial measurements, inspection, and manufacturing.
1. Yoshizawa, T. (Ed.), Optical Three-Dimensional Metrology (in Japanese), Asakura Publishing Co., Tokyo, Japan, 2006.
2. Whittle, M.W., The use of biostereoscopic methods to study astronaut body composition, Proceedings of SPIE, Vol. 166, Coblentz, A.M. and Herron R.E. (Eds.), Society of Photo-Optical Instrumentation Engineering, Bellingham, WA, 1978, p. 286.
3. Takasaki, H., Moire topography, Applied Optics, 9, 1970, 1467.
4. Merklinger, H.M., Principles of view camera focus. http://www.trenholm.org/hmmerk/HMbook18.html.
5. Sawatari, T. and Zipin, R.B., Optical profile transducer, Optical Engineering, 18, 1979, 222.
6. Mitsui, K., In-process sensors for surface roughness and their applications, Precision Engineering, 8, 1986, 212.
7. Brodmann, R. and Smiga, W., In-process optical metrology for precision machining, Proceedings of SPIE, 802, 1987, 165.
8. Kohno, T. et al., High precision optical surface sensor, Applied Optics, 27, 1988, 103.
9. Ohta, S., Surface measurement by non-contact displacement sensor based on focus detection (in Japanese), Optical Engineering Contact, 26, 1988, 773.
10. Rodenstock GmbH, http://www.html.ornl.gov/mituc/rodenstk.htm.
11. Fukatsu, H., Yanagi, K., and Shimamoto, A., Development of a novel optical stylus sensor for surface profiling instrument, Proceedings of IIP/ISPS Joint MIPE’03, 2003, p. 337, held in Yokohama, Japan, 2003.
12. Bartoli, A., Optical profilometer with a standalone scanning sensor head, Optical Engineering, 40, 2001, 2852.
13. Figures 19.13 and 19.14 were reconstructed on basis of the Japan Patent No. 3809803 with permission of the holder.
14. Yoshizawa, T. and Tochigi, A., Displacement measurement utilizing contrast variation of a projected pattern, Optical Engineering, 31, 1992, 1726.
15. Sirat, G. and Psaltis, D., Conoscopic holography, Optics Letters, 10, 1985, 4.
16. Malet, Y. and Sirat, G., Conoscopic holography application: Multipurpose rangefinders, Journal of Optics, 29, 1998, 183.
17. STIL SA Chromatic confocal imaging. http://www.stilsa.com/EN/prin.htm.
18. Ishihara, M. and Sasaki, H., High-speed surface measurement using a nonscanning multi-beam confocal microscope, Optical Engineering, 38, 1999, 1035.
19. Mermelstein, M.S., Feldkhun, D.L., and Shirley, L.G., Video-rate surface profiling with acousto-optic accordion fringe interferometry, Optical Engineering, 39, 2000, 106.
20. Baker, M., Xi, J., Chicharo, J., and Li, E., A contrast between DLP and LCD digital projection technology for triangulation based phase measuring optical profilometers, Proceedings of SPIE, 6000, 2005, 60000G-1.
21. Fujita, H., Suguro, A., and Yoshizawa, T., Three-dimensional surface profile measurement by using liquid crystal grating with triangular intensity distribution patterns, Proceedings of SPIE, 4902, 2002, 22.
22. Yoshizawa, T., Fujita, H., Otani, Y., and Yamamoto, M., Three-dimensional imaging using liquid crystal grating projection, Proceedings of SPIE, 5202, 2003, 30.
23. Yamamoto, M. and Yoshizawa, T., Surface profile measurement by grating projection method with dualprojection optics, Proceedings of SPIE, 6000, 2005, 60000I-1.
24. Coggrave, C.R. and Huntley, J.M., High-speed surface profilometer based on a spatial light modulator and pipeline image processor, Optical Engineering, 38, 1999, 1573.
25. Huang, P.S., Zhang, S., and Chiang, F.P., Trapezoidal phase-shifting method for 3D shape measurement, Proceedings of SPIE, 5606, 2004, 142.
26. Huang, P.S. and Zhang, S., Fast three-step phase-shifting algorithm, Optical Engineering, 45, 2006, 5086.
27. Zhang, S. and Yau, S.Z., High-speed three-dimensional shape measurement system using a modified two-plus-one phase-shifting algorithm, Optical Engineering, 46, 2007, 113603–1.
28. MESA Imaging AG. http://www.mesa-imaging.ch/index.php.
29. Yoshizawa, T., Wakayama, T., and Takano, H., Applications of a MEMS scanner to profile measurement, Proceedings of SPIE, 6762, 2007, 67620B.
30. Wakayama, T. and Yoshizawa, T., Compact camera for three-dimensional profilometry incorporating a single MEMS mirror, Optical Engineering, 51, 2012, 013601–1–013601–7.
31. Aoki, H., Development of portable 3D optical measuring system using structured light projection method, Proc. SPIE 9110, 91100Q (2014).
32. Nippon Signal Co. Ltd. http://www.signal.co.jp/vbc/mems/index_e.html.
33. Venture Forum Mie Ltd. http://www.vfm.co.jp/.
34. Munkelt, C., Bräuer-Burchardt, C., Kühmstedt, P., Schmidt, I., and Notni, G., Cordless hand-held optical 3D sensor, Optics for Arts, Architecture, and Archaeology, Proceedings of SPIE, 6618, 2007, 66180D.
35. Kühmstedt, P., Munkelt, C., Heinze, M., Himmelreich, M., Bräuer-Burchardt, C., Notni, G., 3D shape measurement with phase correlation based on fringe projection, Proceedings of SPIE, 6616, 2007, 66160B.
36. Li, Y., Tanaka, H., and Yogo, T., Structured lighting non-contact 3D measurement machines and applications in casting parts inspection, in Optical Three-Dimensional Metrology (in Japanese), Yoshizawa, T. (Ed.), Asakura Publishing Co., Tokyo, Japan, 2006. (This content was presented at SPIE Optics East Conferences in 2005, Boston, MA.)
37. Sasaki, T., Sono, M., Ishida, T., Kawai, T., and Takeuchi, Y., Creation of 3-dimensional complicated tiny statue by means of 5-axis control ultraprecision milling, Journal of the Japan Society for Precision Engineering, 73, 2007, 1256.
38. Clarke, T.A., The development of an optical triangulation pipe profiling instrument. http://www.optical-metrology-centre.com/Downloads/Papers/Optical%203-D%20Measurement%20Techniques%201995%20Profiler.pdf.
39. Yoshizawa, T., Yamamoto, M., and Wakayama, T., Inner profile measurement of pipes and holes using a ring beam device, Proceedings of SPIE, 6382, 2006, 63820D.
40. Inari, T., Takashima, K., Watanabe, M., and Fujimoto, J., Optical inspection system for the inner surface of a pipe using detection of circular images projected by a laser source, Measurement, 13 1994, 99.
41. Chugui, Y.V., Optical measurement systems and technologies for scientific and industrial applications, Pattern Recognition and Image Analysis, 22, 2012, 10.
42. Wakayama, T. and Yoshizawa, T., Small size probe for inner profile measurement of pipes using optical fiber ring beam device, Proceedings of SPIE, 8563, 2012, 85630L.