
Chapter 24. 802.11 Network Analysis
There is no coming to consciousness without pain.
— Attributed to C.G. Jung
In the 1990s, computer professionals joined doctors as People With Answers. Just as doctors are asked medical questions by complete strangers, computer professionals are asked a bewildering variety of technical questions by complete strangers. When these strangers learn that I work with networks, I am often asked, “Why does the Internet break so often?” The more I contemplate the question, the more I believe that the question should be, “Why doesn’t the Internet break more often?”
While I could never hope to answer either question in a single chapter of a book, it is obvious that network problems are a fact of life. Networks break, and wireless networks are no exception. Wireless LANs can improve productivity, but they also carry a larger risk of complete outage, and the limited bandwidth is almost sure to be overloaded. After building a wireless LAN, network engineers must be ready to investigate any problems that may arise.
As in many other network types, the trusty network analyzer is a key component in the engineer’s toolbox. Network analyzers already exist for the wired backbone side of the wireless network and can be used productively in many troubleshooting scenarios. Wireless network troubleshooting depends on having a network analyzer for exactly the same reason. Sometimes, you just need to have a way of seeing what is on the airwaves. This chapter is devoted to tools that allow network engineers to do just that. Several commercial analyzers are available, and there are free tools that run on Linux. Before diving into the tools, though, it may help to consider why wireless network analyzers are a practical requirement for the network administrator.
Network Analyzers
In spite of the shared heritage, 802.11 is not Ethernet. It has a number of additional protocol features, each of which can cause problems. Fixing problems on 802.11 networks sometimes requires that a network administrator get down to the low-level protocol details and see what is happening over the airwaves. Network analyzers have long been viewed as a useful component of the network administrator’s toolkit on wired networks for their ability to report on the low-level details. Analyzers on wireless networks will be just as useful, and possibly even more important. More things can go wrong on an 802.11 network, so a good analyzer is a vital tool for quickly focusing troubleshooting on the likely culprit.
Avoiding problems begins at the planning stages. Some analyzers can report detailed statistics on RF signal strength, which can help place access points. Analyzers can help network administrators avoid creating dead zones by ensuring that there is enough overlap at the edges of BSSs to allow for timely transitions. As wireless networks grow in popularity, they may need to support more users. To avoid performance problems, administrators may consider shrinking the size of access point coverage areas to get more aggregate throughput in a given area. In the process of shrinking the coverage areas, network administrators may go through large parts of the deployment plan all over again and depend once again on their analyzer.
With the limited bit rates of wireless networks, performance is likely to be a problem sooner or later. Performance problems can be caused by cramming too many users into too few access points, or they can be related to problems happening at the radio layer. The designers of 802.11 were aware of the problems that could be caused by the radio transmission medium. Frame transmissions succeed reliably. Most implementations will also retransmit frames with simpler (and slower) encoding methods and fragment frames in the presence of persistent interference.
Interference can be a problem for 802.11 network performance. In addition to the direct effect of trashing transmitted frames that then require retransmission, interference has two indirect effects. Poor transmission quality may cause a station to step down to a lower bit rate in search of more reliable radio link quality. Even if slower transmissions usually succeed, some measure of throughput is lost at the lower bit rates. 802.11 stations may also attempt to fragment pending frames to work around interference, which reduces the percentage of transmissions that carry end-user data. 802.11 headers are quite large compared to other LAN protocols, and fragmentation increases the amount of header information transmitted for a fixed amount of data.
On many networks, however, only a few applications are used. Do performance complaints indicate a general network problem, or a problem with a specific application? Network analyzers can help you find the cause of the problem by examining the distribution of packet sizes. More small packets may indicate excessive use of fragmentation in the face of interference. Some analyzers can also report on the distribution of frames’ transmission rates on a wireless network. 802.11b networks are capable of transmitting at 11 Mbps, but frames may be transmitted at slower rates (5. 5 Mbps, 2 Mbps, or even 1 Mbps) if interference is a problem. Stations capable of high-rate operation but nonetheless transmitting at lower rates may be subject to a large amount of interference. Performance depends on radio capacity. Stations that have stepped down to lower rates may not require a great deal of throughput for data service, but the slower rates require a great deal of time on the radio medium. Some analyzers can report the radio utilization as distinct from throughput, which is valuable in tracking down certain types of performance problems.
To solve interference problems, you can attempt to reorient the access point or its antenna, or place a new access point in a zone with poor coverage. Rather than waiting for users to report on their experience with the changes in place, you can use an analyzer to get a quick idea of whether the changes will help alleviate the problem. Some analyzers can provide extensive reports on the RF signal quality of received frames, which can help you place hardware better the first time around. Avoiding repeated experimentation directly with end users makes you look better and makes users happier. Shortening troubleshooting cycles has always been a strength of network analyzers.
Analyzers also help network administrators check on the operation of unique features of the 802.11 MAC. While it is possible to capture traffic once it has been bridged on to a wireless backbone network and analyze it there, the problem could always be on the wireless link. Are frames being acknowledged? If they are not, there will be retransmissions. Are the distribution system bits set correctly? If they are not, then address fields will be misinterpreted. If a malformed packet is seen on the wired side of an access point, it could be mangled at several points. A wireless analyzer can look at frames as they travel through the air to help you pin down the source of the mangled packet. Malformed frames may be transmitted by the client or mangled by the access point, and it is helpful to pin down the problem before requesting assistance from the vendor.
802.11 Network Analyzers
802.11 network analyzers are now quite common and should be a part of any wireless LAN administrator’s toolbox. Most 802.11 network analyzers are software packages that use an 802.11 network card. No special hardware is required because 802.11 network cards supply all the RF hardware needed to grab packets.
A network analyzer should be part of the deployment budget for any wireless network. The choice to buy or build is up to you, although I anticipate that most institutions will rely primarily on commercial products and leave development and bug fixes to the network analyzer vendors, especially because commercial analyzers can be purchased, installed, and made useful much more quickly.
AirMagnet (http://www.airmagnet.com) and AiroPeek from WildPackets (http://www.wildpackets.com) are the two best-known commercial wireless analyzers. I have used both extensively in the Interop Labs when troubleshooting various wireless problems.
Ethereal
Ethereal is the standard open source network analyzer. Like the commercial analyzers, it supports a long list of protocols and can capture live data from a variety of network interfaces. Unlike the proprietary analyzers, Ethereal comes complete with a slogan (“Sniffing the glue that holds the Internet together”).
Ethereal runs on most Unix platforms as well as Windows. Source code is freely available for both, but modifications are easier to make on Unix because of the availability of compilers in the Unix programming environment. Like many open source projects, Ethereal is distributed under the terms of the GNU Public License. Protocol decodes are included for many common networking protocols. For the purpose of this section, the important protocols are IEEE 802.11 and LLC, both of which are used on every 802.11 frame. Of course, the TCP/IP suite is included as well.
As 802.11 has become more popular and better supported on Linux, the choice of analysis hardware has opened up. Initially, only Prism-based cards were supported. However, most common interface cards are now supported out of the box. This section was written about Ethereal version 0.10.9, which was released in late January 2005.
Compilation and Installation
Building Ethereal for wireless network analysis is much easier than it used to be. Many of the patches formerly required for wireless analysis have been integrated into the main source tree, so wireless analysis works “out of the box.”
Ethereal depends on both libpcap, the packet capture library, and the GTK+ display library. Packet capture also requires kernel support to grab packets, in the form of Packet Socket (CONFIG_PACKET) support.
Ethereal itself is compiled using the standard open-source routine of downloading the source code from http://www.ethereal.com, running ./configure, make, and make install.
Setting the Wireless Interface for Monitor Mode
To capture packets, the wireless interface must be put into monitoring mode, which is the equivalent of running an Ethernet interface in promiscuous mode. Each wireless driver has its own method of activating monitor mode.
Cisco Aironet cards
Cisco Aironet cards have two flavors of monitoring mode. In the first mode, called rfmon, the driver will pass up any frames in the station’s current network. In the second mode, denoted with a simple y, the driver will capture any frames on the current channel. Both modes are selected by modifying the driver’s running configuration through the proc file system:
bloodhound:~# echo "Mode: rfmon" >/proc/driver/aironet/ethX/Config
bloodhound:~# echo "Mode: y" >/proc/driver/aironet/ethX/Config
To return to a normal station setting, change the mode back to ess:
bloodhound:~# echo "Mode: ess" >/proc/driver/aironet/ethX/ConfigEthereal requires a network interface name to capture packets. In kernel versions up to 2.4.19, use the Ethernet name of the interface (ethX). In 2.4.20 and later, use wifiX.
Prism cards
Prism-based cards can use one of two drivers: the linux-wlan-ng from Absolute Value Systems (http://www.linux-wlan.org), and the HostAP driver (http://hostap.epitest.fi). Monitoring has been a driver feature of the linux-wlan-ng driver since version 0.1.15. It is activated by using the wlanctl-ng command, rather than a wireless extensions command:
bloodhound:~# wlanctl-ng wlan0 lnxreq_wlansniffer enable=true channel=6To turn off monitor mode, send a request to disable it:
bloodhound:~# wlanctl-ng wlan0 enable=falseMonitoring with Prism-based cards can also be done with the HostAP driver. It uses a private system call for monitoring mode, similar to wireless extensions. Monitoring is activated by sending a monitor mode command to the card of either 2 or 3, depending on whether you want full monitoring headers (2) or just 802.11 headers (3). Monitoring is deactivated by sending a mode of zero:
bloodhound:~# iwpriv eth1 monitor
              mode
bloodhound:~# iwpriv eth1 monitor 0
Orinoco cards
Version 0.15 and later of the orinoco_cs driver supports monitoring mode without requiring patches. Patches against earlier versions may be found at http://airsnort.shmoo.com/orinocoinfo.html. To check that a driver has been patched, run iwpriv to look for the monitor control call:
bloodhound:~# iwpriv eth1If the driver supports monitoring, it can be activated with iwpriv as well. The monitoring driver has two modes. Mode 1 prepends Prism-style monitoring headers that report signal strength and other physical parameters, while Mode 2 has only the 802.11 header. Select one of the two modes, and a channel to monitor. To monitor channel 6 with full Prism-header monitoring information, run this command:
bloodhound:~# iwpriv eth1 monitor 1 6To stop monitoring, use a mode of zero:
bloodhound:~# iwpriv eth1 monitor 0Atheros-based cards
Atheros-based cards use the MADwifi driver discussed in Chapter 19. With current versions of MADwifi, the card can be placed into monitoring mode with iwconfig. If necessary, a channel can also be selected with iwconfig, as in the following examples for interface ath0:
bloodhound:~# iwconfig ath0 mode monitor
bloodhound:~# iwconfig ath0 channel 6
With some driver versions, I have found it necessary to assign an IP address to the interface before the interface appears in the capture list. The IP address does not need to be used on the network.
bloodhound:~# ifconfig ath0 1.2.3.4
bloodhound:~# ifconfig ath0 up
Running Ethereal
Starting Ethereal pops up the main window, which is shown in Figure 24-1. Any user may start Ethereal, but administrator privileges are required to capture packets. (Any user may load files for analysis, however.) The main window has three panes. The top pane, called the packet list pane, gives a high-level view of each packet. It displays each packet’s capture time, source and destination address, the protocol, and a basic decode of the packet. The Protocol field is filled in with the final decode, or dissector, used to analyze the frame. On 802.11 networks, the final decode may be IEEE 802.11 for management frames, or it may go all the way to the final TCP protocol for analysis, as in the case of an 802.11 frame holding an LLC-encapsulated IP packet with a TCP segment carrying HTTP. With the increasing use of link-layer encryption, the end decode is often 802.11 because Ethereal’s raw capture cannot decrypt frames and “see” the protected higher-layer protocols.

The middle pane, called the tree view pane, is a detailed view of the packet selected in the packet list. All the major headers in a packet are shown and can be expanded for more detail. All packets have the basic “Frame” tree, which contains details on arrival time and capture length. 802.11 networks may add the Prism Monitoring header, which contains radio-link data. The Prism header was originally developed for use with Prism devices, but has been adopted by most drivers. The capture in Figure 24-1 was taken with an Atheros card, but the MADwifi driver appends the Prism monitoring header. Some drivers have the option of enabling or disabling the Prism header.
The bottom pane is called the data view pane. It shows the raw binary data in the selected packet. It also highlights the field selected in the tree view pane. If further dissectors can be called to decode the frame, they will be. For unencrypted traffic, Ethereal can see the Logical Link Control (LLC) header. From there, the LLC may contain ARP packets, IP packets, TCP segments, and so on. Ethereal includes dissectors for all the commonly used protocols, so 802.11 frames are fully decoded when available. However, encrypted frames, such as the one in the figure, are presented as opaque data.
By selecting a field in the tree view pane, the corresponding bits are highlighted in the data view pane. In Figure 24-1, the Data field of the frame is selected, and highlighted at the bottom. I prefer to use a monospace font so that the data view pane at the bottom is presented in columns.
At the top of the Ethereal window is a bar with four important elements. The leftmost button, “Filter:”, is used to create filters that reduce the captured packet list to the packets of interest. The text box just to the right allows you to enter filters without going through the construction process. Ethereal maintains a filter history list that enables easy switching between filters. At the right is a text field that displays several kinds of information, depending on what Ethereal is doing. It may indicate that Ethereal is currently capturing data, display the name of the capture file loaded, or display the field name currently highlighted in the tree view.
Capturing data
Capturing data is straightforward. Go to the “Capture” menu and choose “Start”. The Capture Preferences window opens. Ethereal can use any detected interface, even wireless LAN interfaces.
The first thing to do is select the interface you want to monitor. For wireless interfaces, the name may begin with eth, ath, or even wlan. Before starting the capture, however, you must place the interface into monitor mode. Ethereal accepts the -i command-line option to specify an interface. If you plan to do all of your analysis on one interface, you can define a shell mapping of ethereal to ethereal -i ath0.
I typically turn on “Update list of packets in real time” and “Automatic scrolling in live capture”. If the former is left unselected, the trace appears only when the capture stops. If the latter is left unselected, the trace does not scroll to the bottom. Speed is important to real-time analysis. Disabling name resolution eliminates overhead for every packet captured and may allow a station to avoid missing frames in the air.
Data Reduction
Raw captures can be quite large, and extraneous packets can make finding wheat among the chaff a challenge. One of the keys to successful use of a network analyzer is to winnow the torrent of packets down to the few packets at the heart of the matter. Ethereal provides three ways to reduce the amount of data captured to a manageable amount: capture filters, display filters, and marking packets.
Capture filters
Capture filters are the most efficient way to cut down on the amount of data processed by Ethereal because they are pushed down into the packet sniffing interface. If the packet capture interface discards the packet, that packet does not make it to Ethereal for further processing. Unfortunately, capture filters are not tremendously useful with 802.11. If the Prism monitoring header is appended, capture filters cannot be applied.
Ethereal uses libpcap, so the capture filter language is exactly the same as the language used by tcpdump. A number of primitives are available, which can be grouped into arbitrarily long expressions. These primitives allow filtering on Ethernet and IP addresses, TCP and UDP ports, and IP or Ethernet protocol numbers. Many can be applied to source or destination numbers. Unfortunately, most of the protocol numbers they apply to are encrypted on many 802.11 networks, and are therefore not useful.
Display filters
Display filters can be used on any field that Ethereal identifies, which makes them far more powerful than capture filters. Display filters inherit the knowledge of all the dissectors compiled into Ethereal, so it is possible to filter on any of the fields in any of the protocols that Ethereal is programmed to recognize. Wireless LAN administrators can filter frames based on anything in the 802.11 or LLC headers. Examples specific to 802.11 are presented later in this chapter.
Using Ethereal for 802.11 Analysis
Several Ethereal features are handy when applied to 802.11 networks. This section lists several tips and tricks for using Ethereal on wireless networks, in no particular order.
Display filters
Ethereal allows filtering on all fields in the 802.11 header. Frame fields are structured hierarchically. All 802.11 fields begin with wlan. Two subcategories hold information on the Frame Control field (wlan.fc) and the WEP Information (wlan.wep) field. Figure 24-2 shows the variable names for 802.11 header components; in the figure, each field is labeled with a data type. Boolean fields are labeled with a B, MAC addresses with MA, and unsigned integers with U plus the number of bits. Table 24-1 shows the same information, omitting the Ethereal display fields that are unlikely to be useful for filtering.

802.11 header field | Ethereal field |
Header fields |
|
Either source or destination address | wlan.addr |
Transmitter address | wlan.ta |
Source address | wlan.sa |
Receiver address | wlan.ra |
Destination address | wlan.da |
BSSID | wlan.bssid |
Frame control subfields |
|
Frame type | wlan.fc.type |
Frame subtype | wlan.fc.subtype |
ToDS flag | wlan.fc.tods |
FromDS flag | wlan.fc.fromds |
Retry flag | wlan.fc.retry |
Protected frame (WEP) flag | wlan.fc.wep |
Protection fields |
|
WEP Initialization vector | wlan.wep.iv |
TKIP IV | wlan.tkip.extiv |
CCMP IV | wlan.ccmp.extiv |
Key identifier | wlan.wep.key |
Fields can be combined using operators. Ethereal supports a
standard set of comparison operators: == for equality, != for inequality, > for greater than, >= for greater than or equal to,
< for less than, and <= for less than or equal to. An
example of a display filter would be wlan.fc.type==1 to match Control
frames.
Logical operators and and
or are supported; as in many
programming languages, the exclamation point is used for logical
negation. Boolean fields can be tested for existence, so Control
frames with WEP enabled would be matched by the display filter
(wlan.fc.type==1 and
          wlan.fc.wep)
.
Figure 24-3 shows a complete 802.11 header in the tree view. Selecting the 802.11 header in the tree view highlights the bits that comprise the 802.11 header in the ASCII view at the bottom. Expanding the 802.11 header tree decodes all the fields in the 802.11 header.
Understanding the LLC header to isolate a protocol
To multiplex higher-level protocol data over the wireless link, 802.11 uses the LLC SNAP encapsulation. SNAP encapsulation is described at the end of Chapter 3. 802.11 does not include a protocol field, so receivers cannot discriminate between different types of network protocols directly from the header. To allow multiple protocols, an 8-byte SNAP header is added. The SNAP header is decoded in Ethereal’s tree view, as shown in Figure 24-4, for an EAPOL key frame.

Highlighting the LLC header in the tree view shows the corresponding 8-byte header in the packet dump. The eight bytes in the SNAP header are clearly visible in the data view pane. Five fields make up the header:
- The destination service access point (DSAP)--llc.dsap
This is always set to 0xAA for SNAP encapsulation.
- The source service access point (SSAP)—llc.ssap
This is always set to 0xAA for SNAP encapsulation.
- Control—llc.control
This is derived from HDLC. Like all data transfer using HDLC, it labels the data following the LLC header as unnumbered information (0x03). Unnumbered information indicates the use of a connectionless data transport and that the data need not be sequenced or acknowledged.
- An organizationally unique identifier (OUI)—llc.oui
This is used to determine how to interpret the following bytes. IP is encapsulated in LLC using the standard in RFC 1042, which specifies the use of the OUI 0x00-00-00. (Some vendors may use an assigned OUI for proprietary communications.)
- Protocol Type—llc.type
This is copied from the corresponding Ethernet frame. The Type field matches the Ethernet type codes. On IP networks, it will be either 0x08-00 for IP or 0x08006 for ARP. In the figure, it is 0x88-8e because the frame in question is an EAPOL (802.1X) frame.

LLC encapsulation is required by the 802.11 specification because it saves the 802.11 frame from having to carry protocol information directly. In many cases, however, the LLC header is encrypted and is not visible to the sniffer without first decrypting the trace.
802.11 Network Analysis Checklist
To illustrate how a network analyzer can aid network engineers in looking at wireless LAN traffic, this section presents checklists to assist in common authentication troubleshooting scenarios. The examples are described specifically for Ethereal but can be carried out with any of the commercial alternatives described earlier by applying similar operations.
Display Filter Primitives
Display filters are exceedingly useful on 802.11 because they are capable of operating on the minute details of decoded frames. Before diving into common troubleshooting scenarios, there are a few display filter building blocks that it is helpful to know.
Excluding Beacon frames
Beacon frames can get in the way when working with a raw 802.11 trace. Most products will send Beacon frames approximately 10 times per second, and the resulting traffic clutters the capture up. To remove Beacon frames, write a display filter that matches Beacon frames, and negate it.
Filter on the type code for management with
wlan.fc.type==0.Filter on the subtype code for Beacon with
wlan.fc.subtype==8.Combine the two and negate the operation by using the exclamation point for not with an expression of
!(wlan.fc.type==0 and
              wlan.fc.subtype==8)
.
Isolating traffic from one station
Often, a packet capture will be targeted at one particular station under test. There are many types of frames that fly between stations, so the method used to isolate just one station depends on what you are looking for.
The first method is to use the wlan.addr variable in a display filter, which is shorthand for traffic using that as either a source or destination address.
Keep only data from one station by using a display filter of
wlan.addr==00:02:2d:6e:ab:da, where the appropriate MAC address is filled in to the trace. This trace is equivalent to the much longer filter ofwlan.sa==00:02:2d:6e:ab:da or wlan.da==00:02:2d:6e:ab:da.
Source and destination addresses only appear in 802.11 Data frames. Troubleshooting some problems may require peeking deeper into 802.11 management operations, such as frame acknowledgment. Frame acknowledgments are sent to receiver addresses, not destination addresses. To see anything to or from a station including acknowledgments, use a display filter that includes the receiver address.
See acknowledgments by adding in the MAC address of the test station as a receiver with
wlan.ra==00:02:2d:6e:ab:da, which will show any acknowledgments sent to the station. To see acknowledgments from the station, it will be necessary to add a second receiver clause, for something of the form (wlan.ra==00:02:2d:6e:ab:da or wlan.ra==00:0b:0e:84:32:91), where the second address is the serving access point.
Isolating a protocol
If the body of a data frame is available, the LLC header can be a target for a display filter. Use the llc.type variable to look for a specified protocol. Protocol numbers must be entered as hexadecimal digits without a dash.
Look at a particular Ethernet protocol type with a filter of the form
llc.type==0x888e.
The other useful task that can be done with the LLC header is to search for frames sent using 802.1H encapsulation, which uses an OUI of 00-00-F8. The llc.oui matches on a hexadecimal number of six digits. On encrypted networks, the only LLC headers that are available are likely to be found on 802.1X frames, so do not be surprised if this filter does not display higher-layer protocols.
RFC 1042-encapsulated frames can be displayed by
llc.oui==0x000000.802.1H-encapsulated frames can be displayed by
llc.oui==0x0000F8.
Common Troubleshooting Tasks
With a basic understanding of how to build display filters to isolate frames of interest, we can proceed to discussing common troubleshooting tasks. Rather than present detailed examples with a great number of screenshots, this section will discuss how to isolate frames of interest and give a description of what you should see.
Authentication troubleshooting
Display filter: isolate EAPOL frames to and from a station, while looking for acknowledgments.
llc.type==0x888eandwlan.addr==supplicant-MAC and(wlan.ra==supplicant-MAC orwlan.ra==AP-MAC)
All EAPOL frames have an identifier that serves as a sequence counter. Each EAP packet acknowledges the previously received one. Look through the 802.1X session to ensure that each EAPOL frame has a corresponding 802.11 acknowledgment, and that the EAP identifier is incrementing. Some supplicants do not handle retransmissions well, and will crash. (For that reason, many access points must deauthenticate a hung 802.1X session and start over.)
By looking at the contents of the EAP packets, you may be able to learn where the authentication is failing. If it fails after the TLS tunnel establishment, it may be that the supplicant is failing to verify the server certificate. If data is pushed through the TLS tunnel, the authentication is likely failing for another reason. Check your RADIUS server logs for details.
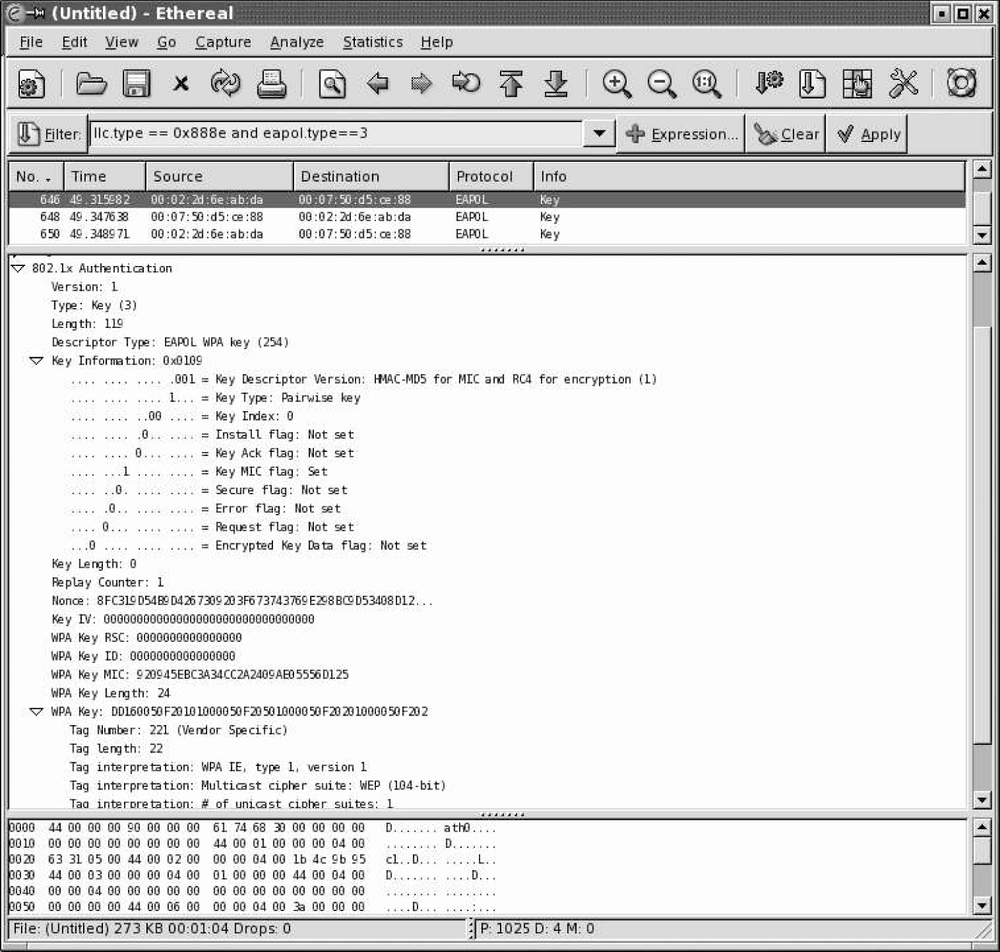
Key distribution troubleshooting
Display filter: isolate EAPOL key frames to and from a station.
llc.type==0x888eandeapol.type==3andwlan.addr==supplicant-MAC
There are six steps to correctly distributing keys. A portion of the handshake is shown in Figure 24-5. First, the four-way handshake must complete. As an initial sanity check, make sure that each frame is acknowledged. The quick way to do so is to look at the frame number in Ethereal. If the frame number increases by two, it is likely that the skipped frame is an 802.11 acknowledgment.
One of the most common reasons for key distribution to fail is a mismatch between the supplicant and authenticator security parameters. Ethereal has dissectors built to decode the information elements included in key frames. Figure 24-5 shows the start of an information element decode at the bottom of the tree view pane. In it, the group key is decoded as dynamic WEP. Later on in the decode, there is only one unicast cipher suite. WPA specifies that only one unicast cipher suite should be used, but this stricture is regularly broken by most products. Some supplicants, however, are unable to cope with common practice and will fail partway through the authentication. If the decodes of the information elements in the Association Request do not match those in the key handshake, the authenticator should fail the exchange.
Performance troubleshooting
Resolving performance issues is frequently much easier than identifying them. Generally speaking, performance issues fall into one of the following categories.
Display filter 1: isolate frames to and from a station, while looking for acknowledgments.
wlan.addr==client-MAC and(wlan.ra==supplicant-MAC orwlan.ra==AP-MAC)
This filter displays all traffic to and from a particular station, along with any acknowledgments. Search through the trace and look for frames that are transmitted repeatedly. If no acknowledgment is received, the frame must be retransmitted in full. When it is not received after multiple attempts, the card will step down its transfer rate to improve reliability. Lower signal to noise ratios are required for slower speeds. One option for resolving this type of performance problem may require increasing the density of access points in the area to improve signal quality. Improving the antenna system on the AP or the client may also help.
Display filter 2: traffic below a certain speed.
prism.rate.data <(speed tag)
In conjunction with the previous filter, it may help to look
only for frames above or below a certain speed. The prism monitoring
header adds a single integer for the speed of the frame. It is
reported in units of 500 kbps, so double the value of megabits per
second for use in this expression. To see all frames transmitted
slower than 2 Mbps, for example, use prism.rate.data < 4.
At the very bottom of the Ethereal screen below the data view pane is a window which reports the number of packets along with the number of displayed packets. In Figure 24-1, the capture has 261 frames (noted with the P), and all 261 are displayed (noted with the D). Applications of display filter 2 with a calculator will give you an idea of what fraction of frames are transmitted at which data rates. Many commercial tools report this analysis in real-time through a wizard.
Display filter 3: data traffic from overlapping networks.
wlan.bssid !=AP-MAC
Users may complain about performance because a different network is overlapping. 802.11b/g networks are especially prone to performance hits from overlapping networks because there are only three channels. To assess the degree of overlap, run a capture, and then use display filter 3 to keep only frames that are from other networks. If a substantial number of frames remain, try to locate the APs from those networks and turn the power down.
Decrypting WEP traffic
Many analyzers have the ability to decrypt WEP-encrypted frames by entering the keys. In Ethereal, for example, go to the Preferences option on the Edit menu, and select the IEEE 802.11 protocol to see the WEP options displayed in Figure 24-6. Upon entering keys, Ethereal will attempt to decrypt all frames with the specified keys. Manual WEP keys are easy to find; dynamic WEP keys need to be recovered from either the supplicant or the AP. Linux supplicants will display the encryption key in the output of iwconfig. Many access points have ways of dumping the contents of the key table, which network administrators may use to find the key derived from that station.

RADIUS analysis
Although not strictly related to wireless LANs, Ethereal also has the ability to decrypt RADIUS frames. In the preferences configuration for the RADIUS protocol, it is possible to enter the RADIUS shared secret. Once entered, any protected fields will be recovered automatically. By using RADIUS traffic, it would be possible to automatically recover dynamic keys, although I am not aware of any Ethereal add-ons to do so.
Other Tools
Other tools are often used for network analysis. Although not strictly used as troubleshooting tools, they are often used in assessing coverage.
Finding, Measuring, and Mapping Networks
Searching for 802.11 networks is the first step in connecting to them. Several analysis tools exist to discover networks or assess the coverage area of existing networks. Taken to its extreme, the result of network discovery is “wardriving,” in which a user with network discovery software logs the locations of access points. NetStumbler (http://www.netstumbler.com) and Kismet (http://www.kismetwireless.net) are two of the best-known tools.
Network detection is a passive process. Beacon frames can be collected with an 802.11 receiver, and there is nothing that can be done about it. Assuming your network will be discovered is the best policy. Instead of relying on obscurity, either by location, network name, or low transmission power, defend your network with appropriate security tools, such as the authentication and encryption methods discussed in Chapters 6 and 7. Although your network may be discovered, its data need not be.
WEP Key Recovery
Several open source tools are readily available to attack weak WEP keys. The best known is AirSnort, which was released in August 2001. Current code is available from http://airsnort.shmoo.com/. AirSnort was the first public implementation of the Fluhrer-Mantin-Shamir attack against WEP discussed in Chapter 5 and is the best known, but others exist.[113]
WEP key recovery tools depend on certain classes of “weak” initialization vectors. Ethereal has borrowed the AirSnort classification code, and now reports weak IVs. Commercial tools have reported on weak IV usage for many years as well.
To defend against WEP key recovery attacks, network administrators shorten the key lifetime to anywhere between 5 and 15 minutes. Many vendors have patched code to avoid using weak IVs as well. In early 2002, the Interop Labs discovered that several vendors had reacted with surprising speed and prevented the use of weak IVs. By 2004, however, the list of vendors with fixes was almost the same, even with two years to apply the fix.
Key recovery time estimates
There are two components to recovering a key. First, enough frames with weak IVs must be gathered to mount an attack, which I refer to as the gathering time. Second, a successful attack must be run against the stored frames, which I refer to as the analysis time.[114]
In my experience, the time required to gather enough data to mount the attack is so much larger than the CPU time required to run the attack that the estimate of key recovery time is essentially equal to the gathering time. With enough samples to successfully attack, the analysis time is only a few seconds. The analysis time scales linearly, so the protection afforded by longer keys is only a few seconds. By doubling the key length, the CPU time required for the attack will double, but doubling a few seconds is still only a few seconds.
Authentication
Most 802.1X authentication protocols on wireless networks use TLS tunnels for security. The ssldump tool (http://www.rtfm.com/ssldump/) can be used to decode a TLS handshake as well as anything passed through the tunnel. Decryption requires a copy of the private keys used with any certificates.
[113] See, for example, WEPcrack (http://wepcrack.sourceforge.net/) and Aircrack (http://www.cr0.net:8040/code/network/aircrack/).
[114] For a discussion of analysis time, see http://securityfocus.com/infocus/1814.