8. T-SQL Language Enhancements
SQL SERVER 2005 includes new Transact-SQL (T-SQL) functionality. SQL Server 2005 represents a major enhancement to SQL Server. Even if you ignore major additions such as hosting the CLR, Common Language Runtime, in process in SQL Server and support of XML as a first-class native data type, the T-SQL enhancements alone are enough to consider this a major update of SQL Server.
The enhancements span the range from more support of SQL:1999 syntax for SQL to enhanced error handling.
Improvements to Transact-SQL
In brief, the improvements include the following:
• Error handling—TRY/CATCH syntax for handling errors
– INTERSECT and EXCEPT
– TOP—Row count based on an expression
– ON DELETE and ON UPDATE
– APPLY—New JOIN syntax made for use with user-defined functions and XML
– Common table expressions—Declarative syntax that makes a reusable expression part of a query
– Hierarchical queries—Declarative syntax for tree-based queries
– PIVOT—Declarative syntax aggregations across columns and converting columns to rows
• Ranking functions and partitioning
This chapter uses the pubs and AdventureWorks database for its examples.
Error Handling
Prior to SQL Server 2005, handling of errors was tedious at best; some of the pieces of information associated with the error were not readily available; and some errors could be handled only on the client. SQL Server 2005 adds a TRY/CATCH syntax that allows all errors to be handled in T-SQL. It is similar to exception handling in a number of languages where TRY marks a section of code to be monitored for errors and CATCH marks a section of code to be executed if an error occurs. Some of these languages also support marking a section of code, called the finally block, to be executed in spite of an error occurring. SQL Server 2005 does not provide this capability.
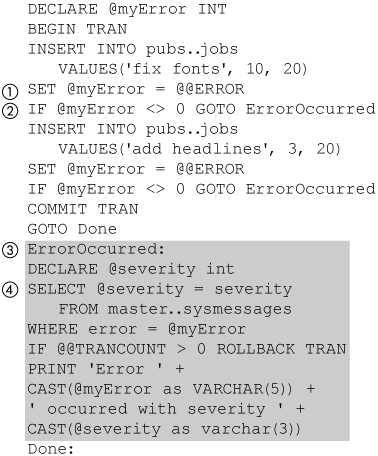
Prior to SQL Server 2005, errors were handled by reading the session variable @@ERROR read immediately after a statement was executed without knowing in advance whether that statement produced an error. An error was indicated by a nonzero value of @@ERROR. If the severity of the error was of interest, it would have to be looked up in the sysmessages table in the master database.
Figure 8-1 shows a way of handling errors using @@ERROR. The error number must be captured (1) after each statement and then tested (2). If the error number is not zero, control is transferred to an error handler (3). The error handler extracts the severity of the error (4) from the sysmessages table based on the error number. Some of this could be factored out into a stored procedure, of course, but this would still require that two lines of code be added to every statement to capture and then test the error number.
Figure 8-1. @@ERROR error handler
There are a couple of issues with using @@ERROR. One is that certain types of errors terminate the execution of the batch, so the code that tests @@ERROR is never run. Another issue is that @@ERROR depends on your never forgetting to add those capture and test lines. When you miss doing this, you introduce a very hard-to-find bug when, for example, a transaction that should be rolled back is not. Code would be much more robust if you could just declare, “If something goes wrong, do this,” where “this” is an arbitrary error hander that you provide.
In fact, SQL Server does provide a limited way to do this, by setting the XACT_ABORT=ON. In this case, an error will cause an existing transaction to be rolled back automatically without any coding on your part. This is all you can do with this feature, though; you cannot specify that a particular error handler be used.
SQL Server 2005 adds a feature to T-SQL that allows you to specify declaratively an arbitrary error handler. This feature is called exception handling. To use it, you mark an area of code that you want to TRY to execute and mark another area of code to CATCH any error that occurs in the code you tried to execute. This technique works for most errors, even deadlock errors, which prior to SQL Server 2005 could be handled only on the client. Note that this technique will not work for syntax errors or fatal errors that end the connection to the user.
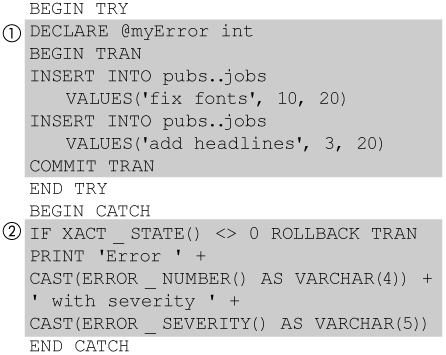
The code in Figure 8-2 is equivalent to that in Figure 8-1, but it uses the new exception syntax. The code you want to try to execute (1) is put between BEGIN TRY and END TRY phrases. The error handler (2) immediately follows it and is between BEGIN CATCH and END CATCH phrases. A BEGIN TRY/END TRY must always be followed immediately by a BEGIN CATCH/END CATCH. There is a lot less typing in Figure 8-2 than in Figure 8-1, which is always a plus, but the real value is that you cannot “forget” to add the error capture and error test after each statement, and it catches almost all errors.
Figure 8-2. TRY/CATCH error handler
Besides being a more robust and less tedious way to write code, SQL Server 2005 exceptions provide more information than @@ERROR does. In fact, the @myError variable shown in Figure 8-2 is really superfluous; there is no need to capture @@ERROR any more. Table 8-1 shows functions that SQL Server 2005 has to pass on error information to an error handler. Note that these functions are valid only inside a BEGIN CATCH/END CATCH clause.
Table 8-1. Error Functions
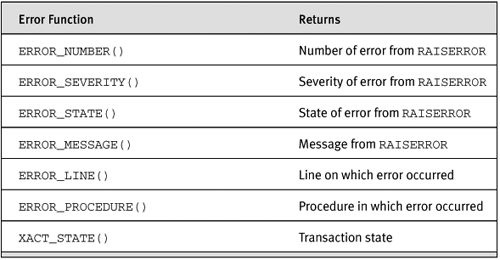
The ERROR_NUMBER(), ERROR_SEVERITY(), ERROR_STATE, and ERROR_MESSAGE() functions return the corresponding values from the RAISERROR that was used to report the error—that is, caused the exception. ERROR_LINE() and ERROR_PROCEDURE() identify the T-SQL that caused the error. XACT_STATE() indicates whether a transaction is in progress or whether the transaction is in an uncommittable state. Uncommittable transactions are something new that we will be looking at later in this chapter.
Figure 8-3 and Figure 8-4 show the usage of all the error functions except XACT_STATE(). Figure 8-3 shows a stored procedure (1), BadInsert, which attempts to insert an illegal value into the jobs table of the pubs database. The min_lvl column in the jobs table has a check constraint on it that requires it to be at least 10.
Figure 8-3. BadInsert stored procedure

Figure 8-4. Catching error

The batch in Figure 8-4 executes (1) the BadInsert stored procedure inside a BEGIN TRY/END TRY clause. The error handler (3) prints out the values of the various error functions.
Figure 8-5 shows the output produced by the error handler in Figure 8-3. Note that the error message (1) produced is the actual error output message, not the template of the error message that is stored in master.. sysmessages. There was no need to capture @@ERROR; the error number is available in the handle through the ERROR() function. Also included are the name (2) of the stored procedure and the line number in the stored procedure that produced the error.
Figure 8-5. Error handler output

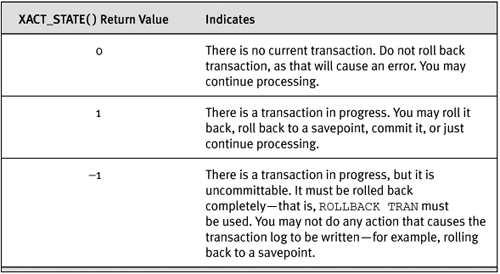
The XACT_STATE() indicates the state of the transaction when the error occurred; its possible return values are summarized in Table 8-2. There are three possible states: no transaction, committable transaction, and uncommittable transaction. The first two are ones we typically deal with. The uncommittable transaction means that the transaction cannot be committed, and the batch may not take any action that causes something to be written to the transaction log—for example, rolling back a transaction to a savepoint.
Table 8-2. Possible Values of XACT_STATE
Prior to SQL Server 2005, you never had to deal with an uncommittable transaction yourself in T-SQL. The reason you do now is that some errors in a BEGIN TRY/END TRY clause transfer control to the BEGIN CATCH/END CATCH clause before SQL Server 2005 has a chance to clean up all the things that it normally would. Probably the most common uncommittable transaction is produced by a trigger that raises an error inside a BEGIN TRY clause. Note that the behavior of triggers outside a BEGIN TRY clause is unchanged from previous versions SQL Server. Also, in some cases an error in a distributed transaction can lead to an uncommittable transaction, and whenever an error occurs and XACT_ABORT is ON, the transaction will be uncommittable in the error handler.
It is important that the error handler in a BEGIN CATCH/END CATCH clause check for an uncommittable transaction and roll it back. If the error handler does anything—for example an INSERT, which requires the transaction log to be written—before rolling back an uncommittable transaction, the batch will be terminated, and the rest of the handler will not be run.
Figure 8-6 shows a T-SQL batch that attempts to do an INSERT during an uncommittable transaction. It starts (1) by setting XACT_ABORT ON. Next, it does an INSERT (2) into the jobs table that violates a check constraint on that table. This transfers control to the error handler in the BEGIN CATCH/END CATCH phrase with an uncommittable transaction pending. The error handler attempts do to a valid INSERT (3) into the jobs table. This terminates the batch, rolls back the transaction, and sends the client a 3930 error. The PRINT instruction (4) is never executed.
Figure 8-6. Uncommittable transaction

Figure 8-7 shows a T-SQL batch whose intention is to commit all inserts into the jobs table of the pubs database up to the point at which an error occurs. It starts by setting XACT_ABORT ON (1).
Figure 8-7. Handling uncommittable transaction
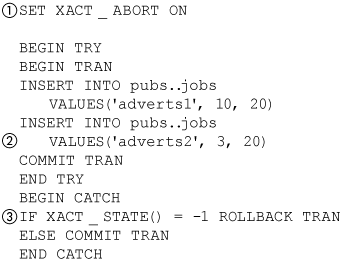
The second insert (2) in the script will produce an error because it will violate a check constraint on the min_lvl column of the jobs table.
The intention of the batch, however, is to commit the INSERT previous to this one if possible.
The first thing the error handler does is to check (3) to see if the transaction is in an uncommittable state. If so, it rolls back the transaction; otherwise, it commits it. In this script, the entire transaction will be rolled back, because when XACT_ABORT is ON, an error will always leave a transaction in an uncommittable state if there is an error. Note that if this T-SQL script were executed with XACT_ABORT OFF, the 'adverts1' job would have been committed and the 'adverts2' job would not have been committed, as was the intention of the batch.
At first glance, it might seem that the new TRY/CATCH is somehow taking away capabilities that versions previous to SQL Server 2005 had, because it forces us to roll back a transaction. It seems that the option of committing everything up to the point of an error has been taken away from us. If error handling for the T-SQL batch in Figure 8-7 were done as was shown in Figure 8-1—that is, using the @@ERROR variable—neither row would have been inserted; the entire transaction would have been rolled back automatically because of XACT_ABORT ON.
The difference is that if the batch in Figure 8-1 were executed with XACT_ABORT ON, we would never even see the error—that is, its error handler would never have been executed, because XACT_ABORT would not only have rolled back the transaction, but also terminated the batch. The batch in Figure 8-7 will have the opportunity to process the error even if XACT_ABORT is ON, but it will also have the responsibility to roll back any uncommittable transaction.
A feature of some languages that catch errors is the ability to rethrow an error. In SQL, Server you can do the equivalent by using a RAISERROR statement. The new functions, such as ERROR_NUMBER and ERROR_STATE, in SQL Server 2005 make it possible to do this more easily than could be done in the past.
Figure 8-8 shows the part of an error handler that reraises an error. The RAISERROR statement can take only literal values or variables as input, so it is necessary to capture error information in variables (1) in the handler so that RAISERROR can use them.
Figure 8-8. Reraising error
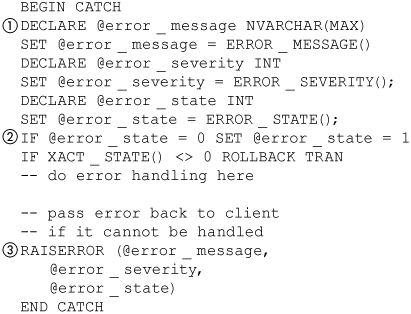
SQL Server can raise some errors that have an error state of zero, for example—a check-constraint violation. The RAISERROR statement does not allow an error state of zero, so this must be checked for and changed (2) to a value greater than zero. You will have to decide your own convention for this.
If, after processing the error, the error handler decides that it cannot handle the error, it can reraise the error using the RAISERROR statement (3) and the error values captured at the beginning of the error handler.
One kind of error that, at least in theory, should not be passed back to the client application is a deadlock error. A client application doesn’t cause a deadlock, and typically, it will have no idea how to handle it. Prior to SQL Server 2005, there was no choice but to pass a deadlock error, and many other errors, back to the client for handling.
We will look at handling a deadlock error in T-SQL as an example of how, in general, all these errors can be handled in T-SQL. Note that SQL Server does not produce timeout errors; clients do. A client can choose to terminate a batch if the batch seems to be taking to long to complete. TRY/CATCH clauses will not catch timeout errors; they must still be handled on the client.
Prior to SQL Server 2005, SQL Server would roll back one of the transactions involved when a deadlock occurs. It would also terminate the batch involved and send a 1205 message to the client on that connection, saying that the batch had been terminated and the transaction rolled back. The batch that is terminated is not given the opportunity to process the error by, for example, retrying the transaction.
Client and middle-tier applications often don’t realize that they are responsible for retrying queries terminated due to deadlock. They view the deadlock error as fatal, because they don’t know a 1205 error can be retried, and just pass back an incomprehensible error message that says they were “chosen as a deadlock victim.” This is compounded by the fact that under normal circumstances, deadlock don’t often occur. The result is that the occasional deadlock can lead to at best the appearance of flakiness in an application and at worst can cascade into a real problem. The retry logic for deadlocks prior to SQL Server 2005 had to reside in the client, but now TRY/CATCH provides an alternative; it can be encapsulated inside the server.
One of the things that must be considered is that in general, it makes sense to retry only some errors—that is, 1205 errors. Other errors should be sent back to the caller or otherwise handled. A second consideration is that retrying a transaction in T-SQL takes this ability away from the client and centralizes it in the server. This lets the server use a standard way across all applications to retry transactions and even log that fact so that retries can be monitored, but because it is a very different way of handling things, it could have an unexpected effect on existing applications that currently handle retry themselves.
When a transaction in a BEGIN TRY/END TRY clause is terminated because of a deadlock, control is transferred to the BEGIN CATCH/END CATCH clause, just like any other error, with an ERROR_NUMBER of 1205. The typical response to a 1205 error should be just to retry the query—a couple of times, if need be. Even a completely correctly designed database can occasionally experience a deadlock. In SQL Server 2005, the client can be insulated, to a large extent, from this event by implementing this response in T-SQL itself.
Note that retrying deadlocks from T-SQL is not a solution for a database that is having frequent deadlocks. In this case, the underlying cause should be found and fixed.
Figure 8-9 shows a batch that retries transactions that are aborted due to deadlock. Obviously, there are many variations on this, including logging, but this example covers the main points. The first thing the batch does is make a variable (1), @retryCount, that is used to limit the number of retries.
Figure 8-9. Retrying transaction
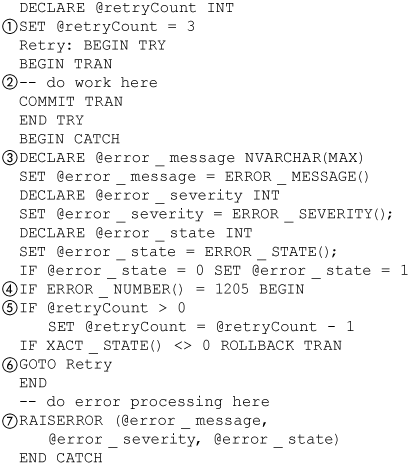
The work the transaction is to do (2) is put inside a labeled BEGIN TRY/END TRY clause.
The BEGIN CATCH/END CATCH clause starts by capturing the error information (3) so that it can be reraised later, if necessary. Next, it checks to see whether a deadlock error occurred (4). If that was the case, it checks to see whether there are any retries left (5). If there are any retries left, it decrements the retry count, rolls back the transaction if necessary, and then goes to the Retry label (6).
If there are no retries left, or the error was not due to a deadlock, the transaction does normal error cleanup and then reraises (7) the error if necessary.
Listing 8-1 is an example that puts together some of the things we have been discussing about BEGIN TRY/BEGIN CATCH. It is meant only as a simple example of how BEGIN TRY/BEGIN CATCH works, not as a standard idiom. It starts by making a couple of error messages: 50001 for an error that should be retried and 50002 for a garden-variety error for which retry isn’t useful.
It is often useful to be able to reraise an error in a BEGIN CATCH phrase. You can’t just reraise the same error; you don’t have enough information to duplicate the original RAISERROR. The example adds a new message, 60000, for reraising errors. The text for the message will have the information about the underlying error.
The ReRaise stored procedure makes it easy to format the text for the 60000 messages. Note that this stored procedure is useful only inside a BEGIN CATCH phrase, because it uses functions like ERROR_NUMBER() that are useful only inside a BEGIN CATCH phrase.
The Retry stored procedure encapsulates the information about what errors can be retried and how many times they should be retried. Note that the ERROR_NUMBER() is checked against a list of retryable errors; it includes the concurrency error 1206 and the error we arbitrarily said was retryable (50001). The status returned by Retry is zero if the error is not retryable—that is, it is an ordinary error.
It returns a status of two when no more retries are left. You could encapsulate the logging of failed retries here. It returns a status of one if another retry should be done. You could encapsulate the logging of retries here.
Note that this stored procedure assumes that the parameter @retryCount is NULL when it is first called.
The ErrorTestW stored procedure is a stored procedure used to try out the Retry and ReRaise stored procedures. The local variable @status will capture the result of executing the Retry stored procedure. As long as @status is NULL or greater than zero, the BEGIN TRY phrase of the ErrorTestW will be run, over and over. All the BEGIN TRY phrase does is raise the error number passed into it; we will pass in 50001 and 50002 to see how it behaves for retryable errors and those that are not.
The result of the RAISERROR in the BEGIN TRY phrase, of course, will be to pass control to the BEGIN CATCH phrase. The BEGIN CATCH phrase executes the Retry stored procedure and checks the status it returns. If the status returned is two, the retry count has expired, and there is nothing left to do except do cleanup and maybe reraising the error, which it does by executing ReRaise. A returned status of zero indicates a garden-variety error so it just cleans up and reraises the error. A return status of one just repeats the BEGIN TRY.
Listing 8-1. TRY/CATCH usage
EXEC sp_addmessage 50001,
16,
N'retryable error %s'
EXEC sp_addmessage 50002,
16,
N'error %s'
EXEC sp_addmessage 60000,
10,
N'Reraised Error %d, Level %d, State %d, Procedure %s, Line %d,
Message: %s';
CREATE PROC ReRaise
AS
DECLARE @error_message NVARCHAR(MAX)
SET @error_message = ERROR_MESSAGE();
DECLARE @error_number INT
SET @error_number = ERROR_NUMBER()
DECLARE @error_severity INT
SET @error_severity = ERROR_SEVERITY();
DECLARE @error_state INT
SET @error_state = ERROR_STATE();
IF @error_state < 1 SET @error_state = 1
DECLARE @error_procedure NVARCHAR(200)
SET @error_procedure = ISNULL(ERROR_PROCEDURE(), '?'),
DECLARE @error_line INT
SET @error_line = ERROR_LINE()
RAISERROR(60000,
@error_severity,
1,
@error_number,
@error_severity,
@error_state,
@error_procedure,
@error_line,
@error_message
)
GO
CREATE
PROC Retry(@retryCount INT OUTPUT)
AS
PRINT 'retry'
IF ERROR_NUMBER() in (1206, 50001)
BEGIN
IF @retryCount IS NULL SET @retryCount = 3
IF @retryCount > 0
BEGIN
-- add logging as appropriate
SET @retryCount = @retryCount - 1
RETURN 1 -- retry expression
END
ELSE
-- add logging as appropriate
RETURN 2 -- retry expired
END
RETURN 0 -- not retryable
GO
CREATE PROC ErrorTestW(@error INT)
AS
DECLARE @status INT
WHILE ISNULL(@status, 1) > 0
BEGIN TRY
-- simulate an error
RAISERROR (@error, 16, 1, 'oops')
END TRY
BEGIN CATCH
DECLARE @retryCount INT
EXEC @status = Retry @retryCount OUTPUT
IF @status = 2
BEGIN
-- retry expired, do cleanup
-- just so you can see it happening
print 'do retry'
EXEC ReRaise
RETURN
END
IF @status = 0
BEGIN
-- if you get to here it is
-- not retryable, clean up as
-- for other errors
PRINT 'cleanup'
-- if you want to
EXEC ReRaise
END
END CATCH
GO
EXEC ErrorTestW 50001
EXEC ErrorTestW 50002
Figure 8-10 shows the results of the ErrorTestW stored procedure for 50001 and 50002. Note that the 50001 error gets retried a number of times and then is reraised. You can see that the text of the first 60000 message tells you the underlying error was 50001.
Figure 8-10. Testing reraise

The 50002 error failed on the first try because it was not on the list of retryable errors.
Note that system errors would be rethrown immediately, the same way as these user errors, if they were not on the list of retryable errors. Their information is wrapped up in the error message, and the recipient of the error would know it was a retry error because the error code was 60000.
INTERSECT and EXCEPT
The strength of T-SQL lies in its ability to operate efficiently on sets of entities—for example, rows in a table. A common set operation is to make a new set that contains all the entities common to both sets. Another is to remove from a set those entities that are contained in some other set. Previous to SQL Server 2005, these operations could be performed using the EXISTS keyword. SQL Server 2005 introduces two operators, INTERSECT and EXCEPT, that perform the operations in a more straightforward manner.
The INTERSECT and EXCEPT operators connect two SELECT expressions—that is, there is an individual SELECT expression to the left and right of the operator. Each of the SELECT expressions must produce the same number of columns, and the corresponding columns must be of data types that are comparable. Note that anything that can be done using INTERSECT and EXCEPT can be done using EXISTS, but in some cases, the new operators are more straightforward.
The query in Figure 8-11 finds all the states that have a publisher but no author. The expression selects all the states (1) from the publishers table and then removes from it any states (2) found in the authors table. What are left are the states that have publishers but no authors. This leaves five states and a NULL. There is a NULL because the publishers table contains some non-U.S. publishers that have a NULL for their state code, but there are no authors that have NULL for their state code.
Figure 8-11. Publisher states with no authors
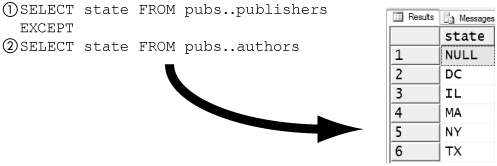
INTERSECT and EXCEPT are part of what makes SQL Server 2005 more compliant with the SQL:1999 standard. SQL Server 2005 does not support the CORRESPONDING BY clause, however, and INTERSECT and EXCEPT always produce distinct results, which is optional in SQL:1999.
Figure 8-12 shows a query that produces the same result as the one in Figure 8-11. Note the use of the DISTINCT (1) keyword. INTERSECT and EXCEPT in SQL Server 2005 never produce duplicates, so this is needed to purge duplicates. WHERE NOT EXISTS (2) is the equivalent of EXCEPT in this case. Likewise, WHERE EXISTS would be the equivalent of INTERSECT. Note that an OR clause (3) must be added so that NULL values will compare as equal. INTERSECT and EXCEPT consider the equality comparison of two NULL values to be true.
Figure 8-12. Equivalent EXCEPT syntax

The order of the SELECT statements in an EXCEPT expression is significant. The states that have publishers but no authors are not the same as the states that have authors but no publishers. Figure 8-13 shows the result of reversing the order of the SELECT statements in Figure 8-11.
Figure 8-13. Author states with no publishers

INTERSECT can be used to find all the states that have both an author and a publisher. Figure 8-14 shows an example of this.
Figure 8-14. States with an author and publisher

It is a bit more work if you want to find the names of the publishers that are in states that have no authors, rather than the names of states. Figure 8-15 shows some ways you might try to get the publisher names. A SELECT (1) on the left of the EXCEPT operator may not include the pub_name column (1) unless there is a corresponding column in the SELECT on the right of the EXCEPT operator. The SQL:1999 standard CORRESPONDING BY (2) is a straightforward way to do what we want, but it cannot be used, because it is not supported by SQL Server 2005. CORRESPONDING BY allows you to specify the columns used for intersection or exception as a subset of the columns that are selected in the left expression.
Figure 8-15. Wrong ways to find publisher names

Figure 8-16 shows some queries that will find the names of publishers in states that do not have authors. One way is to use an EXCEPT expression (1) as a subquery that is part of an IN clause. Another way is to use the WHERE NOT EXISTS equivalent (2) of the EXCEPT expression (1) to find the publishers. Note that both queries are complicated by the fact that the publishers and authors tables allow NULL in the state column.
Figure 8-16. Publisher names from states without authors
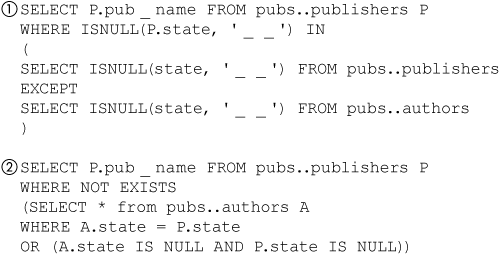
In some cases, the latter query in Figure 8-16 will produce a better execution plan. You will have to look at the execution plan on a case-by-case basis to decide which form to use. Figure 8-17, for example, shows the relative query costs for the execution plans for the two queries shown in Figure 8-16. Also keep in mind that execution plans depend not only on the query itself, but also on the indexes and other resources that are available.
Figure 8-17. Relative execution plans

An INTO clause can be used with INTERSECT or EXCEPT as shown in Figure 8-18. It must appear in the left SELECT expression (1) if it is used.
Figure 8-18. Using INTO clause

There some limits and other considerations when using INTERSECT or EXCEPT. ORDER BY can be used only to order the overall results; it cannot be used with the individual SELECT statements. GROUP BY and HAVING may be used in the individual select statements but not with the overall results.
Top
Prior to SQL Server 2005, the TOP clause required its value to be a literal value and could be used only in a SELECT statement. In SQL Server 2005, the value can be an expression, and it can be used in DELETE, UPDATE, and INSERT in addition to SELECT.
The fact that the value of a TOP clause can be an expression means you can now use TOP in places that previously would have required dynamic SQL.
Figure 8-19 compares parameterizing the top rows returned by a SELECT statement using the new TOP syntax with the technique used in SQL Server before SQL Server 2005. The first stored procedure (1) in Figure 8-19 parameterizes the top number of best-selling titles to be selected from the titles table in the pubs database. The new TOP syntax uses an expression inside parentheses that follow the TOP keyword (2) instead of a literal numeric value without parentheses. The old syntax for SELECT is still supported, too.
Figure 8-19. TOP value as a parameter
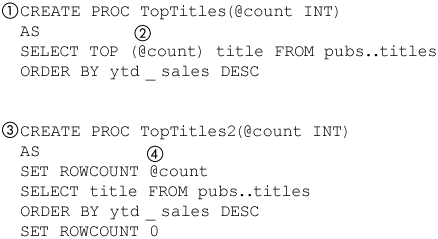
The second stored procedure (3) in Figure 8-19 produces the same results as the first stored procedure (1) but uses SET ROWCOUNT instead. SET ROWCOUNT in earlier versions of SQL Server was the only way, in effect, to parameterize TOP, but it had some limitations. One of the limitations was that a SET ROWCOUNT–based expression was not composable—that is, it could not be used as a subquery or derived table.
The stored procedure TopPublishers in Figure 8-20 selects the publishers of the @count top best-selling titles. The TOP clause is part of a subquery (1) and is parameterized by @count (2). SET ROWCOUNT would not be very useful here, because it would apply to both the main query and the subquery. It would be possible to implement TopPublishers using SET ROWCOUNT, but it would be a more complicated stored procedure and probably would have a temporary table or variable.
Figure 8-20. Selecting top publishers

Another limitation of SET ROWCOUNT is that it exactly limits the number of rows returned. TOP, in SQL Server 2005, and previous versions, supports the WITH TIES phrase. WITH TIES must be used in conjunction with an ORDER BY clause and causes SQL Server to count rows with the same value as a single item for the purposes of counting for TOP. Figure 8-21 shows the TopTitlesTies stored procedure, which produces a different list of top titles by using the WITH TIES phrase (1).
Figure 8-21. Top titles, including ties
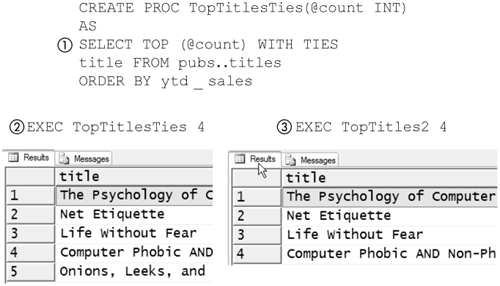
When ties are included, there are five top titles when four are asked for (2) in the titles table in the pubs database. Note that TopTitles2 (3), which uses SET ROWCOUNT, finds only four top titles.
SQL Server 2005 now supports the use of TOP in DELETE, INSERT, and UPDATE expressions. Note that the TOP syntax, when used with these commands, must include parentheses, even if a literal value is used.
One of the uses of TOP is to reduce contention that can be caused when an expression accesses a large number of rows. A DELETE expression is always a single transaction, even if it spans a large number of rows. This can result in many locks being held for a long time, which impacts overall performance because of contention for the locks and retaining rows in the transaction log for a long time. The use of locks can be minimized by repeatedly executing the DELETE expression on a small number of rows until all the desired rows have been deleted.
Figure 8-22 shows the TestData table (1) being filled (2) with some data. Then all the rows where data is greater than 500 are deleted, in blocks of ten, to minimize the use of locks. The block size is parameterized in the @block, which is then used in a TOP phrase (3). If any rows were successfully deleted (4), the DELETE (3) command is repeated.
Figure 8-22. Delete in blocks
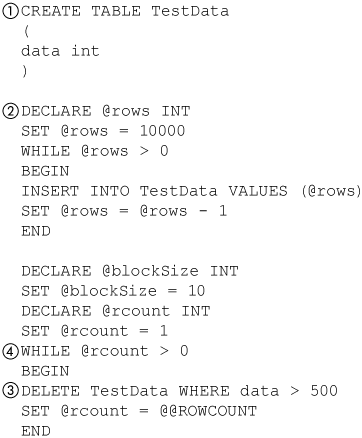
This is a trivial table, of course, and the rows involved could have easily been deleted in a single expression with no impact on the server, but this example is meant just to show the technique. This technique is useful when a large number of rows must be deleted.
Note that the technique shown Figure 8-22 is not deleting the rows in a single transaction. This means that a failure will leave some rows deleted and some rows not deleted. If the operation were done in a single transaction, all the rows would have been deleted, or none would have been deleted. This is a tradeoff you will have to make, but the technique shown in Figure 8-22 will have less negative impact on the running server when a large number of rows is involved and requires a smaller number of entries in the transaction log to be rolled forward in the event of a failure and restart of SQL Server.
SET ROWCOUNT could have been used, of course, and would have produced the same effect as TOP in Figure 8-22, but it certainly would have led to a more complicated T-SQL script. Moreover, some future version of SQL Server is slated to drop support for the use of SET ROWCOUNT with INSERT, UPDATE, and SELECT commands. If you are using SET ROWCOUNT with these commands in your T-SQL scripts, you will not have to update them for SQL Server 2005, but at some point in the future, you will.
ON DELETE and ON UPDATE
The ON DELETE and ON UPDATE clauses of the CREATE TABLE expression give you another way to manage columns that have foreign keys. Figure 8-23 shows some tables that keep track of departments and employees in a company. The Departments table has a column named Manager that, to ensure that the manager is an employee, has a foreign key that references the Employees table.
Figure 8-23. Departments and employees
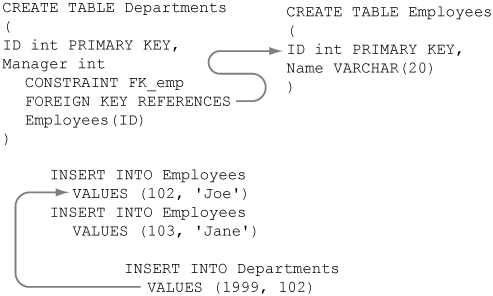
A simple query will show that Joe is the manager of department 1999. If Joe leaves the company, he will have to be deleted from the Employees table, but that will not be possible until the Departments table is updated with a new manager or the department itself is deleted from the Departments table. In the case where deleting the department is not an option, the Departments table will have to be updated with a new manager.
This is an example of a typical parent–child relationship. You can think of the Employees table as holding the parents and the Departments table as holding the children, though not every employee has a department as a child. The general problem is that a change to a parent may require a change to its children.
A couple of conventions can be used if Joe leaves on short notice and no new manager has been selected for the department. One is to replace the manager of the department with a NULL, and the other is to replace the manager with a well-known ID from the Employee tables that is used to indicate that no employee exists for the position. The latter convention is useful if you would rather not have to deal with NULL values in your database.
The ON DELETE clause can be added to the column definition of a table to specify which of these conventions to use when a corresponding row in the table being referenced is deleted. The same issue can come up with the same conventions possible when the table being referenced is updated, of course. The ON UPDATE clause also can be added to a column definition to specify which convention to use in this case.
Figure 8-24 shows the Departments table defined using the ON DELETE and ON UPDATE clauses. In the case of a delete, the “replace with NULL” convention is being used. In the case of update, the “replace with well-known value” convention is being used. It is unlikely that you would want to use different conventions for delete and update on the same column, of course, but it is done in this case so the example can show how each works.
Figure 8-24. Using ON UPDATE and ON DELETE
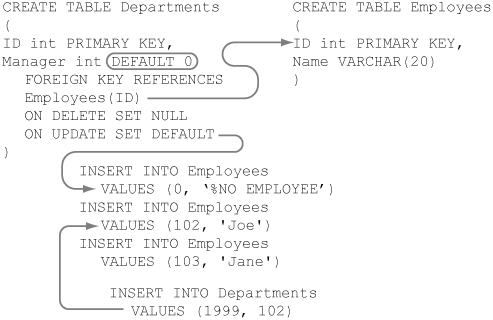
If the row being referenced by the Manager column is deleted, the value for the manager column will be replaced with NULL. If the row being referenced by the Manager column is updated, and its ID is changed, the value for the Manager column is replaced with the default value for the column, which in this case is zero.
Figure 8-25 shows the effect of the ON DELETE and ON UPDATE clauses. The Employees table is updated (1), and the ID of employee 102—Joe, the manager of department 1999—is changed to 110. This causes the “replace with well-known value” convention to be used to update the Departments table so that employee 0 becomes the manager of department 1999.
Figure 8-25. Effects of ON UPDATE and ON DELETE

Next, employee 0 is deleted (2) from the Employees table. The causes the “replace with NULL” convention to be used to update the Departments table so that NULL becomes the manager of department 1999.
The ON DELETE and ON UPDATE clauses make it easy to specify declaratively the use of the “replace with NULL” or “replace with well-known value” conventions for handling the cases where foreign keys change. There are some caveats, of course. In no case will these clauses let any constraints be violated. If an ON DELETE/UPDATE SET DEFAULT clause is used, the default value for the column must exist in the column being referred to when a row in a referenced table is deleted or updated. Likewise, an ON DELETE/UPDATE SET DEFAULT clause may be used only on a column that allows NULLs.
Output
Prior to SQL Server 2005, the only way to observe, after the fact, the results of an INSERT, DELETE, or UPDATE command was through a trigger. From within a trigger, you get to see the state of a row before and after the execution of the command. SQL Server 2005 adds an optional OUTPUT clause to the INSERT, UPDATE, and DELETE commands that in effect lets you capture the information you would see inside a trigger, but see it in a T-SQL script or stream it back to a client.
The INSERT, UPDATE, and DELETE commands use a common syntax for the OUTPUT clause itself but differ in its placement in the command. The OUTPUT clause can be used as though it were a SELECT command that returns results to the client or with an INTO clause that adds rows to a table.
One of the uses of OUTPUT is to obtain the value of an identity column that was assigned to a row by an INSERT command.
Figure 8-26 shows the use of OUTPUT as though it were a SELECT. It creates the table TestData (1) to hold some data that might result from a testing process. It does an INSERT command (2) to add a value to the data. The INSERT command includes an OUTPUT clause (3) that returns (4) both the data value and its new identity. The SCOPE_IDENTITY() function could have been used to get the new identity in this example, but later, we will see that this technique can be used when multiple rows are added and SCOPE_IDENTITY() would not be useful.
Figure 8-26. Obtaining identity

The part of the OUTPUT clause syntax that is common to all OUTPUT clauses is the OUTPUT keyword followed by comma-separated column names, optionally aliased. The columns can come from the INSERTED or DELETED table.
The INSERTED and DELETED tables are logical tables, not physical ones. The INSERTED table will contain all the columns of the table being processed. The columns will contain the values of the rows changed or added after processing—that is, after the INSERT or UPDATE has taken place. The DELETED table will contain the values of the rows changed or removed prior to processing—that is, prior to the DELETE or UPDATE command’s being executed.
An INSERT command produces only an INSERTED table. A DELETE command produces only a DELETED table. An UPDATE command produces both tables.
Figure 8-27 shows some typical usages of OUTPUT. The UPDATE statement at the top of the figure uses both the DELETED (1) and INSERTED (2) tables. It aliases the data columns from the INSERTED and DELETED tables to distinguish the old and new data in output. The OUTPUT clause comes immediately after the SET clause and before any FROM or WHERE clause in an UPDATE command.
Figure 8-27. Typical usage of OUTPUT
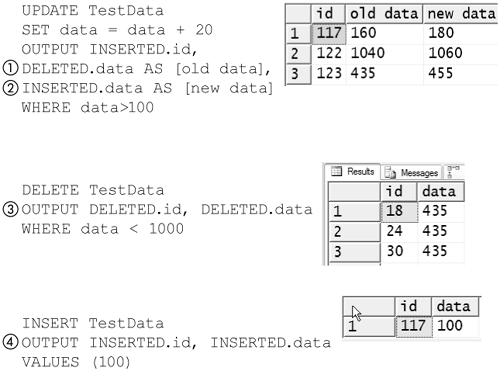
The values returned by an OUTPUT clause reflect the values after the INSERT, UPDATE, or DELETE has been executed but before any triggers have fired. For an INSTEAD OF trigger, the values will reflect what would have been in the table if there was no INSTEAD OF trigger, but of course, the INSTEAD OF trigger will still fire.
The DELETE statement in the middle of the figure uses the DELETED (3) table. The OUTPUT clause comes immediately after the table name and before any WHERE clause.
The INSERT statement at the bottom of the figure uses the INSERTED (4) table. The OUTPUT clause comes immediately before any values in an INSERT command.
The identity in Figure 8-26 could have also been obtained using the SCOPE_IDENTITY function without the use of the OUTPUT clause, of course. But SCOPE_IDENTITY isn’t useful if more than one row is processed in a single statement. Note that neither @@IDENTITY nor SCOPE_IDENTITY should be used in an OUTPUT clause; either will return the value of the identity as it was before the expression was executed.
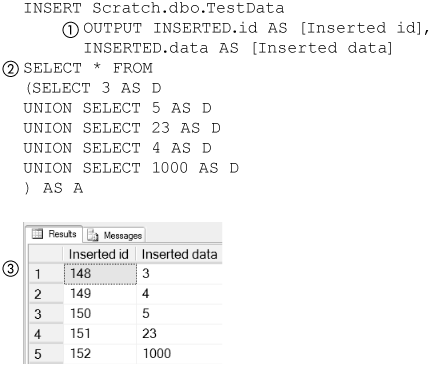
Figure 8-28 shows using an INSERT/SELECT statement to insert multiple rows of data. It uses the same OUTPUT clause (1) as the example in Figure 8-26 does. The data is selected from a subquery that just unions some sample data. The client receives (3) a row for each value inserted that includes the value itself and its identity.
Figure 8-28. Obtaining identities from bulk insert
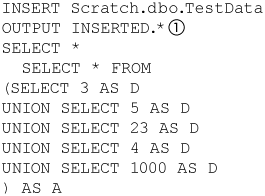
The * wildcard can be used with either the INSERTED or DELETED table. This is shown (1) in Figure 8-29.
Figure 8-29. Wildcard usage
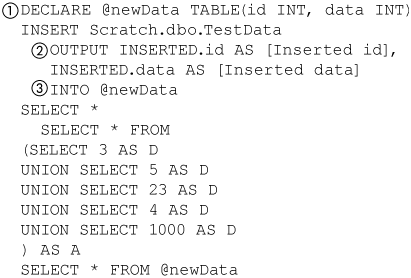
The OUTPUT cause can also be used to insert into a table instead of returning a rowset. It supports inserting into a permanent, temporary, or variable table. It does not support the SELECT/INTO syntax that creates a table and then inserts data into it. The example in Figure 8-30 creates a table variable (1). It uses an OUTPUT clause (2) in the same way that Figure 8-28 did but adds an INTO clause (3) to it to insert the newly added data into the table variable @newData. The INTO clause always comes after the last column specified in the OUTPUT clause.
Figure 8-30. Using OUTPUT INTO
APPLY Operators
SQL Server 2005 adds two specialized join operators: CROSS APPLY and OUTER APPLY. Both act like a CROSS JOIN operator in that they join two sets and produce their Cartesian product, except that no ON clause is allowed in a CROSS or OUTER APPLY. They are distinguished from a CROSS JOIN in that the expression on the right side of a CROSS or OUTER APPLY can refer to elements of the expression on the left side. This functionality is required to make use of the nodes function, which is discussed in Chapter 10 and can also be useful in queries that do not involve XML.
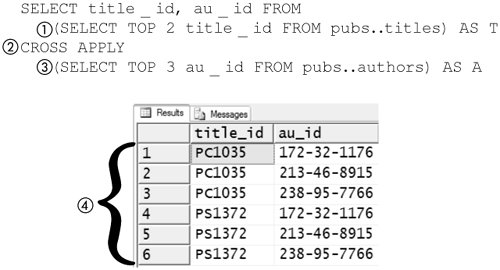
Figure 8-31 shows the mechanics of using CROSS APPLY (2). Here, it is used to produce a Cartesian product of two sets. The first set (1) is the unqualified top two titles in the titles table in the pubs database. The second set (3) is likewise the unqualified top three authors in the authors table in the pubs database. The result (4) is six rows of data—that is, the Cartesian product—that includes every combination of the results of the SELECT statements.
Figure 8-31. Cartesian product
You can get the same result with CROSS JOIN as you can with CROSS APPLY and OUTER APPLY. Figure 8-32 shows a query that is equivalent to the one in Figure 8-31. The CROSS JOIN (1) replaces the CROSS APPLY.
Figure 8-32. JOIN cartesian product

It is pretty rare that you would want the Cartesian product, and if you did, you would probably use CROSS JOIN, not CROSS APPLY; it is typically an intermediate result that is further reduced by the associated WHERE clause. There are some cases where this kind of result is useful, though, in particular if the expression on the right side always returns a single row or is dependent on the left side.
Figure 8-33 shows a query that uses CROSS APPLY (1) to find the least expensive book for each publisher in the pubs database. The left side is the publishers table in the pubs database. The right side of the CROSS APPLY is a subquery that depends on the pub_id (2) from the left side. The right side produces a row only if the publisher publishes at least one book. CROSS APPLY produces an output only when both sides are non-null, just as a CROSS JOIN does. Note that the query in Figure 8-33 would not work if CROSS JOIN were substituted for CROSS APPLY, because the right side makes a reference to the pub_id on the left side, and CROSS JOIN does not allow this.
Figure 8-33. CROSS APPLY
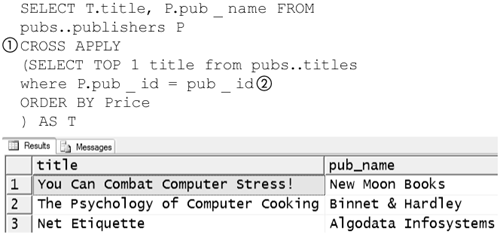
Note that when you are using the APPLY operator, the expression to the right of the operator can reference columns from the expression to the left of the operator, but the expression on the left of the operator may not reference columns from the right of the operator.
Figure 8-34 is the same query as that in Figure 8-33 except that it uses an OUTER APPLY (1) instead of CROSS APPLY. The OUTER APPLY, just like an OUTER JOIN, includes all rows produced with NULLs for the values of nonexistent rows.
Figure 8-34. OUTER APPLY

The right side of a CROSS or OUTER APPLY is a rowset, which in the previous example was produced by a subquery. The right side could, of course, have been a table-valued function. Figure 8-35 shows a table-valued function, LeastExpensiveTitle (1), that returns a single row that contains the least expensive title from the publisher specified by the @pub_id passed into it. This function is essentially the subquery that was used on the right side of the CROSS APPLY in Figure 8-33.
Figure 8-35. Using a table-valued function with CROSS APPLY
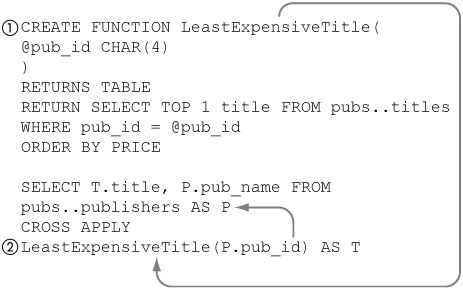
This function is used (2) on the right side of a CROSS APPLY. This query produces the same output as Figure 8-33. The nodes function, which is discussed in Chapter 10, is also a table-valued function and likewise will be used on the right side of a CROSS or OUTER APPLY.
Common Table Expressions
A common table expression (CTE) is an expression that is referred to by name within the context of a single query. CTEs are part of the SQL:1999 standard and extend the syntax of SELECT, INSERT, DELETE, and UPDATE statements by adding a preface to them that can define one or more common table expressions.
Figure 8-36 illustrates the general syntax for a CTE. The preface for a CTE is always introduced by a WITH keyword. The CTE must be the first statement in a batch or be preceded by a semicolon (;). Each CTE has a name used to reference the expression that makes up its body. A CTE may optionally name the columns returned by the expression in its body. Consecutive CTEs are separated by commas. The SQL expression that follows the last CTE makes references to the names of the CTEs that preceded it.
Figure 8-36. CTE syntax
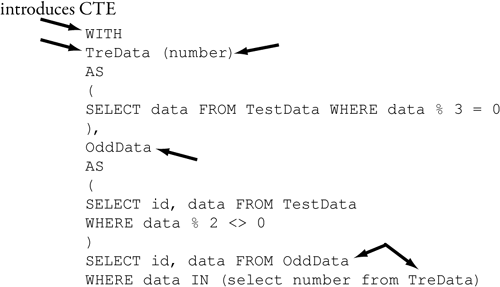
The syntax of a CTE makes it appear that it will build a temporary table for each CTE, and then the statements that reference the CTEs will use those tables. This is not the case. A CTE is an alternative syntax for a subquery. Figure 8-37 shows in effect how the statement in Figure 8-36 will be used. In other words, a CTE will be evaluated as a whole, just as any other SQL statement is, and an execution plan will be built for it as a whole. So any statement that contains subqueries can be converted to a CTE, and vice versa.
Figure 8-37. Expanded CTE
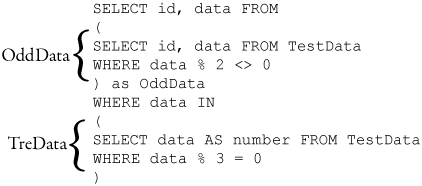
Figure 8-38 shows a SQL script with a trivial CTE just to give you a feeling for its usage. The WITH (1) clause in effect defines an expression named MathConst that has two columns (2) named PI and Avogadro. The body of the CTE is in parentheses (3) and contains a SELECT statement (3). The SELECT statement that follows the body of the CTE references (4) the Math-Const expression and returns the single row that it contains.
Figure 8-38. CTE usage

Figure 8-39 shows the subquery-based statement that is the equivalent of the CTE-based statement in Figure 8-38. The CTE referenced in Figure 8-38 is reduced to a subquery (1) in Figure 8-39.
Figure 8-39. Equivalent subquery

We will use the Sales.SalesPerson, Sales.SalesHeader, and Sales.SalesDetail tables from the AdventureWorks database to illustrate the use of CTEs. The SalesPerson table lists each salesperson who works for AdventureWorks. Each salesperson has a SalesPersonID that identifies him or her. A sales header is inserted into the SalesHeader for each sale that is made at AdventureWorks. The header includes the Sales-PersonID of the salesperson making the sale. A line item is inserted into the SalesDetail table for each product that was sold in that sale. The line item includes the ProductID of the product sold and the SalesHeaderID of the header to which it belongs.
The stock room has just called the Big Boss and told him that it is out of part number 744. The Big Boss calls you and wants you to make a report that lists the SalesPersonID of each salesperson. Also, the Big Boss wants the text “Make Call” listed along with the SalesPersonID if a salesperson made a sale that depends on part number 744 to be completed. Otherwise, he wants the text 'Relax' printed next to the salesperson’s ID.
Before we actually use the CTE, let’s write a query that finds all the IDs of salespeople who have sales that depend on part number 744. Figure 8-40 shows a query that finds all the SalesOrderHeaders that have at least one SalesOrderDetail for ProductID 744. This query could be used to make the report for the Big Boss.
Figure 8-40. Salesperson IDs for orders for ProductID 744

Figure 8-41 shows a statement that uses the query (1) from Figure 8-40 as a subquery to make the report the Big Boss wants. Notice that there is a subquery with a subquery. The outer one gets SalesOrderHeaders (1) provided that it contains a 744 ProductID (2) in one of its SalesOrderDetails. The CASE clause outputs 'Make Call!' if the SalesPersonID is in one of the SalesOrderHeaders that contain ProductID 744.
Figure 8-41. Big Boss report using subquery
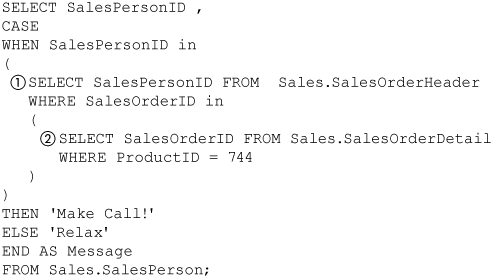
Figure 8-42 shows using a CTE to implement a query equivalent to the one in Figure 8-41 and the output it produces. The DetailsFor744 (1) CTE is an expression that finds all the SalesOrderIDs that contain a ProductID of 744 in their SalesOrderDetails.
Figure 8-42. Report for Big Boss using a CTE
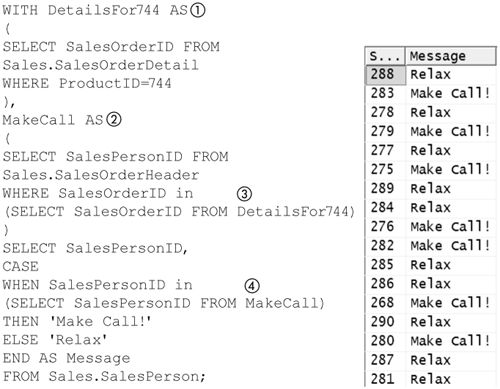
The MakeCall (2) CTE makes reference to the DetailsFor744 (3) CTE. Note that a CTE can always make a reference to a preceding CTE in the same expression. It finds the SalesPersonIDs from SalesOrderHeaders that have a ProductID of 744 in their SalesOrderDetails.
The SELECT statement that follows the last CTE makes a reference to the MakeCall (4) CTE to distinguish the salespeople who have orders depending on ProductID 744.
As you can see in this case, the CTE is just an alternative syntax for a derived table and, in this case, a more verbose one. In fact, you might find the query in Figure 8-41 easier to read than the one in Figure 8-42. But both have the same query plan.
But let’s make things more interesting. Just as you finish the query for the Big Boss’s report, you get another call. The Big Boss wants something a bit different. He says he doesn’t want any salespeople wasting time making extra phone calls if all their orders that use part 744 have a value less than the average value of all the orders that depend on part 744. He says he wants the salespeople to make a call only if they have an “expensive” order.
There are many ways to make this “expensive” report, but Figure 8-43 shows a way to do it with several subqueries. It starts in a way similar to the preceding queries in that it uses a subquery (1) to find all the SalesOrder-Headers that depend on ProductID 744. This has to be qualified further by calculating the value of the order (2), which is the sum of the extended price—that is, units times cost—for all the SalesOrderDetail rows associated with that SalesOrderHeader.
Figure 8-43. Expensive orders using subquery
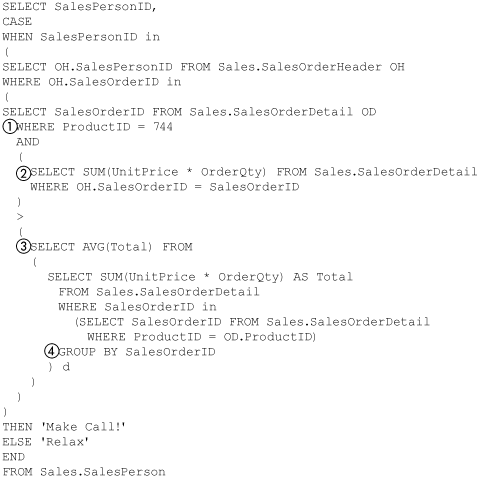
The value of the order has to be greater than the average value of all the orders that depend on ProductID 744. Average value is calculated (3) by averaging the total value of the orders that depend on ProductID 744 when grouped by (4) the SalesOrderID. Whew!
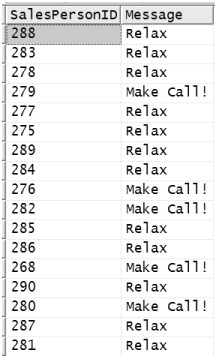
Figure 8-44 shows the result of running the query shown in Figure 8-43. Note that two fewer salespeople have to make calls. What we are going to do next is repeat this query, but we’ll use a CTE instead and see whether it is anything more than a syntactic difference.
Figure 8-44. Expensive order report
The query in Figure 8-45 is the equivalent of that in Figure 8-43 except that it uses CTEs to do the subqueries. The OrdersFor744 (1) CTE finds the SalesOrderIDs for the orders that depend on part 744. The Order-TotalsFor744 (2) CTE uses the GROUP BY SalesOrderID to calculate the value of each of the orders found by the OrdersFor744 CTE. The AvgOrdersFor744 CTE (3) finds the overall average of the totals found by the OrderTotalsFor744 CTE.
Figure 8-45. Expensive orders using CTE

The AboveAvgOrdersFor744 (4) CTE finds the orders whose total is greater than the overall average of the orders that depended on part 744.
Note that the CROSS APPLY operator is used here, because AvgOrdersFor744 returns only a single row, and it is used to do a magnitude comparison.
The MakeCall (5) CTE gets the SalesOrderIDs for all the above-average orders from the AboveAvgOrderFor744 CTE. The final expression works the same way as the one in Figure 8-42, but this time, the MakeCall CTE returns a different set of SalesPersonIDs.
Comparing the query in Figure 8-45 with the one in Figure 8-43, you will see that the one in Figure 8-45 is a bit more verbose. Some might find following the query in Figure 8-45 easier because each subquery has a name, but if you are used to writing subqueries, that might not be the case. There is more to this comparison than syntax, however.
If you run both queries in the same batch and look at the actual execution plan for them, you will see that the CTE-based query (1) in Figure 8-45 is about one-fifth the cost of the subquery-based query (2) in Figure 8-43 as shown in Figure 8-46, with the database as configured as installed. If you use the database engine tuning advisor and add the indexes it recommends for these queries, the CTE-based query will be about one-ninth the cost of the subquery-based one. In either case, the CTE-based query costs noticeably less. Like any performance metric, of course, this has to be tested in your actual usage environment to see which is better suited to your needs.
Figure 8-46. Execution plan comparison

The reason for this is that the CTE gives the query engine more information. The subquery-based query doesn’t realize that the calculation of the average value of the order needs to be run only once and runs it once per row. With the CTE-based query, it is easy for the query engine to see that it needs to calculate this aggregate only once.
If you had to make this report in a version of SQL Server before SQL Server 2005, you probably would have calculated the average value into a variable and then used that, rather than letting the query engine calculate it once per row. What you lose by doing this is composability. The CTE-based query can be used to define a view or an inline table-valued function, and the solution that declares a variable cannot.
Recursive Queries
The CTE is the basis of another feature of SQL Server 2005 that is also part of the SQL:1999 standard: a recursive query. This is especially useful for a chart of accounts in an accounting system or a parts explosion in a bill of materials. Both of these involve tree-structured data. In general, a recursive query is useful any time tree-structured data is involved. We will start by looking at an example of a chart of accounts to see how recursive queries work.
Figure 8-47 shows a diagram of a simple chart of accounts containing two kinds of accounts: detail accounts and rollup accounts. Detail accounts have an actual balance associated with them; when a posting is made to an accounting system, it is posted to detail accounts. In Figure 8-47, account 4001 is a detail account that has a balance of $12.
Figure 8-47. Chart of accounts

Rollup accounts are used to summarize the totals of detail accounts that descend from them. Every account, except for the root account, has a parent. The total of a rollup account is the sum of the detail accounts that descend from it. In Figure 8-47, account 3002 is a rollup account, and it represents the sum of its two children: accounts 4001 and 4002. Rollup account 2001 represents the total of detail accounts 3001, 4001, and 4002.
One of the ways to represent a chart of accounts is to have two tables: one for detail accounts and the other for rollup accounts. A detail account has an account number, a parent account number, and a balance for columns. A rollup account has an account number and a parent but no balance associated with it.
A SQL batch that builds and populates the two tables for the accounts is shown in Figure 8-48. Note that referential integrity is not included just for simplicity.
Figure 8-48. Building a chart of accounts
CREATE TABLE DetailAccount(
id INT PRIMARY KEY,
parent INT,
balance FLOAT)
CREATE TABLE RollupAccount(
id INT PRIMARY KEY,
parent INT)
INSERT INTO DetailAccount VALUES (3001, 2001, 10)
INSERT INTO DetailAccount VALUES(4001, 3002, 12)
INSERT INTO DetailAccount VALUES(4002, 3002, 14)
INSERT INTO DetailAccount VALUES(3004, 2002, 17)
INSERT INTO DetailAccount VALUES(3005, 2002, 10)
INSERT INTO DetailAccount VALUES(3006, 2002, 25)
INSERT INTO DetailAccount VALUES(3007, 2003, 7)
INSERT INTO DetailAccount VALUES(3008, 2003, 9)
INSERT INTO RollupAccount VALUES(3002, 2001)
INSERT INTO RollupAccount VALUES(2001, 1000)
INSERT INTO RollupAccount VALUES(2002, 1000)
INSERT INTO RollupAccount VALUES(2003, 1000)
INSERT INTO RollupAccount VALUES(1000, NULL)
One question you might ask of a chart of accounts is “What is the balance of account xxxx?”, where “xxxx” is an account number. For example, “What is the balance of account 1000?” Note that because 1000 is the root of all the accounts, we could just add up all the detail accounts, but we will do this using a recursive query and then build on it to find the balance of any account.
In a typical recursive query, there are three parts: an anchor, which initializes the recursion; a recursion member; and a final query. Figure 8-49 shows a recursive query named Rollup that calculates the balance of account 1000. A recursive query is a CTE that includes a UNION ALL (2) operator. The statement that precedes the UNION ALL operator is the anchor (1) and is executed just once.
Figure 8-49. Account 1000 balance
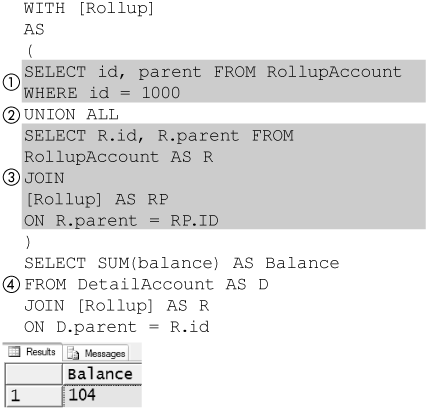
The statement that follows the UNION ALL operator is the recursion (3) query. It joins the CTE itself—that is, joins Rollup. It always joins the result of the previous query until it produces no results. Note that the term rollup is a bit overloaded. T-SQL supports a ROLLUP option on GROUP BY clauses. Here, we are discussing rollup in the bookkeeping sense that it is used in a chart of accounts as shown in Figure 8-47, not the ROLLUP option for a GROUP BY clause.
The statement that follows the CTE is the final query (4). It also uses the CTE—that is, Rollup—to produce its result. In the final query, the CTE contains all the results produced by the initialization query and every recursion query. In the case of this example, it contains the IDs of all the rollup accounts, so this query sums all accounts.
The calculation done in Figure 8-49 can be thought of as being done in phases, as is shown in Figure 8-50. The first phase is the initialization (1) by execution of the anchor. In this example, it produces a single row from the RollupAccount table: the row with account 1000.
Figure 8-50. Phases of calculation

The second phase is produced the first time the recursion member is executed (2). It selects all the child accounts of account 1000 by joining the RollupAccount table with the results of the first phase using a parent–child relationship.
Because the second phase produced results, the recursion member is executed (3) again, but this time, the RollupAccount table is joined with the results of the second phase (2) to produce all the children of the rows produced by the second phase.
An attempt is made to execute the recursion query one more time. The RollupAccountTable is joined with the single row produced by the second phase. There are no rows in the RollupAccountTable that contain 3000 in their parent column, so this join produces no results. This is sometimes called the fix point, as subsequently executing the recursion query will produce no different results. This terminates the recursion phase.
The final query (4) executes when the recursion phases have terminated. It joins the DetailAccount table to all the results produced by all the first three phases—that is, the initialization and recursion phases—using a parent–child relationship.
In summary, the recursive member always joins with only the results of the previous query, which is either the anchor or a recursion member. The final query joins the results of all the preceding phases.
Figure 8-49 shows the basic syntax and usage of a recursive query. It is a CTE with two statements separated by a UNION ALL operator. The statement before the UNION ALL operator is executed once, and the statement after the UNION ALL is executed repeatedly, joined against the results of the previous statement execution, until it produces no more rows. Finally, the statement that follows the CTE is joined against all the results produced recursively by the CTE.
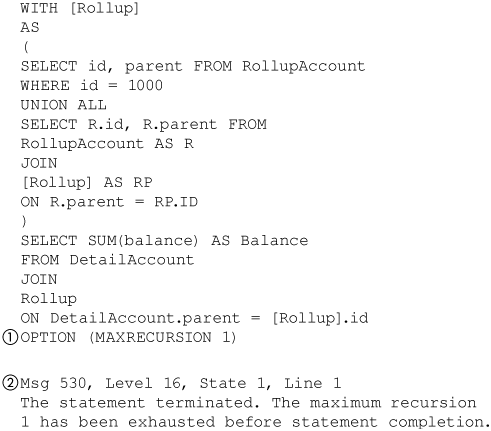
It is possible to design a recursive query that would repeatedly execute the recursion member a large or infinite number of times. You can limit this in two ways. First, by default SQL Server 2005 will limit it to 100 recursions. You can change this limit by using the MAXRECURSION query hint, as shown in Figure 8-51. The example shown in Figure 8-51 uses (MAXRECURSION 1) to limit recursion to one. When (MAXRECURSION 0) is used, no recursion limit is imposed. Exceeding the recursion limit produces a 530 error (2).
Figure 8-51. MAXRECURSION
In some cases, you will want to limit the recursion but instead of producing an error just use the result obtained up to that point. Your CTE will have to keep track of the depth of recursion to do this. Figure 8-52 executes the recursion query just once. To do this, it adds a depth column (1) to the anchor query with a value of zero. It also adds a depth column to the recursion member and increments it by one (2) every time the recursion query is executed. Last, it does a test of the depth column (3) in the recursion query itself to decide when to terminate the recursion.
Figure 8-52. Limiting recursion

The examples of recursive queries shown so far are a bit limited because the anchor has had a literal id in it. A recursive query, however, like any CTE, can be part of an inline table-valued function so that the id for the anchor can be parameterized. There are several ways to do this, but one way that will get a reasonable amount of reuse is to make a table-valued function that produces a table with three columns.
In the case of the HumanResources.Employee table, one column would have the EmployeeID; the next, the ManagerID; and finally, a depth column that indicates the depth of the employee in the hierarchy. You pass an id into the function, and you get back a tree with the employee whose id you passed at the root. You can’t actually return a tree, of course; you can return only a table. But the table includes all the members of the tree.
Figure 8-53 shows an inline table-valued function that does this for the HumanResources.Employee table in the AdventureWorks sample database. You pass in the id for an employee, and it returns the row for that employee, all the employees who have that id as a parent, and so on. The AWEmpTree table returns a table (1), and that table contains (3) an EmployeeID with its ManagerID and depth in the tree. Note that the recursion member joins with the Rollup CTE (2) where the EmployeeID of the Rollup CTE equals the ManagerID of the employee.
Figure 8-53. Tree rollup function

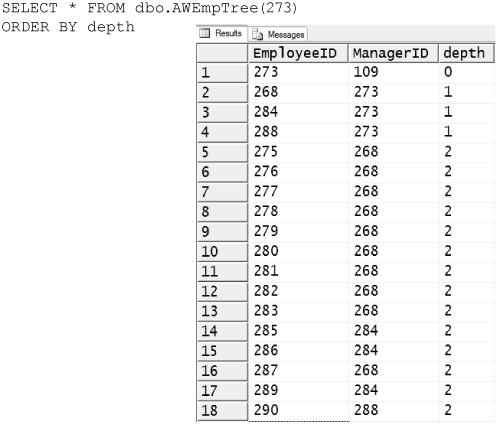
Figure 8-54 shows the AWEmpTree function from Figure 8-53 used to find all the employees who report to employee 273. You can see that employee 273 is at the root of the tree because that employee has a depth of zero. You can also see that employees 268, 284, and 288 directly report to employee 273 and have a depth of one. The rest indirectly report to employee 273 and have a depth as appropriate.
Figure 8-54. Rollup for employee 273
Besides being able to roll up an entity with its descendents, it is useful to find the ancestors of an entity. A recursive query can be used to do this, too. Figure 8-55 shows an AWEmpAncestors function that is the complement of the AWEmpTree function. This is done simply by reversing the parent-child relationship (1) that is used in the join in the AWEmpTree function.
Figure 8-55. Ancestor function
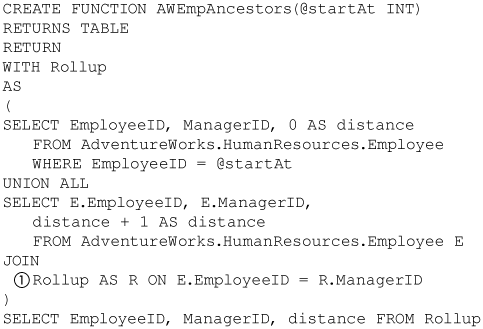
Figure 8-56 shows the results of using the AWEmpAncestors function from Figure 8-55.
Figure 8-56. Employee ancestors

When you have tree and ancestor inline table-valued functions, you can use them in other queries to answer the typical kinds of questions made of trees. Figure 8-57 shows a query that lists all the direct reports (1) for employee 140. The other query counts the number of employees (2) who report to employee 140.
Figure 8-57. Using tree functions

PIVOT and UNPIVOT Operators
SQL Server 2005 adds the PIVOT operator to T-SQL, so named because it can create a new table by swapping the rows and columns of an existing table. In general, the PIVOT operator is used to create an analytical view of some data.
Pivot
A typical analytical use of the PIVOT operator is to convert temporal data to categorized data so as to make the data easier to analyze. Consider a table used to record each sale made as it occurs; each row represents a single sale and includes the quarter that indicates when it occurred. This sort of view makes sense for recording sales but is not easy to use if you want to compare sales made in the same quarter, year over year.
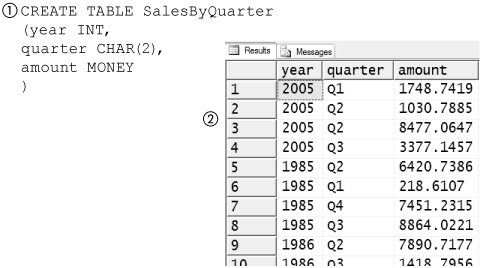
Figure 8-58 shows the SalesByQuarter table (1) and a sample of some of the entries in it. Each sale is recorded as the amount of the sale, the year, and the quarter in which the sale was made. Notice that it shows two of the sales (2) made in Q2 of 2005.
Figure 8-58. Sales recorded as entered
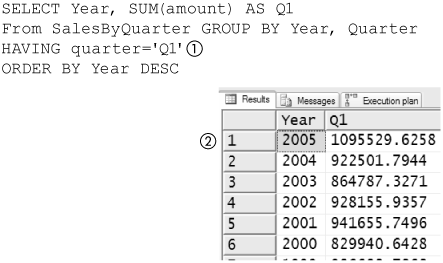
You might want to analyze this data to see changes in total sales between Q1 quarters in two different years. Figure 8-59 shows an aggregate calculation of the sum of amounts (2) in the SalesByQuarter table for each year for Q1. Note that only sales having a quarter of Q1 (1) are aggregated. This is a good start, because it makes it easy to see that sales in Q1 of 2005 were better than in Q1 of 2004.
Figure 8-59. Q1 results, year over year
But we really need three more columns; we would like results for Q1, Q2, Q3, and Q4 in the same table. In Figure 8-60, the SELECT (3) statement groups the sum of the sales in a quarter (2) with its corresponding year (3).
Figure 8-60. Query for quarterly results
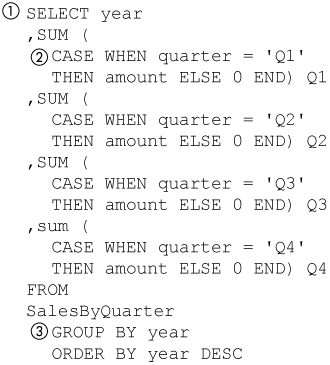
Figure 8-61 shows the results of running the query in Figure 8-60. Now we can compare any quarterly results year over year. The query in Figure 8-60 is a bit complicated. The PIVOT operator is a much easier and more efficient way to get the same results.
Figure 8-61. All quarterly results

Figure 8-62 shows a query that produces the same results as the query in Figure 8-60. It selects all the columns (1) from the SalesByQuarter table.
Figure 8-62. PIVOT operator
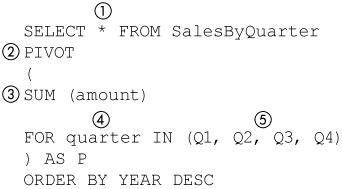
It applies the PIVOT operator (2) to the result of the SELECT statement. The PIVOT operator is always followed by an aliased clause in parentheses.
The first part of the clause is always an aggregate function (3)—in this example, SUM—on one of the columns produced by the SELECT statement. Note that in the general case, an aggregate function can have an expression as a parameter, but when it is used in the clause that follows the PIVOT operator, the parameter can be only the literal name of one of the columns produced by the SELECT statement.
The aggregate function is always followed by a FOR/IN clause. Immediately following the FOR term of the clause is the literal name of one of the columns produced by the SELECT statement. This is the column to be pivoted (4)—that is, the unique values in the column are to become the column headings of the result produced by the PIVOT operator.
Following the name of the column to be pivoted is a comma-separated list of values enclosed in parentheses (5). These values are the column heading names that the PIVOT operator will produce and also correspond to values, cast as strings, from the column to be pivoted (4).
Last, the PIVOT operator in effect adds a GROUP BY clause that includes all the columns produced by the SELECT statement except the column named in the aggregate function and the column being pivoted. In this example, year is the only column not used by the PIVOT operator.
The syntax for PIVOT is a bit compact, but it is in effect doing what the query in Figure 8-60 does. Figure 8-63 compares the syntax of a PIVOT operator with the hand-built query shown in Figure 8-60.
Figure 8-63. PIVOT comparison with hand-built query
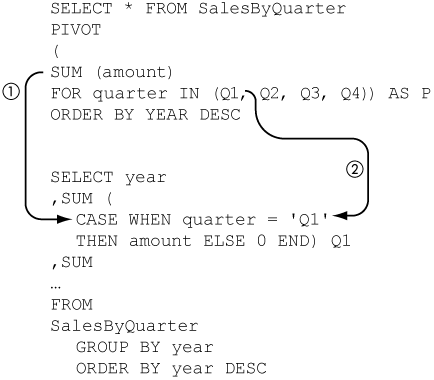
The Q1 value listed in the FOR/IN clause produces a column (2) of output, as do Q2, Q3, and Q4. The aggregate (1)—SUM, in this case—is applied to the amount only if the amount comes from a row that corresponds to a particular quarter.
The table used in the preceding example didn’t have a primary key or even anything that might be used as a primary key, which makes it a rather unlikely table to find in a relational database. Let’s look at what happens if we make a new table, SalesByQuarterId (1), by adding an identity column to the original table, as shown in Figure 8-64. In real life, this id column could be the sales order number that would be used to identify the order.
Figure 8-64. PIVOT with id
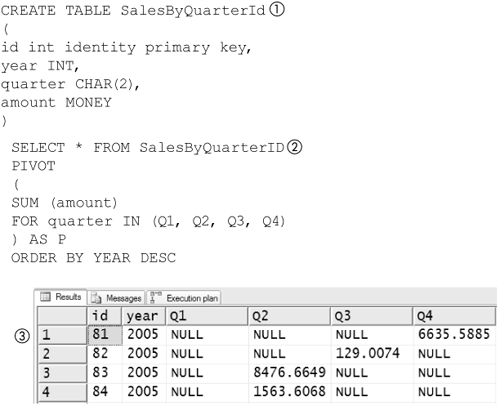
If we use the PIVOT operator on this new table (2) the same way we did on the previous table, the results produced (3) are not all that useful. The problem is that the id is not used in the SUM aggregate function, of course, so it is added to the GROUP BY clause in all subqueries. This results in one row for each row in the SalesByQuarterId table—something that is not all that useful. What you would like to do is ignore the id column in the SalesByQuarterId table.
The net effect of the * in the SELECT statement that precedes the PIVOT operator is shown in Figure 8-65. It is expanded by adding all the columns from the table that are not mentioned in the aggregate or the FOR clause (1) and all the values (2) from the IN clause as column names. You can literally type these column names yourself and not use the * if you want to, but if you don’t include the id column, you will get a syntax error, so that will not improve on the results shown in Figure 8-64.
Figure 8-65. Expanded PIVOT

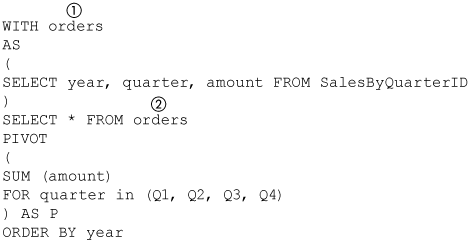
You must remove the id column, and the way to do that is with a subquery. Figure 8-66 shows a CTE (1) used to make a subquery that removes the id column. The CTE is referenced (2) in the PIVOT expression. Given that SalesByQuarter and SalesByQuarterID have the same data in them, the query in Figure 8-66 produces the same results as the query in Figure 8-62.
Figure 8-66. PIVOT with extra columns
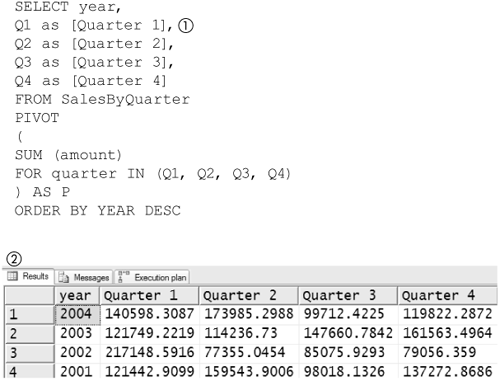
There is one last thing you might like to do when using the PIVOT operator; you might want to rename the columns. You might want the column name for Q1 to be Quarter 1, for example. Figure 8-67 shows how to do this. You expand the * in the SELECT that uses the PIVOT operator, as was shown in Figure 8-66 and alias the values (1) from the IN clause. The output produced by this PIVOT (2) is also shown in Figure 8-67. If the table had a primary key in it, as SalesByQuarterID did, of course you would have to use a CTE or derived table to remove that column.
Figure 8-67. PIVOT with headings
Unpivot
The UNPIVOT operator is complementary in operation to the PIVOT operator in that it tries to undo what the PIVOT operator did. It is not complementary in the sense that it completely reverses the effect of the PIVOT operator. It can’t do that; an aggregated value cannot be broken into its constituent parts. What it does is take column headings and turn them into values in a single column.
Figure 8-68 shows a table variable, @pivoted (1), that is filled by pivoting SalesByQuarter as was done in previous examples. The contents of the @pivoted table are the same as those shown in Figure 8-61. This table is used to illustrate how the UNPIVOT operator works.
Figure 8-68. UNPIVOT operator
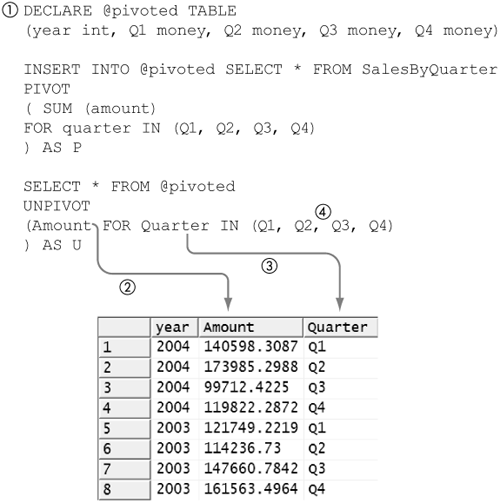
The UNPIVOT clause follows a SELECT statement, just as the PIVOT clause does. The body of the UNPIVOT clause is in parentheses and contains a FOR/IN phrase, just as the PIVOT clause does. An UNPIVOT operator does not contain an aggregate function, however.
The UNPIVOT operator produces a table with all the columns of the input table except the columns mentioned in parentheses (4) to the right of the IN phrase. It adds two columns to this: one whose name is the name to the left (2) of the FOR phrase, and the other whose name is to the right (3) of the FOR phrase. In the example shown in Figure 8-68, these are the Amount and Quarter columns, respectively.
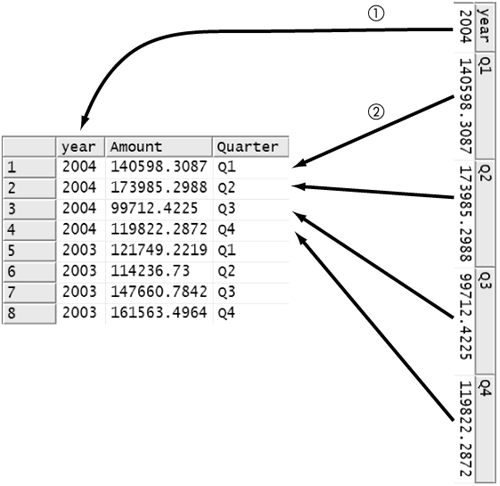
Figure 8-69 illustrates the effect of the UNPIVOT operator on a single row of the @pivoted table. The year (1) is repeated once for each of the other columns in the @pivoted table into rows in the output table. The column heading is copied (1) into the Quarter column of the output table, and the value in that column is copied into the Amount column. The net effect is to put all the non-null values aggregated by the PIVOT operator into a single column, each tagged with the name of its source column.
Figure 8-69. UNPIVOTing a row
Ranking and Partitioning
SQL Server 2005 adds support for the SQL:1999 standard ranking functions and partitioning operations. Ranking functions in effect add a numeric column to the output of a query that represents the rank a row would have when sorted according to some criterion. Partitioning is used to apply ranking operations or aggregate functions to subsets of a table produced by partitioning it in a way that is similar to the use of GROUP BY to apply aggregate functions to subsets of a table. The ranking functions are ROW_NUMBER, RANK, DENSE_RANK, and NTILE; all require an OVER clause following them.
The ROW_NUMBER function is one of the most straightforward to look at. The rank it assigns to a row is the position that the row would hold according to a specified sorting criterion. Figure 8-70 shows ROW_NUMBER being used to find the position of a row from the SalesOrderDetail table from AdventureWorks database if it were sorted by its ProductID column.
Figure 8-70. ROW_NUMBER function

The ROW_NUMBER function (1), like all ranking functions, is always followed by an OVER (2) clause. The OVER clause must contain an ORDER BY phrase when used with the ROW_NUMBER or any ranking function. The ORDER BY phrase is followed by a comma-separated list of column names, as it would be if it were being used to sort a SELECT statement.
ROW_NUMBER
The ROW_NUMBER function, in the example in Figure 8-70, produces (4) the position the row would fall in if the overall expression were ordered by the ProductID column. Note that in this example, the overall expression is ordered by the SalesOrderDetailID column. This is done to illustrate that the ORDER BY phrase used in an OVER clause is evaluated independently of any other ORDER BY phrase used in another OVER clause or used to sort the overall results of a query.
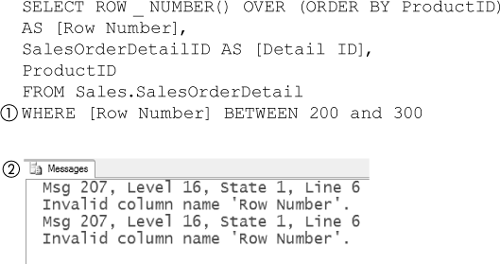
The ranking functions produce a column of output and may be aliased, as shown in Figure 8-70. The alias may not be referred to from a predicate in the expression. The alias maybe referred to from an ORDER BY clause for the overall query, however. Figure 8-71 shows an attempt to select the rows from the query in Figure 8-70 that are between 200 and 300. It does this by making a reference to the [Row Number] alias. This produces a 207 error (2).
Figure 8-71. Referencing a ROW_NUMBER directly
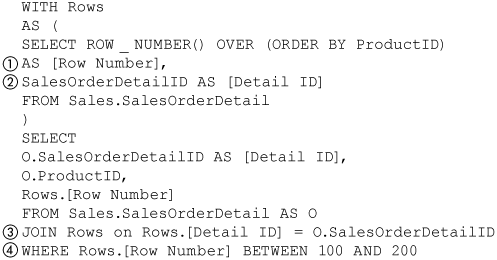
An alias of a ranking function may be referenced only through a subquery. Figure 8-72 shows a row number being referenced via a subquery. A CTE named Rows contains the subquery. The Rows CTE selects both the row number (1) aliased as [Row Number], and the primary key (2)—that is, the SalesOrderDetailID column—from the SalesOrderDetail table. The SELECT that follows the CTE joins the CTE itself with the SalesOrderDetail table on its primary key (3). It adds a predicate (4) that can reference the row number via the CTE so that it can be used as part of the BETWEEN clause. Note that using the ROW_NUMBER function typically produces a more performant result than other techniques that might be used for this purpose.
Figure 8-72. Referencing a ROW_NUMBER via subquery
Rank
The ROW_NUMBER function always gives each row a different rank. The RANK gives each row a rank according to a criterion that you specify. If that criterion produces the same result for two rows, however, those rows will be given the same rank.
The SalesOrderHeader table of the AdventureWorks database has a DueDate column that represents the day by which an order must be shipped. If these rows are ranked by shipping priority, two rows that have the same DueDate could be given the same shipping priority, because there would be about the same amount of time available to finish putting together the order. And when two rows have different DueDate values, the one with the later DueDate would have a lower shipping priority, because there would be more time to get that order together.
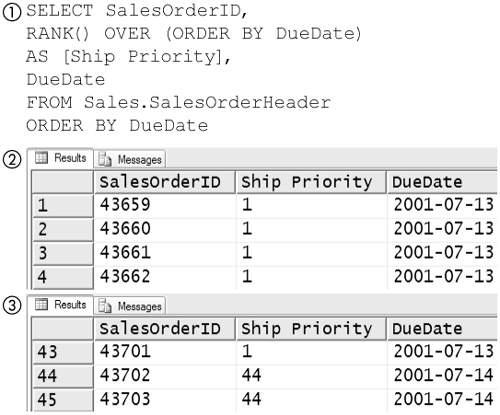
Figure 8-73 shows a query (1) that prioritizes orders in the SalesOrderHeaderTable. The RANK function is used to rank rows in order of their DueDate, with the lowest number [Ship Priority] being the most important. The first two rows of output (1) have the same DueDate and in fact have the same priority—that is, 1. Examining the 43rd and 44th rows (3) shows that they have different DueDates and in fact have different [Ship Priority]s, with the later DueDate having a higher number.
Figure 8-73. Shipping priority
DENSE_RANK
The RANK function does not guarantee that it will produce contiguous numbers—only that the numbers will be the same when the sort criterion produces the same result. If the sort criterion produces different results, the row that would be later in the sort will have a higher number. The DENSE_RANK function produces the same results as the RANK function except that it adds the additional guarantee that the numbers it produces are contiguous. Figure 8-74 shows a query (1) that is the same as the one in Figure 8-73 except that it uses DENSE_RANK instead of RANK. Examining the results (2) shows that the numbers produced by DENSE_RANK are contiguous. Keep in mind that there is more overhead in using the DENSE_RANK function than the RANK function.
Figure 8-74. DENSE_RANK

Ntile
Another way to rank results is in sets of approximately equal size. You might want to break a table into ten sets of rows such that none of the rows in the second set will sort before any row in the first set, and so on. Each of these sets is called a tile.
The query (1) in Figure 8-75 uses the NTILE function to break the SalesOrderHeader table into 5,000 tiles. The SalesOrderHeader sample database in this example has about 32,000 rows in it. Each tile should then have about six rows in it. NTILE does not guarantee that each tile will have exactly the same number of rows in it—only that they will have approximately the same number of rows. The results (2) of the query show that the first tile has seven rows (3) in it.
Figure 8-75. NTILE
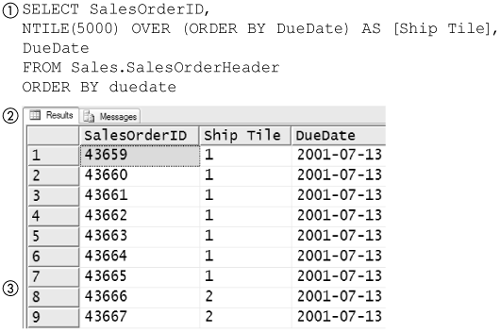
Also, NTILE guarantees only that items in a higher-numbered tile will not sort before items in a lower-numbered tile. Items in two consecutive tiles might sort in the same position.
The criterion used for the ranking function examples shown so far has used a column name in the ORDER BY clause. The ORDER BY clause, however, can use an expression or even a subquery.
Figure 8-76 shows a query that ranks a row from the SalesOrder-Header table from the AdventureWorks database according to the number of line items it contains. The line items are contained in the SalesOrderDetail table and use a foreign key that relates it to the SalesOrderID column of the SalesOrderHeader table. The DENSE_RANK function is used, and its ORDER BY clause uses a subquery (1) as the criterion for ranking. This subquery returns a single scalar that is the number of line items associated with a row from the SalesOrderHeader table. The result is that all SalesOrderHeaders that have the same number of line items have the same [Line Item Rank].
Figure 8-76. DENSE_RANK via subquery
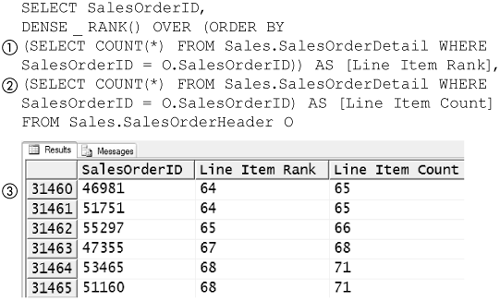
The query in Figure 8-76 includes the actual Line Item Count (2) for reference. The results (3) show that SalesOrderIDs with the same number of line items do, in fact, have the same Line Item Rank.
Partition By
The ranking functions can be applied on a by-partition basis. Each partition in effect restarts the ranking process.
Figure 8-77 shows a query that calculates a row number on the SalesOrderDetail table that is partitioned by the SalesOrderID. The calculation of the row number is based on the LineTotal column of the SalesOrderDetail table. This means that the row number will restart at one for each sales order.
Figure 8-77. Ranking within an order
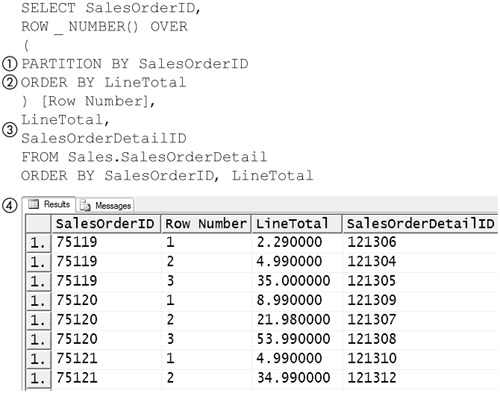
The PARTITION BY clause, when it is used, must precede the ORDER BY clause. This means that the row number is calculated as though each set of rows that has the same SalesOrderID were a separate table. Note that any of the ranking functions could have been used where ROW_NUMBER was used.
The PARTITION BY (1) clause in Figure 8-77 selects the SalesOrderID column to partition the table. The ORDER BY (2) clause specifies that the row number should be calculated based on the value of the LineTotal Column. The LineTotal and SalesOrderDetailID are included in the results for reference only, to show that the row number is being calculated as expected.
The results (4) in Figure 8-77 show that the row numbers for SalesOrderID 75119 start at one. Likewise, the row numbers for SalesOrderID 75120 start at one, and so on for the rest of the SalesOrderIDs. In other words, the SalesOrderDetail table was partitioned by its SalesOrderID column, and then the row numbers were calculated for each partition independently of the other partitions.
Aggregate Partitions
Aggregate functions, including user-defined aggregate functions (see Chapter 5), can be applied to partitions of a table by following the aggregate function with an OVER clause, similar to the way that it is used for a ranking function. The results it produces can be the same as those produced by a GROUP BY clause, but as we will see, aggregate partitions are a bit more flexible and may provide a different execution plan. When an OVER clause follows an aggregate function, it may not contain an ORDER BY clause.
Figure 8-78 shows a query that calculates a sum across partitions. It uses the SUM aggregate function (1) over partitions (2) based on the value in the SalesOrderID column. The SalesOrderID column is included for reference only, so the effect of the partitioned sums can be seen. Note that all the SalesOrderDetailIDs from SalesOrderID 75115 have the same Total. In other words, the Total column represents the sum of the LineTotals for all the rows of the SalesOrderDetailIDs whose SalesOrderID column is 75115.
Figure 8-78. Sum across partitions
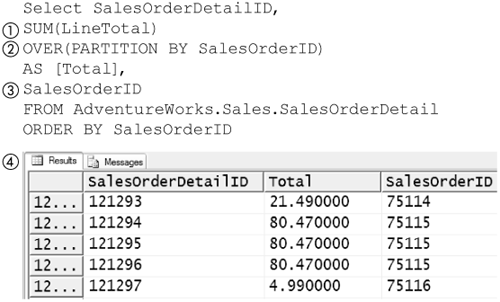
Aggregate functions used with an OVER clause provide functionality similar to that provided by GROUP BY and in fact can be used to yield the same results. Figure 8-79 shows two queries that produce the same results. The first query (1) uses the SUM aggregate function with an OVER clause, and the second (3) uses it with a GROUP BY clause. Note that the first query must use the DISTINCT phrase to get the same result as the second query. Also note that the second query has a significantly better execution plan (4) than the execution plan (2) for the first query. As with any performance metric, you must evaluate these queries in the context of your own applications to decide which is the better choice for your purposes.
Figure 8-79. PARTITION/GROUP BY comparison

Another difference between the OVER clause and the GROUP BY clause is that the OVER clause has no restrictions on what columns may be specified in the query, unlike the GROUP BY clause, which limits columns to those listed in the GROUP BY expression itself or as a parameter of an aggregate functions. Figure 8-80 shows a query that specifies a column (1) that is not used by the aggregate function (2) or in the PARTITION BY clause. The results (3) repeat some values.
Figure 8-80. No column restrictions with OVER
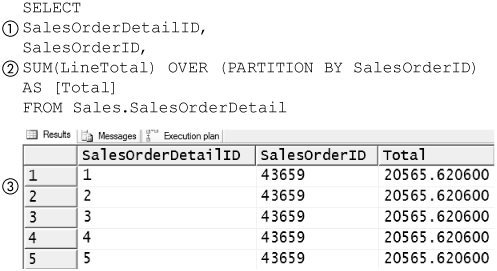
Aggregate calculations may be made over different partitions in a single query. Note that when GROUP BY is used, there can be only a single group. Figure 8-81 shows a query that does a SUM (1) partitioned over SalesOrderID and a COUNT (2) partitioned over ProductID. The results (3) show that the sum of all the LineTotals for the rows from the SalesOrderDetail table that have the same SalesOrderID as that for SalesOrderDetailID 119037 is 27.77. It also shows that the ProductID used by SalesOrderDetail 119037 appears in 1,044 rows of the SalesOrderDetail table.
Figure 8-81. Multiple partitions
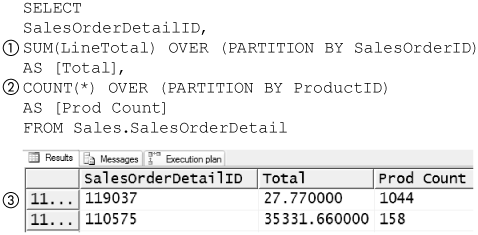
Tablesample
Sometimes, you have a very large table and want some information from it that is approximate in nature. An example of this would be the average price of a line item in a purchase order or the average number of line items in a purchase order. There is no need to incur the overhead of reading all the rows in the table just to get an approximate value. The TABLESAMPLE clause in a SELECT statement lets you randomly sample a set of rows to be processed.
Figure 8-82 shows a query that calculates the approximate average value of a line item from an order in the AdventureWorks sample database. The AVG aggregate function is used with extended price of a line item (1)—that is, unit price times the quantity—as its parameter. The TABLESAMPLE clause (2) always immediately follows a table name.
Figure 8-82. Approximate calculation

The SYSTEM phrase is optional and comes before the percentage, in parentheses, of the table that is to be sampled. The SYSTEM phrase specifies that the sampling algorithm that TABLESAMPLE uses is a proprietary one implemented by SQL Server 2005. The SQL:1999 standard lists some standard sampling algorithms that can be specified, but SYSTEM is the only one supported by SQL Server 2005.
Two different results of running the query are shown in Figure 8-82. Note that one run (3) yielded 1010.746, and the other (4) yielded 835.8079. This is due to the nature of the sampling algorithm. Sampling 10 percent of a table means that the probability that a given page of a table—that is, of the pages SQL Server uses to store the information in the table—will be used in the calculation is 10 percent. Each page is sampled anew each time the query is run.
This method of sampling has a number of implications. This first implication is that the results from two executions of a TABLESAMPLE may, as we have seen, be different. Each time the query is run, possibly a different set of pages will be sampled.
Another implication is that the number of rows used in the calculation can vary from run to run. TABLESAMPLE does not sample rows; it samples pages. The probability that a page will be used from run to run changes, and the number of rows contained in a page may also vary from page to page. Figure 8-83 shows a query that counts (1) the number of rows returned by TABLESAMPLE for two different (2) (3) executions of the query.
Figure 8-83. Row count variance
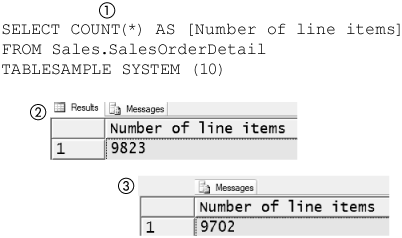
Because the selection of a page is probabilistic, there is always the possibility that either all or none of the pages that make up a table will be selected.
The chances of this happening go up as the table becomes smaller. Note that in general, TABLESAMPLE is not very useful for small tables.
TABLESAMPLE selects only pages, not rows, so it can be used only on physical tables, not derived tables, and the sampling is done before any predicate is evaluated in a query. Figure 8-84 shows an attempt to use TABLESAMPLE on a derived table, which cannot work because a derived table has no pages. The query uses a CTE (1) to make a subquery and then attempts to use a TABLESAMPLE clause on that CTE. This results in a 494 error (3).
Figure 8-84. TABLESAMPLE on derived table
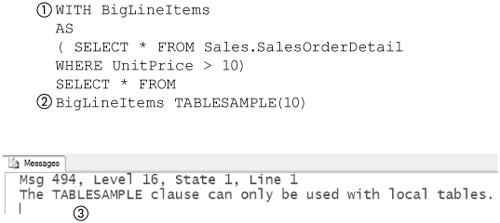
Figure 8-85 shows two queries that at first glance appear to be equivalent. One query (1) selects rows from the SalesOrderDetail table and counts them. The other query (3) self-joins the SalesOrderDetail table on its primary key; keep in mind that a self-join on the primary key essentially produces the original table. If TABLESAMPLE were not used, each of these queries would produce the same number of rows. The result (2) of the first query, however, is about ten times the size of the result (4) of the second query.
Figure 8-85. Count discrepancy
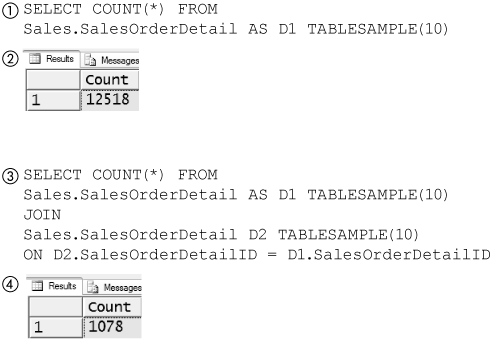
The pages used on the right side of the join are a different random selection from those on the left because TABLESAMPLE is used. The count produced by the second query (3) reflects the probability of the same page’s being selected in both the left and right random selection. Because the probability is 10 percent for each selection, the probability of the same page’s being selected on both sides of the join is 1 percent. This is one-tenth the probability of a page’s being used in the first query—hence, the approximately factor-of-ten difference in the results produced.
In general, a TABLESAMPLE used on both sides of a join can easily produce unexpected results.
The algorithm that TABLESAMPLE uses to sample pages is based on a pseudorandom sequence that you can control by using a REPEATABLE clause. The REPEATABLE clause is optional; it immediately follows the TABLESAMPLE and requires an integer parameter called the seed. It doesn’t really matter what the value of the seed is except that it must be greater than zero. The same sequence is produced when the same seed is used. The use of the REPEATABLE clause (1) is shown in Figure 8-86. Executing the query shown in Figure 8-86 twice (2) (3) produces the same results, unlike the similar query shown in Figure 8-82 that did not use a REPEATABLE clause. Note that this example assumes that the content of the SalesOrderDetail table does not change between executions of the query.
Figure 8-86. Repeatable TABLESAMPLE
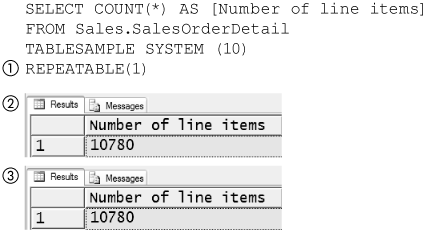
The TABLESAMPLE clause has optional unit phrases that can be included with its parameter. The default unit is specified by the PERCENT phrase following the quantity, somewhat as it is used in a TOP clause. The optional unit of rows is specified by a ROWS phrase following the quantity.
Figure 8-87 shows the usage of the unit specifications. The ROWS phrase is somewhat misleading. It does not sample the number of rows specified; it is used to calculate a percentage. The SalesOrderDetail table contains 121,317 rows (1), as shown in Figure 8-87. A query that asks for a TABLESAMPLE of 12,132 rows (2)—that is, about one-tenth of the rows in the SalesOrderDetail table—produces the same results as a query that asks for a TABLESAMPLE of 10 percent (3) of the SalesOrderDetail table. When the ROWS phrase is used, you are not guaranteed that the exact number (4) of rows specified will be used.
Figure 8-87. ROWS clause
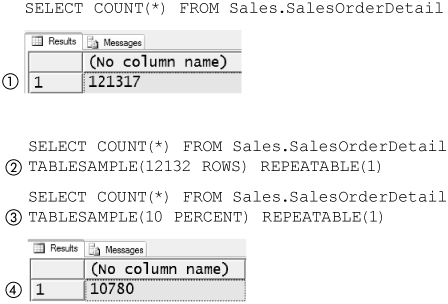
Note that the TABLESAMPLE queries in Figure 8-87 use a REPEATABLE clause to ensure that the same pages are sampled just illustrate how the ROWS phrase is interpreted.
Where Are We?
Even if the only thing you use in SQL Server is T-SQL itself, you will find many new features. Some of these new features add SQL:1999 standard syntax; some provide alternative representations for queries that may be easier to read and produce better execution plans; and some do both.
The BEGIN TRY clause is a more convenient way to handle errors; it allows more errors to be encapsulated within T-SQL and passed back to the client only if the needs of the application require it. The row numbering and partitioning capabilities make it possible to implement in a much more straightforward and efficient way than was previously possible. Common table expressions provide a cleaner syntax (your mileage may vary) and sometimes a more efficient way to use derived tables. OUTPUT lets us minimize the number of round trips needed to determine which rows were modified by a query.
All in all, the T-SQL enhancements in SQL Server 2005 represent another step in adding SQL:1999 compliance to T-SQL and give us more straightforward and efficient ways to manipulate data.
