
QuickSight is a serverless business intelligence service with a parallel in-memory processing engine (SPICE) for data visualization. We will use it to create a pivot table to understand usage and costs via the billing report generated.
- Use the console to find QuikSight, if this is the first time you use it you will need to sign up for the service:

- The next step is to create a new data set:

- For simplicity, use the option Upload a file and load the billing CSV. Confirm the changes for the file schema proposed. Click Next:

- Click Visualize for the data to be visualized:

- Use the Add (+) button on the top left part of the screen to incorporate new tiles and play around with the available fields. An example of a custom dashboard is shown in the following screenshot:
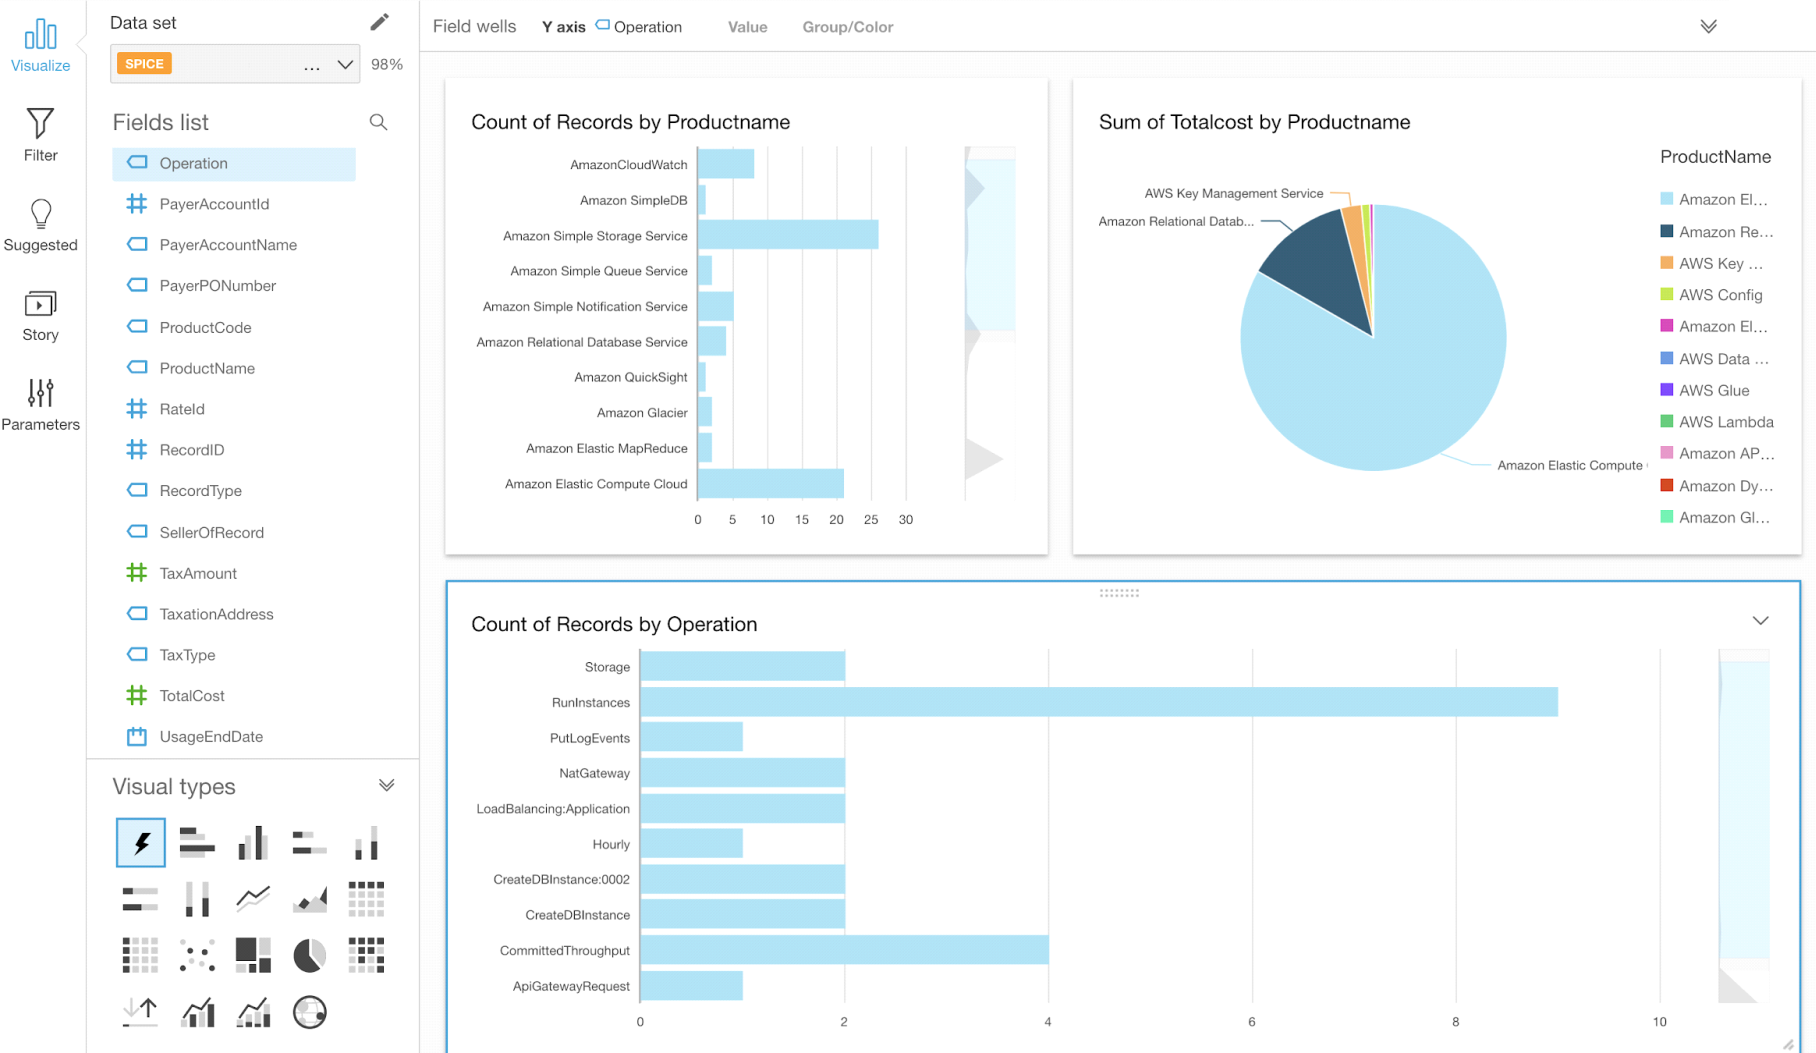
QuickSight gives finance users to understand spending with the ability to drill down into data and use different dimensions combinations to present this information to executives and create business reports.