
Chapter 13
Overhead Allocation Decisions
This chapter explains how accountants classify costs and determine the costs of products/services through differentiating product and period costs, and direct and indirect costs. The chapter emphasizes the overhead allocation problem: how indirect costs are allocated to determine products/service profitability and assist in pricing decisions. In doing so, it contrasts variable costing, absorption costing and activity-based costing. The chapter includes an overview of contingency theory, a comparison between Western and Japanese approaches to management accounting and a consideration of the behavioural consequences of accounting choices.
Cost classification
Product and period costs
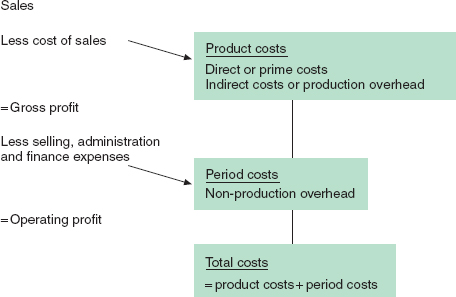
The first categorization of costs made by accountants is between period and product. Period costs relate to the accounting period (year, month). Product costs relate to the cost of goods (or services) produced. This distinction is particularly important to the link between management accounting and financial accounting, because the calculation of profit is based on the separation of product and period costs. However, the value given to inventory is based only on product costs, a requirement of accounting standards. The IFRS accounting standard on Inventories (see Chapter 6), IAS2, requires that the cost of stock should:
comprise that expenditure which has been incurred in the normal course of business in bringing the product or service to its present location and condition. Such costs will include all related production overheads.
Although Chapters 10, 11 and 12 introduced the concept of the contribution (sales less variable costs), as we saw in Chapter 6 there are two types of profit: gross profit and net profit:
![]()
The cost of sales is the product (or service) cost. It is either:
- the cost of providing a service; or
- the cost of buying goods sold by a retailer; or
- the cost of raw materials and production costs for a product manufacturer.
![]()
Expenses are the period costs, as they relate more to a period of time than to the production of products/services. These will include all the other (marketing, selling, administration, IT, human resources, finance, etc.) costs of the business, i.e. those not directly concerned with buying, making or providing goods or services, but supporting that activity.
To calculate the cost of sales, we need to take into account the change in inventory, to ensure that we match the income from the sale of goods with the cost of the goods sold. As we saw in Chapter 6, inventory (or stock) is the value of goods purchased or manufactured that have not yet been sold. Therefore:
![]()
for a retailer, or:
![]()
for a manufacturer. For a service provider, there can be no inventory of services provided but not sold, as the production and consumption of services take place simultaneously, so:
![]()
As we know, sales, cost of sales, gross profit, expenses and operating profit are all shown in the Income Statement.
Product costs are those that appear under cost of sales, while period costs are those that are deducted from gross profit to arrive at net or operating profit. While the valuation of inventory is prescribed by accounting standards, there are no such rules as to how gross profit is calculated and the distinction between product and period costs varies across different businesses. For example, in most large retail chains, the cost of sales include not only the cost of the goods sold but also all the costs of the supermarkets (store rental, staff costs, etc.) in which we shop. Period costs include the distribution centres that hold the bulk of inventory and the head office functions. One reason for this is to avoid competitors knowing what the mark-up or margin (see Chapter 10) is on the company’s sales. In service businesses, there is no requirement to show gross profit and there is considerable variation in how service businesses report.
Therefore, when we speak of ‘overheads’ we are not sure what costs are included. Perhaps a more meaningful distinction is that between direct and indirect costs.
Direct and indirect costs
Accounting systems typically record costs in terms of line items. As we saw in Chapter 3, line items reflect the structure of an accounting system around accounts for each type of expense, such as raw materials, salaries, rent and advertising. Production costs (the cost of producing goods or services) may be classed as direct or indirect. Direct costs are readily traceable to particular products/services. Indirect costs are necessary to produce a product/service, but are not able to be readily traced to particular products/services. Any cost may be either direct or indirect, depending on its traceability to particular products/services. Because of their traceability, direct costs are nearly always variable costs because these costs increase or decrease with the volume of production. However, as we saw in Chapter 12, direct labour is sometimes treated as a fixed cost. Indirect costs may be variable (e.g. electricity) or fixed (e.g. rent). Indirect costs are often referred to as overheads.
Direct materials are traceable to particular products through material issue documents. For a manufacturer, direct material costs will include the materials bought and used in the manufacture of each unit of product. They will clearly be identifiable from a bill of materials: a detailed list of all the components used in production (see Chapter 11). There may be other materials of little value that are used in production, such as screws, adhesives and cleaning materials, which do not appear on the bill of materials because they have little value and the cost of recording their use would be higher than the value achieved. These are still costs of production, but because they are not traced to particular products they are indirect material costs.
While the cost of materials will usually only apply to a retail or manufacturing business, the cost of labour will apply across all business sectors. Direct labour is traceable to particular products or services via a time-recording system. It is the labour directly involved in the conversion process of raw materials to finished goods (direct labour was introduced in Chapter 12). Direct labour will be clearly identifiable from an instruction list or routing, a detailed list of all the steps required to produce a good or service. In a service business, direct labour will comprise those employees providing the service that is sold. In a call centre, for example, the cost of those employees making and receiving calls is a direct cost. Other labour costs will be incurred that do not appear on the routing, such as supervision, quality control, health and safety, cleaning and maintenance. These are still costs of production, but because they are not traced to particular products, they are indirect labour costs.
Other costs are incurred that may be direct or indirect. For example, in a manufacturing business, the depreciation of machines (a fixed cost) used to make products may be a direct cost if each machine is used for a single product (because the cost will be traceable) or an indirect cost if the machine is used to make many products (because it may be more difficult to trace the depreciation cost applicable to different products). The electricity used in production (a variable cost) may be a direct cost if it is metered to particular products or indirect if it applies to a range of products. A royalty paid per unit of a product/service produced or sold will be a direct cost. The cost of rental of premises, typically relating to the whole business, will be an indirect cost.
Prime cost is an umbrella term used to refer to the total of all direct costs. Production overhead is the total of all indirect material and labour costs and other indirect costs, i.e. all production costs other than direct costs. This distinction applies equally to the production of goods and services. However, not all costs in an organization are production costs. Some, as we have seen, relate to the period rather than the product. These other costs (such as marketing, sales, distribution, finance, IT, administration) are not included in production overhead. These other costs are classed generally as overheads, but in the case of period costs they are non-production overheads. A simple way to think about the distinction is to imagine a factory and office complex. These are generally separated by a large wall. The office on one side has nicely dressed people working at desks. On the other side of the wall, people work with machines and wear overalls. This is a bit simplistic, but it does help to understand the distinction. Production overheads relate to the factory side of the wall, and non-production overheads to the office side. Hence, a factory manager and his production clerks who sit in the factory will be classed as production overhead.
We do need to be careful when using the term ‘overhead’ to ensure that people we are talking to use the term in the same way, as its use may change from business to business and even from situation to situation. Here, we will define overheads as comprising indirect costs, i.e. those not readily traceable to products/services, although those overheads may be limited to production overheads, or may comprise all the overheads of a business, both production and non-production.
Distinguishing between production and non-production costs and between materials, labour and overhead costs as direct or indirect is contingent on the type of product/service and the particular production process used in the organization. Contingency theory is described later in this chapter. There are no strict rules, as the classification of costs depends on the circumstances of each business and the decisions made by the accountants in that business. Consequently, unlike financial accounting, there is far greater variety between businesses – even in the same industry – in how costs are treated for management accounting purposes.
Figure 13.1 shows the relationship between these different types of costs.
Figure 13.1 Cost classification.
The overhead allocation problem
We saw in Chapter 10 that there is an important distinction between fixed and variable costs, and the calculation of contribution (sales less variable costs) is important for short-term decision making. However, we also saw that in the longer term, all the costs of a business must be recovered if it is to be profitable. To assist with pricing, understanding profitability and other decisions, accountants calculate the full or absorbed cost of products/services.
As direct costs by definition are traceable, this element of product/service cost is usually quite accurate. However, indirect costs, which by their nature cannot be traced to products/services, must in some way be allocated over products/services in order to calculate the full cost. Overhead allocation is the process of spreading production overhead (i.e. those overheads that cannot be traced directly to products/services) equitably over the volume of production. The overhead allocation problem can be seen in Figure 13.2.
Figure 13.2 The overhead allocation problem.

The overhead allocation problem is a significant issue, as most businesses produce a range of products/services using multiple production processes. The most common form of overhead allocation employed by accountants has been to allocate overhead costs to products/services in proportion to direct labour, i.e. the more direct labour involved in producing a product/service, the more overhead is attributed to it. While this is probably a realistic assumption in professional services, it rarely accurately reflects the resources consumed in the production of most goods and services. For example, some processes may be resource intensive in terms of space, automation, people or working capital. Some processes may be labour intensive while others use differing degrees of technology. The cost of labour, due to specialization and market forces, may also vary between different processes. Further, the extent to which these processes consume the (production and non-production) overheads of the business can be quite different. The allocation problem can lead to overheads being arbitrarily allocated across different products/services, which can lead to inappropriate pricing and misleading information about product/service profitability. As production overheads are a component of the valuation of inventory (because they are part of the cost of sales), an increase or decrease in inventory valuation will move profits between different accounting periods, so different methods of overhead allocation to products can influence reported profitability.
Shifts in management accounting thinking
In their book Relevance Lost: The Rise and Fall of Management Accounting, Johnson and Kaplan (1987) emphasized the limitations of traditional management accounting systems that have failed to provide accurate product costs:
Costs are distributed to products by simplistic and arbitrary measures, usually direct-labor based, that do not represent the demands made by each product on the firm’s resources . . . the methods systematically bias and distort costs of individual products . . . [and] usually lead to enormous cross subsidies across products (p. 2).
Management accounting, according to Johnson and Kaplan (1987), failed to keep pace with new technology and became subservient to the needs of external financial reporting, as costs were allocated by accountants between the valuation of inventory and the cost of goods sold. Johnson and Kaplan claimed that ‘[m]any accountants and managers have come to believe that inventory cost figures give an accurate guide to product costs, which they do not’ (p. 145). They argued that:
as product life cycles shorten and as more costs must be incurred before production begins . . . directly traceable product costs become a much lower fraction of total costs, traditional financial measures such as periodic earnings and accounting ROI become less useful measures of corporate performance (p. 16).
Johnson and Kaplan claimed that the goal of a good product cost system:
should be to make more obvious, more transparent, how costs currently considered to be fixed or sunk actually do vary with decisions made about product output, product mix and product diversity (p. 235).
The idea of cross subsidization is important to understand. If a business sells a number of products and overheads are inappropriately allocated, then some products will bear unrealistically high costs and others unrealistically low costs. This is particularly so when indirect costs are a high proportion of total costs. The market will tend to recognize a bargain and so the business will sell many products/services where the cost (and therefore price) is understated. Sales volume will increase but profits will fall, as the revenue will be insufficient to cover the true costs of production. The market will also tend to recognize something that is too expensive and sales volume will fall, so the over-costed (and over-priced) products/services will not earn enough revenue to compensate for the under-costed, under-priced products/services.
In Relevance Lost, Johnson and Kaplan also argued against the focus on short-term reported profits and instead argued for short-term non-financial performance measures that were consistent with the firm’s strategy and technologies (these were described in Chapter 4). In a later book, Kaplan and Cooper (1998) described how activity-based cost (ABC) systems:
emerged in the mid-1980s to meet the need for accurate information about the cost of resource demands by individual products, services, customers and channels. ABC systems enabled indirect and support expenses to be driven, first to activities and processes, and then to products, services, and customers. The systems gave managers a clearer picture of the economics of their operations (p. 3).
ABC systems are a focus later in this chapter.
Kaplan and Cooper (1998) argued that cost systems perform three primary functions:
Leading companies, according to Kaplan and Cooper (1998), use their enhanced cost systems to:
- design products and services that meet customer expectations and can be produced at a profit;
- identify where improvements in quality, efficiency and speed are needed;
- assist front-line employees in their learning and continuous improvement;
- guide product mix and investment decisions;
- choose among alternative suppliers;
- negotiate price, quality, delivery and service with customers;
- structure efficient and effective distribution and service processes to targeted market segments.
There are two methods of overhead allocation: absorption costing (the traditional method) and activity-based costing. These are compared in the next section, together with variable costing, a method that does not allocate overheads at all.
Table 13.1 shows a comparison between the three methods.
Table 13.1 Alternative methods of overhead allocation.
| Variable costing | Absorption costing | Activity-based costing |
| Allocates only variable costs as product costs | Allocates all fixed and variable production costs as product costs | Allocates all costs to products/services that can be allocated by cost drivers |
| All fixed costs are treated as period costs | All non-production costs are treated as period costs | The distinction between production and non-production costs is less important |
| Accumulates costs in cost centres and measures activity in each cost centre | Accumulates costs in cost pools based on business processes and measures the drivers of activities for each cost pool | |
| Calculate product/service cost for each cost centre as the unit of activity (e.g. labour hours) × budgeted overhead rate and adds this for all cost centres to give total product/service cost | Calculate product/service cost for each cost pool as activity volume × cost driver rate and adds this for all pools to give total product/service cost |
Alternative methods of overhead allocation
Variable costing
We have already seen (in Chapters 10, 11 and 12) the separation of fixed from variable costs. A method of costing that does not allocate fixed production overheads to products/services is variable (or marginal) costing. Under variable costing, the product cost only includes variable production costs. The business focus is on contribution rather than gross profit. Fixed production costs are treated as period costs and charged to the Income Statement. This method avoids much of the overhead allocation problem, as most production overheads tend to be fixed rather than variable in nature. However, variable costing does not comply with accounting standard IAS2 which requires ‘all related production overheads’ to be included in the value of inventory. Variable costing cannot therefore be used in financial reporting. Although it can be, and is used, for internal management decision making, the effect of IAS2 is to require companies to account – for financial reporting purposes – on an absorption costing basis, as ‘all related production overheads’ include both fixed and variable production costs.
Absorption costing
Absorption costing is a system in which all (fixed and variable) production overhead costs are charged to products/services using an allocation base (a measure of activity or volume such as labour hours, machine hours or the number of units produced). The allocation base used in absorption costing is often regarded as arbitrary because there is usually no logical connection between the allocation base and overhead costs. Businesses using absorption costing will select an appropriate allocation base for their business. The allocation base tends to be selected because it is already measured (e.g. direct labour hours). Under absorption costing, a budgeted overhead rate can be calculated as either:
- a business-wide rate; or
- a cost centre overhead rate.
A business-wide budgeted overhead rate is calculated by dividing the production overheads for the total business by the selected measure of activity. Overhead rates can also be calculated for each cost centre separately. A cost centre is a location within the organization to which costs are assigned (it may be a department or a group of activities within a department, see Chapter 2). A cost centre budgeted overhead rate is a result of determining the overheads that are charged to each cost centre separately and an allocation base that measures the activity of that cost centre. Different cost centres may use different allocation bases in the same company, as the costs and activity levels for each cost centre may be quite different. Remember that these are budgeted rates, based on expected costs and levels of activity. Businesses cannot wait until after the end of an accounting period when financial statements are produced to calculate actual costs and prices (we discuss differences between budget and actual overhead expenses and activity levels later in this chapter).
The overhead charged to each cost centre must be recovered as a rate based on the principal unit of activity within that cost centre, typically direct labour hours, machine hours or the number of units produced. We therefore calculate a direct labour hour rate or a machine hour rate or a rate per unit produced for each production cost centre, or for the business as a whole, which allocates overheads.
Under both methods, the budgeted overhead rate is:
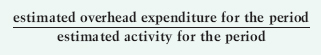
For example, a business with budgeted overhead expenditure of £100,000 and an activity level of 4,000 direct labour hours would have a business-wide budgeted overhead rate of £25 per hour (£100,000/4,000). Most businesses are able to identify their overhead costs and activity to individual cost centre levels and determine cost centre overhead rates. This can be achieved using a three-stage process:
| Expense | Allocation basis |
| Management salaries | Number of employees in each cost centre |
| Premises cost | Floor area occupied by each cost centre |
| Electricity | Machine hours used in each cost centre |
| Depreciation on equipment | Asset value in each cost centre |
| Service cost centre | Allocation basis |
| Maintenance | Timesheet allocation of hours spent in each production cost centre |
| Canteen | Number of employees in each cost centre |
| Scheduling | Number of production orders |
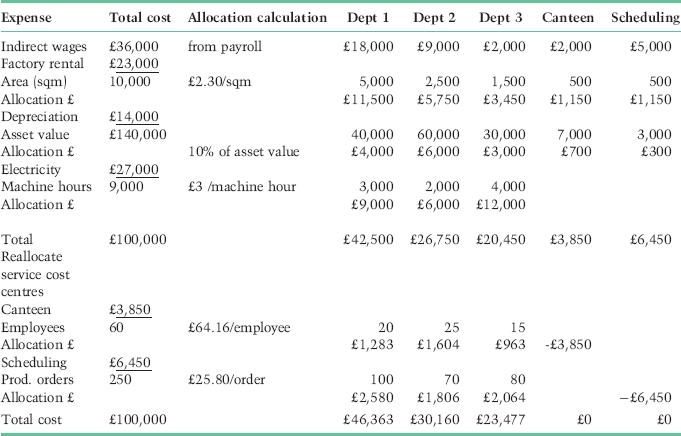
An example of cost allocation between departments is shown in Table 13.2. Using the previous example and the same overhead costs of £100,000, suitable methods of allocation have been identified over five departments (stages 1 and 2) as follows:
Table 13.2 Overhead allocations.
| Expense item | Method of allocation |
| Indirect wages | Allocated by payroll system |
| Factory rental | Floor area |
| Depreciation on equipment | Asset value |
| Electricity | Machine hours |
Of the five departments, two are service departments. Their costs can be allocated as follows (stage 3):
| Service cost centre | Method of allocation |
| Canteen | Number of employees |
| Scheduling | Number of production orders |
Table 13.2 shows the figures produced to support the allocation process.
Once the costs have been allocated, a reasonable measure of activity is determined for each cost centre. While this is often direct labour hours (the most common measure of capacity), the unit of activity can be different for each cost centre (e.g. machine hours, material volume, number of units produced). For non-manufacturing businesses the unit of activity may be hotel rooms, airline seats or consultancy hours. Using the above example and given the number of labour hours in each cost centre, we can now calculate a cost centre overhead rate, i.e. a budgeted overhead rate for each cost centre, as shown in Table 13.3.
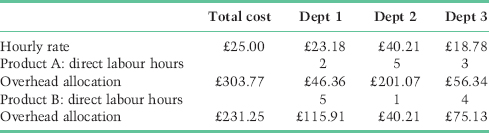
Table 13.3 Cost centre budget overhead rate.
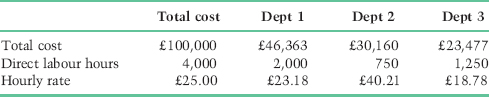
The most simplistic form of overhead allocation uses a single overhead rate for the whole business. As we previously calculated, the business-wide budgeted overhead rate is £25.00 per direct labour hour (£100,000/4,000). This rate would apply irrespective of whether the hours were worked in stages of production that had high or low machine utilization, different levels of skill, different pay rates or required different degrees of support.
Under the cost centre budgeted overhead rate, the rate per direct labour hour varies from a low of £18.78 for Dept 3 to a high of £40.21 for Dept 2. This reflects the different cost structure and activity level of each cost centre.
Consider an example of two products, each requiring 10 machine hours. The extent to which each product requires different labour hours in each of the three departments will lead to quite different overhead allocations.
Assume that product A requires 2 hours in Dept 1, 5 hours in Dept 2 and 3 hours in Dept 3. The overhead allocation would be £303.77. If product B requires 5, 1 and 4 hours respectively in each department, the overhead allocation would be £231.25, as Table 13.4 shows.
Table 13.4 Overhead allocation to products based on cost centre budget overhead rate.
The total cost of a product comprises the prime cost (the total of direct costs) and the overhead allocation. Whether a business-wide or cost centre overhead allocation rate is used, the prime cost is unchanged. Assuming that the direct costs per unit for our two example products are:
| Product A | Product B | |
| Direct materials | 110 | 150 |
| Direct labour | 75 | 90 |
| Prime cost | 185 | 240 |
The allocation of overhead based on cost centre rates (rounded to the nearest £) would be:
| Prime cost (from above) | 185 | 240 |
| Overhead allocation | 304 | 231 |
| Full (or absorbed) cost | 489 | 471 |
By contrast, the overhead allocation to both products (each of which requires 10 hours of production time) using a business-wide rate would be £250 (10 @ £25). The allocation of overhead based on the business-wide rate would be:
| Product A | Product B | |
| Prime cost (from above) | 185 | 240 |
| Overhead allocation | 250 | 250 |
| Full (or absorbed) cost | 435 | 490 |
As can be seen in the above example, the overhead allocation as a percentage of total cost can be very high relative to direct costs. This is not unusual in business, particularly in those organizations that have invested heavily in technology or in service businesses, where direct costs are a small proportion of total business costs. What is important here is that, just by varying the assumptions in the method of overhead allocation between using a cost centre rate or a business-wide rate, the result can be quite different product costs.
The cost centre rate is more accurate than the business-wide rate because it does attempt to differentiate between the different cost structures of cost centres. However, the absorption method of allocating overhead costs to products/services has received substantial criticism because of the arbitrary way in which overheads are allocated. Most businesses use allocation bases such as direct labour hours, machine hours or production units, because that data is readily available. The implicit assumption of absorption costing is that the allocation base chosen is a reflection of why business overheads are incurred. For example, if the allocation base is direct labour or machine hours, the assumption of absorption costing is that overhead costs are incurred in proportion to direct labour or machine hours. This is unlikely to be the case in most businesses as many overheads are caused by the range and complexity of products/services.
Over- or under-recovery of overhead
The overhead rate per hour is based on budgeted costs and the budgeted level of activity. However, both actual costs and actual activity levels are likely to differ from budget. The result is an under- or over-recovery of overhead.
For example, assume we budgeted for costs of £100,000 and 4,000 direct labour hours, resulting in an overhead rate of £25 per hour. Some alternative outcomes are:
- If actual costs are £105,000 but we still work 4,000 hours, we will charge £100,000 to production (4,000 × £25) and under-recover £5,000 (spending £105,000 less recovered £100,000).
- If actual costs are £102,000 and we work only 3,850 hours, we will charge £96,250 to production (3,850 × £25) and under-recover £5,750 (spending £102,000 less recovered £96,250).
- If actual costs are £98,000 and we work 4,100 hours, we will charge £102,500 to production (4,100 × £25) and over-recover £4,500 (spending £98,000 but recovering £102,500).
The under- or over-recovered overhead amount is most commonly charged to cost of sales but it may be allocated between cost of goods sold and any unsold inventory.
If budget costs and activity levels are not achieved, decisions about pricing or product profitability may be incorrect and the information used for business decisions may not be sound. Therefore it is important for spending to be controlled in line with budget (we discuss this further in Chapter 17) and for unused capacity to be reduced (we discussed the cost of spare capacity in Chapter 11).
As a result of the criticism of absorption costing, Kaplan and Cooper (1998) developed an alternative approach to overhead allocation: activity-based costing.
Activity-based costing
Activity-based costing (or ABC) is an attempt to identify a more accurate method of allocating overheads to products/services. ABC uses cost pools to accumulate the cost of significant business activities and then assigns the costs from the cost pools to products based on cost drivers, which measure each product’s demand for activities.
Cost pools accumulate the cost of business processes, irrespective of the organizational structure of the business. The costs that correspond to the formal organization structure may still be accumulated for financial reporting purposes through a number of cost centres, but this will not be the method used for product costing. For example, the purchasing process can take place in many different departments. A stores-person or computer operator may identify the need to restock a product. This will often lead to a purchase requisition, which must be approved by a manager before being passed to the purchasing department. Purchasing staff will have negotiated with suppliers in relation to quality, price and delivery and will generally have approved suppliers and terms. A purchase order will be raised. The supplier will deliver the goods against the purchase order and the goods will be received into the store. The paperwork (a delivery note from the supplier and a goods received note) will be passed to the accounting department to be matched to the supplier invoice and payment will be made to the supplier. This business process cuts across several departments. Chapter 9 (and Figure 9.1 in particular) explained the business process approach in more detail.
ABC collects the costs for the purchasing process in a cost pool, irrespective of the cost centre or department which incurred the cost. The next step is to identify a cost driver.
The cost driver is the most significant cause of the activity for each cost pool. In the purchasing example, the causes of costs are often recognized as the number of suppliers and/or the number of purchase orders. Cost drivers enable the cost of activities to be assigned from cost pools to cost objects (products/services). Rates are calculated for each cost driver and overhead costs are applied to products/services on the basis of the cost driver rates. There are no rules about what cost pools and cost drivers should be used, as this will be contingent on the circumstances of each business and the choices made by its accountants. Examples of cost pools and drivers are:
| Cost pool | Cost driver |
| Purchasing | No. of purchase orders |
| Sales order entry | No. of sales orders |
| Material handling | No. of set-ups (i.e. batches) |
| Scheduling | No. of production orders |
| Machining | Machine hours (i.e. not labour hours) |
For example, a rate will be calculated for each cost driver (e.g. purchase order, set-up) and assigned to each product based on how many purchase orders and set-ups the product has consumed. The more purchase orders and set-ups a product requires, the higher the overhead cost applied to it will be. ABC does not mean that direct labour hours or machine hours or the number of units produced are ignored. Where these are the significant cause of activities for particular cost pools, they are used as the cost drivers for those cost pools.
Using the same example as for absorption costing, assume for our two products that there are two cost pools: purchasing and scheduling. The driver for purchasing is the number of purchase orders and the driver for scheduling is the number of production orders. Costs are collected by an activity-based accounting system (which uses a coding structure to identify the cost pool as well as the cost centre) into cost pools and the measurement of cost drivers takes place, identifying how many activities are required for each product. The cost per unit of activity is the cost pool divided by the cost drivers, as shown in Table 13.5.
Table 13.5 Overhead accumulated in cost pools and allocated by cost drivers.
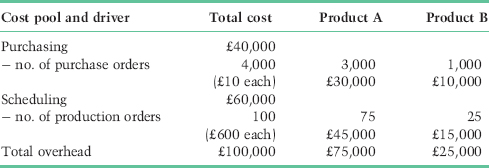
We can then calculate the overhead cost per product/service by dividing the total cost pool by the quantity of products/services produced. This is different to the absorption method which calculates the overhead costs per unit of product/service directly. Under the ABC method, overheads are identified with the total volume of a product/service produced and need to be divided by the volume of production to give the overhead per unit of product/service. This is shown in Table 13.6.
Table 13.6 Overhead per product based on ABC.
| Product A | Product B | |
| Total overhead | £75,000 | £25,000 |
| Quantity produced | 150 | 250 |
| Per product (total overhead/quantity) | £500 | £100 |
The prime cost (the total of direct costs) is not affected by the method of overhead allocation. The total cost of each product using ABC for overhead allocation is shown in Table 13.7. Table 13.8 compares the cost of each product calculated using both methods of absorption costing with that using ABC.
Table 13.7 Product costing under ABC.
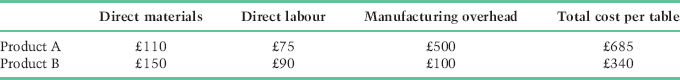
Table 13.8 Comparison of product costs under absorption costing and activity-based costing.
| Product A | Product B | |
| Cost using absorption costing – business-wide rate | £435 | £490 |
| Total cost using absorption costing – cost centre rate | £489 | £471 |
| Total cost using activity-based costing | £685 | £340 |
Although this is an extreme example, significant differences can result in practice from the adoption of an activity-based approach to overhead allocation. In this example, overheads allocated using direct labour hours under absorption costing do not reflect the actual causes for overheads being incurred. Product A not only uses more purchasing and production order activity (the drivers of overheads), but also has a lower volume of production. Reflecting the cause of overheads in overhead allocations more fairly represents the cost of each product. Under absorption costing, Product B was subsidizing Product A when compared with ABC. Cross-subsidization can be hidden where a business sells a mixture of high-volume and low-volume products/services, where there is a wide product/service variety, and where product/service complexity varies resulting in different demands on resources.
Differences between absorption and activity-based costing
First, it is important to remember that under both methods, direct labour and material costs are the same. Also under both methods, the total overhead incurred by the company is the same. The difference between the two methods is because of different assumptions underlying the method of allocation of overhead costs over multiple products/services.
Under absorption costing, overheads are allocated in proportion to an arbitrary allocation base, typically direct labour hours. This means that the more labour hours allocated to a product/service, the more overhead will be allocated to it. While in some businesses this may be realistic (e.g. professional services), this is not necessarily the case. Under activity-based costing, overheads are traced through their drivers (the causes of activity) to the products/services that consume those activities, i.e. the more overheads a product/service causes to be incurred, the more overheads will be allocated to it.
However, one significant difference that the example in this chapter has not shown is in the distinction between production overhead and non-production overhead. While we have been concerned with allocating production overheads to products/services, to calculate the total cost of a product where a cost-plus approach to pricing is in place (see Chapter 10) there is a need to allocate non-production overheads to products/services. This is more difficult as, by definition, these overheads are applicable more to the accounting period than to products.
Under ABC, the distinction between fixed and variable costs and between production overhead and non-production overhead that applies to absorption costing is less important and can help with the allocation of a wider definition of overhead (production and non-production) to products/services. Rather than focus on the simplistic fixed/variable distinction we introduced in Chapter 10, under an ABC approach costs are identified as follows:
- Unit-level activities: these are performed each time a unit is produced, e.g. direct labour, direct materials and variable manufacturing costs such as electricity. These activities consume resources in proportion to the number of units produced. If we are printing books, then the cost of paper, ink and binding, and the labour of printers, are unit-level activities. If we produce twice as many books, unit-level activities will be doubled.
- Batch-related activities: these are performed each time a batch of goods is produced, e.g. a machine set-up. The cost of these activities varies with the number of batches, but is fixed irrespective of the number of units produced within the batch. Using our book example, the cost of set-up, or making the printing machines ready for printing, e.g. washing up, changing the ink, changing the paper, is fixed irrespective of how many books are printed in that batch, but variable on the number of batches that are printed.
- Product-sustaining activities: these enable the production and sale of multiple products/services, e.g. maintaining product specifications, after-sales support, product design and development. The cost of these activities increases with the number of products, irrespective of the number of batches or the number of units produced. For each differently titled book published, there is a cost incurred in dealing with the author, obtaining copyright approval, typesetting the text and so on. However many batches of the book are printed, these costs are fixed. Nevertheless, the cost is variable depending on the number of books that are published. Similarly, customer-sustaining activities support individual customers or groups of customers, e.g. different costs may apply to supporting retail – that is, end-user – customers compared with resellers. In the book example, particular costs are associated with promoting a textbook to academics in universities in the hope that it will be set as required reading. Fiction books will be promoted through advertising and in-store displays.
- Facility-sustaining activities: these support the whole business and are common to all products/services. Examples of these costs include senior management and administrative staff, and premises costs. Under ABC these costs are fixed and unavoidable and irrelevant for most business decisions, being unrelated to the number of products, customers, batches or units produced.
While unit-level activities are purely variable and facility-sustaining activities purely fixed, the ability to differentiate batch and product sustaining activities provides more flexibility in understanding the drivers (i.e. causes) of overheads and enables a more accurate allocation of overheads to be carried out.
Because costs are assigned under ABC to cost pools rather than cost centres, and as business processes cross through many cost centres, the distinction between production and non-production overheads also breaks down under ABC. While the distinction is still important for stock valuation (as IAS2 requires the inclusion of production overheads), this distinction is not necessary for management decision making. The more (production and non-production) overheads that are able to be allocated accurately to products/services, the more accurate will be the information for decision making about relevant costs, pricing and product/service profitability.
The ABC method is generally preferred because the allocation of costs is based on cause-and-effect relationships, while the absorption costing system is based on an arbitrary allocation of overhead costs. However, ABC can be costly to implement because of the need to analyse business processes in detail; requiring an accounting system that collects costs for both cost centres and cost pools; and the need to identify cost drivers and measure the extent to which individual products/services consume resources. Organizations often carry out a pilot study in one business unit to determine whether ABC provides more meaningful management data before it is more widely introduced.
However, although conceptually attractive, surveys of practice show that ABC has not been considered by the majority of organizations, and that it has been abandoned by many organizations which adopted it in the 1990s (Gosselin, 2007).
Why, then, do different organizations adopt different methods of management accounting? One explanation is provided by contingency theory.
Contingency theory
The central argument of contingency theory is that there is no control system (which, as described in Chapter 4, includes accounting systems) that is appropriate to all organizations. Fisher (1995) contrasts contingency with situation-specific and universalist models. The situation-specific approach argues that each control system is developed as a result of the unique characteristics of each organization. The universalist approach is that there is an optimal control system design that applies at least to some extent across different circumstances and organizations. The contingency approach is situated between these two extremes, in which the appropriateness of the control system depends on the particular circumstances faced by the business. However, generalizations in control systems design can be made for different classes of business circumstances.
Fisher (1995) reviewed various contingency studies and found that the following variables have been considered in research studies as affecting control systems design:
- External environment: whether uncertain or certain, static or dynamic, simple or complex.
- Competitive strategy: whether low cost or differentiated (e.g. Porter, see Chapter 10) and the stage of the product lifecycle (see Chapter 18).
- Technology: the type of production technology (see Chapter 11).
- Industry and business variables: size, diversification and structure (see Chapter 15).
- Knowledge and observability of outcomes and behaviour: the transformation process between inputs and outputs (see Chapter 4).
Otley (1980) argued that a simple linear explanation which assumed that contingent variables affected organizational design, which in turn determined the type of accounting/control system in use and in turn led to organizational effectiveness, was an inadequate explanation. Otley emphasized the importance of other controls outside accounting, the number of factors other than control system design influencing organizational performance and that organizational effectiveness is itself difficult to measure. He argued that the contingent variables were outside the control of the organization, and those that could be influenced were part of a package of organizational controls including personnel selection, promotion and reward systems. Otley also argued that there were other factors that, together with the contingent variables, influenced organizational effectiveness. He believed that an organization ‘adapts to the contingencies it faces by arranging the factors it can control into an appropriate configuration that it hopes will lead to effective performance’ (p. 421).
The choice of an absorption or activity-based approach to the overhead allocation problem is one example of how a control system will be influenced by contingent factors: the environment, competition, technology, business and observability factors. The comment by Clark (1923), mentioned previously in this book, that there were ‘different costs for different purposes’ can be seen as an early understanding of the application of the contingency approach. Clark further commented that ‘there is no one correct usage, usage being governed by the varying needs of varying business situations and problems’. Most important is the need to use cost information in different ways depending on the business circumstances, which has been the focus of Chapters 10 to 12.
However, we should not assume that the techniques in the Chapters 10–13 are universally applicable. In many cases they are Western constructions, linked to the particular Anglo-centric capitalist system that is most evident in the UK, USA, Canada and Australia. It is therefore worthwhile highlighting some key international differences.
International comparisons
Alexander and Nobes (2001) described various approaches to categorizing international differences in accounting, including:
- different legal systems;
- whether accounting was commercially driven, government-driven or governed by professional regulation;
- the relative strength of equity markets.
Alexander and Nobes argued that legal systems, tax systems and the strength of the accountancy profession all influence the development of accounting, but the main explanation for the most important international differences in financial reporting is the financing system (such as the size and spread of corporate shareholding). For example, the growth of institutional investors (such as pension/superannuation funds, insurance companies) has reduced the size of individual shareholdings in companies. In Germany, it is common for banks to own shares in the companies they lend to, but this is unheard of in the UK.
Financial reporting is largely harmonized within the European Union and elsewhere, using IFRS as the global accounting standards (see Chapter 6). This is likely to be a continuing trend given the globalization of capital markets which is likely to encompass the USA over the next few years. Whether there will be any effect of harmonization on management accounting practices is as yet unknown. In understanding management accounting, practising managers and students of accounting receive little exposure to management accounting practices outside the Anglo-centric economies. It is important to contrast this approach with other practices, particularly those in Japan. These practices are different because they are predicated on different assumptions, particularly the different emphases on long-term strategies for growth versus short-term strategies for profit. There are historical, cultural, political, legal and economic influences underlying the development of different management accounting techniques in that country, to take a single example.
Management accounting in Japan
Japan has a strong history of keiretsu, the interlocking shareholdings of industrial conglomerates and banks, with overlapping board memberships. This has, at least in part, influenced long-term strategy because of the absence of strong stock market pressures for short-term performance, as is the case in Anglo-centric countries.
Demirag (1995) studied three Japanese multinationals with manufacturing subsidiaries in the UK, two in consumer electronics and one in motor vehicles. The companies had strongly decentralized divisional profit responsibilities with autonomous plants focused on target results. A complex matrix structure resulted in reporting to general management in the UK as well as to functional and product management in Japan. The company’s basic philosophy was that the design team was responsible for profit while continuous processes were in place to monitor and reduce production costs.
According to Demirag (1995), Japanese companies exhibited a strategic planning style of management control rather than an emphasis on financial control. The strategic planning systems were bureaucratic, although business units gave top management the information necessary to formulate and implement plans. As Japanese managers move frequently between plants and divisions, they have a better understanding of communication and coordination than their British counterparts. Japanese managers also put the interest of the organization above their own divisions. There is less attention to accounting and management control in Japan than to smooth production and quality products. Performance targets were set in the context of strategy but results were expected in the longer term.
In the Japanese companies, manufacturing and sales were independent of each other, each having its own profit responsibility, the underlying principle being that each side of the business drives the other to be more effective and efficient. Although traditionally manufacturing had the greatest negotiating power, this did lead to a failure of market information reaching top decision-makers in Japan. There was a top-down approach to capital investment decisions, with managers taking a strategic and company-wide perspective that reduced the importance of financial decisions, with ROI not being seen as a particularly useful measure.
Pressures to meet short-term financial targets were not allowed to detract from long-term progress. In performance measurement, much more emphasis was placed on design, production and marketing than on financial control. Japanese management accounting does not stress optimizing within existing constraints, but encourages employees to make continual improvements. The main emphasis was on market-driven product costing, i.e. target costing (this is explained in Chapter 18), aimed at increasing market share over time by accepting lower short-term profits. A market-driven target costing approach ‘emphasizes doing what it takes to achieve a desired performance level under market conditions . . . how efficiently it must be able to build it for maximum marketplace success’ (Hiromoto, 1991, p. 70).
Overhead allocation was not important, but there was a focus on how the allocation techniques used encouraged employees to reduce costs. Hiromoto (1991) described Japanese management accounting practices and the central principle that accounting policies should be subservient to corporate strategy, not independent of it. Japanese companies use accounting systems more to motivate employees to act in accordance with long-term manufacturing strategies. Hiromoto describes the example of Hitachi, which used direct labour hours as the overhead allocation base, as this ‘creates the desired strong pro-automation incentives throughout the organization’ (p. 68). By contrast, another Hitachi factory uses the number of parts as the allocation base in order to influence product engineering to drive reductions in the number of parts. Standard costs are not used in Japan as they are in the West.
Overall, Japanese accounting policies are subservient to strategy, where production engineering knowledge has an equal or higher status to accounting knowledge, with the result that, for example in Toyota, the ‘visible benefits’ of lower inventory in the financial statements is outweighed by the invisible production benefits, ‘especially the ability to run mixed model lines in a small batch factory’ (Williams et al., 1995, p. 233). Currie (1995) undertook a comparative study of costing and investment appraisal for the evaluation of advanced manufacturing technology (AMT). Research identified that Japanese managers were uninterested in new management accounting techniques such as activity-based costing, since knowledge that some products were more expensive to produce than others was not important to product strategy decisions. On the contrary, expensive products were likely to have strategic value to the company.
Williams et al. (1995) reported similar findings to Demirag and, taking a critical perspective, asserted:
In Japanese firms financial calculations are integrated into productive and market calculations; the result is a three-dimensional view which denies the universal representational privilege of financial numbers. Furthermore the integration of different kinds of calculation broadens out the definition of performance and identifies new points of intervention in a way which undermines the privilege of financial guidance techniques; in Japanese firms the main practical emphasis is on productive and market intervention rather than orthodox financial control (p. 228).
These Japanese examples, although dated, show that management accounting can be used in many different ways, but should be relevant to the business strategy. The final section of this chapter addresses some behavioural issues associated with management accounting.
Behavioural implications of management accounting
Hopper et al. (2001) traced the rise of behavioural and organizational accounting research in management accounting. In the UK, a paradigm shift occurred that did not happen in the USA (where agency theory – see Chapter 6 – has been the dominant research approach). In the UK, contingency theory and neo-human relations approaches were abandoned for more sociological and political approaches that drew from European social theory and were influenced by Scandinavian case-based research.
Burchell et al. (1980) argued:
What is accounted for can shape organizational participants’ views of what is important, with the categories of dominant economic discourse and organizational functioning that are implicit within the accounting framework helping to create a particular conception of organizational reality (p. 5).
Reality in the economics and agency-based discourse is about shareholder value, while more sociological and political perspectives (see Chapter 5) see reality as socially constructed or the result of domination by one group over another. Along the same lines, Miller (1994) argued that accounting was a social and institutional practice. Accounting is not a neutral device that merely reports ‘facts’ but a set of practices that affects the type of world in which we live, the way in which we understand the choices able to be made by individuals and organizations and the way in which we manage activities. Miller argued that ‘to calculate and record the costs of an activity is to alter the way in which it can be thought about and acted upon’ (p. 2).
We have seen through the examples in Chapters 10–13 how accounting can change the way we see things. Choices about contribution margin or gross profit, avoidable or unavoidable costs, historic cost or relevant cost, cash costs or opportunity costs, and the choice of absorption or activity-based costing approaches all change our understanding of the cost and profitability of a product/service, a business unit, a market segment, and therefore the decisions we take with that understanding.
Cooper et al. (1981) reflected that accounting systems are a significant component of power in organizations:
Internal accounting systems by what they measure, how they measure and who they report to can effectively delimit the kind of issues addressed and the ways in which they are addressed (p. 182).
Various published research studies have adopted an interpretive or critical perspective in understanding the link between accounting systems, organizational change and the behaviour of people in organizations as a result of culture and power (see Chapter 5 for the theoretical framework of these subjects). The interpretive perspective has provided a number of interesting studies. The study of an area of the National Coal Board by Berry et al. (1985) emphasized a dominant operational culture and the extent to which accounting reports were ‘ignored, trivialised and/or misunderstood’ (p. 16). The accounting system was:
consistent with the values of the dominant managerial culture, and being malleable and ambiguous it reflected and helped coping with the uncertainties inherent with the physical task of coal extraction and its socioeconomic environment (p. 22).
Dent (1991) carried out a longitudinal field study of accounting change in EuroRail (which is one of the readings in this book), in which organizations were portrayed as cultures, i.e. systems of knowledge, belief and values. Prior to the study the dominant culture was engineering and production, in which accounting was incidental. This was displaced by economic and accounting concerns that constructed the railway as a profit-seeking enterprise:
Accounting actively shaped the dominant meanings given to organizational life . . . [in which a] new set of symbols, rituals and language emerged (p. 708).
Dent described how accounting played a role ‘in constructing specific knowledges’ (p. 727) by tracing the introduction of a revised corporate planning system, the amendment of capital expenditure approval procedures and the revision of budgeting systems, each of which shifted power from railway to business managers.
Roberts (1990) studied the acquisition and subsequent management of ELB Ltd by Conglom Inc. Following acquisition, ‘the dominance of a production culture was instantly supplanted by the dominance of a purely financial logic’ and the sale of the European operations to a competitor ‘signalled the dominance of corporate financial concerns over long-term market concerns’ (p. 123), although this was reinforced by share options, bonuses and managers’ fear of exclusion. Accounting information was:
able to present an external image of ‘success’ . . . and hence conceals the possibility of the damaging strategic consequences for individual business units of Conglom’s exclusive preoccupation with financial returns (p. 124).
In adopting a critical perspective, Miller and O’Leary (1987) described the construction of theories of standard costing in the period 1900–30, which they viewed as ‘an important calculative practice which is part of a much wider modern apparatus of power’ aimed at ‘the construction of the individual person as a more manageable and efficient entity’ (p. 235). The contribution of standard costing was to show how ‘the life of the person comes to be viewed in relation to standards and norms of behaviour’ (p. 262).
Laughlin (1996) played on ‘principal and agent’ theory to question the legitimacy of the principal’s economic right to define the activities of the agent. He coined the term ‘higher principals’ to refer to the values held, particularly in the caring professions (education, health and social services), which could, he argued, overrule the rights of economic principals. These higher principals could be derived from religion, professional bodies or personal conscience.
Broadbent and Laughlin (1998) studied schools and GP (medical) practices and identified financial reforms as ‘an unwelcome intrusion into the definition of professional activities’ (p. 404), which led to resistance in the creation of ‘informal and formal “absorption” processes to counteract and “mute” the changes’ (p. 405).
Similarly, Covaleski et al. (1998) studied the (then) ‘Big Six’ professional accounting firms, where management by objectives and mentoring were used as techniques of control, revealing that the ‘discourse of professional autonomy’ fuelled resistance to these changes.
It is important in making choices about accounting methods to understand that these choices have behavioural consequences, some intended, some unintended, particularly where existing power structures are threatened, or where changes made are inconsistent with the norms and values, or culture, within the organization. In each case, management may face considerable resistance.
In Chapters 4 and 5, we considered rational-economic, interpretive and critical perspectives that help to provide multiple views about the world in which we live. Chapters 10 through 13 have introduced many aspects of costs and how management accounting techniques are used in planning, decision making and control in relation to marketing, operations, human resource and accounting.
Implicit in most of what is contained in these four chapters is an acceptance of the rational-economic paradigm described in Chapter 4. The notion of shareholder value and the importance of profit have dictated acceptable approaches to calculating costs, at least for financial reporting purposes to shareholders. In financial reporting, regulation and audit generally prevents (except in creative accounting or earnings management) any but a single interpretation, the rational-economic one. However, as we have seen through the examples in these chapters, different interpretations of cost are possible, and all are defensible depending on the assumptions used.
The interpretive perspective applied to management accounting accepts that different understandings exist. So, there are alternative approaches to pricing (Chapter 10) in which different solutions are possible, yet all are correct if based on specific assumptions. Different methods of judging the best use of capacity are also possible (Chapter 11). Relevant costs are an entirely different approach to traditional historical costing (Chapters 11 and 12) while variable, absorption and activity-based costing are very different interpretations about the treatment of overhead costs (this chapter). The critical paradigm privileges one or other treatment in each of these examples as a result, not necessarily of rational choice, but of the power of the dominant management group (including the role of accountants in that group) which can influence the particular techniques adopted.
We conclude this chapter on overhead allocation with two case studies illustrating the overhead allocation problem.
Table 13.9 Quality Bank – direct costs and allocated overheads by branch.

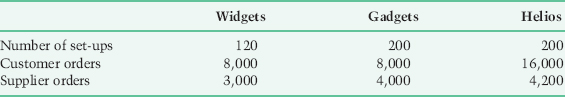
Table 13.10 Quality Bank – cost pools and drivers.
| Cost pools | € | Cost driver |
| Branch costs | 120,000 | No. of branch transactions |
| Computer system costs | 180,000 | No. of total transactions |
| Telecommunications costs | 60,000 | No. of customers |
| Credit checking costs | 40,000 | No. of new accounts |
| €400,000 |
Table 13.11 Quality Bank – costs per driver.
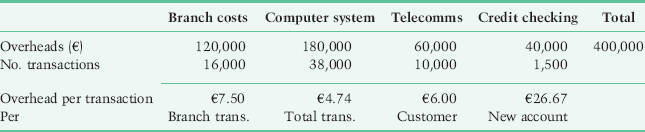
Table 13.12 Quality Bank – transaction volumes by branch.
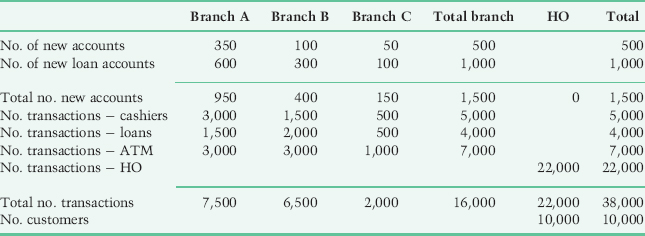
Table 13.13 Quality Bank – cost analysis using ABC.
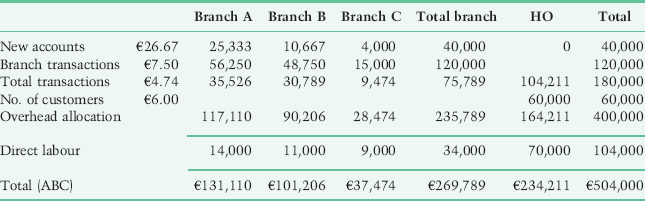
Table 13.14 Quality Bank – comparison of costs under absorption and activity-based costing.

Conclusion
In Chapters 10, 11 and 12, various accounting techniques were identified that can be used by non-financial managers as part of the decision-making process. With the shift in most Western economies to service and knowledge-based industries and high-technology manufacture, overheads have increased as a proportion of total business costs. This chapter has shown the importance to decision making of the assumptions and methods used by accountants to allocate overheads to products/services. Understanding the methods used, and their limitations, is essential if informed decisions are to be made by accountants and non-financial managers.
This chapter has also shown that we need to consider the underlying assumptions behind the management accounting techniques that are in use. Other countries adopt different approaches and we have something to learn from the success or failure of those practices. We also need to consider the behavioural consequences of the choices made in relation to accounting systems.
The reader is encouraged to read and think about Reading A, which is an early but still relevant critique of traditional cost allocation processes. This critique ultimately led its authors to develop activity-based costing. Reading D is a classic case study of the introduction of accounting to a public enterprise. It reflects the interpretive approach and shows the importance of culture and power in changing accounting systems. As such, it is a useful illustration of the behavioural implications of accounting. The Readings are in Part IV of this book.
References
Alexander, D. and Nobes, C. (2001). Financial Accounting: An International Introduction. Harlow: Financial Times/Prentice Hall.
Berry, A. J., Capps, T., Cooper, D., Ferguson, P., Hopper, T. and Lowe, E. A. (1985). Management control in an area of the NCB: rationales of accounting practices in a public enterprise. Accounting, Organizations and Society, 10(1), 3–28.
Broadbent, J. and Laughlin, R. (1998). Resisting the ‘new public management’: absorption and absorbing groups in schools and GP practices in the UK. Accounting, Auditing and Accountability Journal, 11(4), 403–35.
Burchell, S., Clubb, C., Hopwood, A. and Hughes, J. (1980). The roles of accounting in organizations and society. Accounting, Organizations and Society, 5(1), 5–27.
Clark, J. M. (1923). Studies in the Economics of Overhead Costs. Chicago: University of Chicago Press.
Cooper, D. J., Hayes, D. and Wolf, F. (1981). Accounting in organized anarchies: understanding and designing accounting systems in ambiguous situations. Accounting, Organizations and Society, 6(3), 175–91.
Covaleski, M. A., Dirsmith, M. W., Heian, J. B. and Samuel, S. (1998). The calculated and the avowed: techniques of discipline and struggles over identity in Big Six public accounting firms. Administrative Science Quarterly, 43, 293–327.
Currie, W. (1995). A comparative analysis of management accounting in Japan, USA/UK and West Germany. In D. Ashton, T. Hopper and R. W. Scapens (Eds), Issues in Management Accounting (2nd edn). London: Prentice Hall.
Demirag, I. S. (1995). Management control systems of Japanese companies operating in the United Kingdom. In A. J. Berry, J. Broadbent and D. Otley (Eds), Management Control: Theories, Issues and Practices. Basingstoke: Macmillan.
Dent, J. F. (1991). Accounting and organizational cultures: a field study of the emergence of a new organizational reality. Accounting, Organizations and Society, 16(8), 705–32.
Fisher, J. (1995). Contingency-based research on management control systems: categorization by level of complexity. Journal of Accounting Literature, 14, 24–53.
Gosselin, M. (2007). A review of activity-based costing: technique, implementation, and consequences. In C. S. Chapman, A. G. Hopwood and M. D. Shields (Eds), Handbook of Management Accounting Research (Vol. 2, pp. 641–71). Oxford: Elsevier.
Hiromoto, T. (1991). Another hidden edge – Japanese management accounting. Getting Numbers You Can Trust: The New Accounting. Boston, MA: Harvard Business Review Paperback.
Hopper, T., Otley, D. and Scapens, B. (2001). British management accounting research: whence and whither: opinions and recollections. British Accounting Review, 33, 263–91.
Johnson, H. T. and Kaplan, R. S. (1987). Relevance Lost: The Rise and Fall of Management Accounting. Boston, MA: Harvard Business School Press.
Kaplan, R. S. and Cooper, R. (1998). Cost and Effect: Using Integrated Cost Systems to Drive Profitability and Performance. Boston, MA: Harvard Business School Press.
Laughlin, R. (1996). Principals and higher principals: accounting for accountability in the caring professions. In R. Munro and J. Mouritsen (Eds), Accountability: Power, Ethos and the Technologies of Managing. London: International Thomson Business Press.
Miller, P. (1994). Accounting as social and institutional practice: an introduction. In A. G. Hopwood and P. Miller (Eds), Accounting as Social and Institutional Practice. Cambridge: Cambridge University Press.
Miller, P. and O’Leary, T. (1987). Accounting and the construction of the governable person. Accounting, Organizations and Society, 12(3), 235–65.
Otley, D. (1980). The contingency theory of management accounting: achievement and prognosis. Accounting, Organizations and Society, 5(4), 413–28.
Roberts, J. (1990). Strategy and accounting in a UK conglomerate. Accounting, Organizations and Society, 15(1/2), 107–26.
Turney, P. B. B. and Anderson B. (1989). Accounting for continuous improvement. Sloan Management Review, Winter, 37–47.
Williams, K., Haslam, C., Williams, J., Abe, M., Aida, T. and Mitsui, I. (1995). Management accounting: the Western problematic against the Japanese application. In A. J. Berry, J. Broadbent and D. Otley (Eds), Management Control: Theories, Issues and Practices. Basingstoke: Macmillan.
- blanket (organization-wide) overhead recovery rate; and the
- cost centre overhead recovery rate for each division.
- a plant-wide overhead recovery rate; and
- cost centre overhead recovery rates.
| Product L | Product M | |
| No. of orders | 80 | 160 |
- Calculate the per-unit activity-based cost of purchasing for Products L and M.
- Calculate the overhead recovery for purchasing costs if those costs were recovered over the number of units of the product produced.
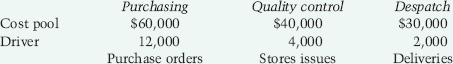
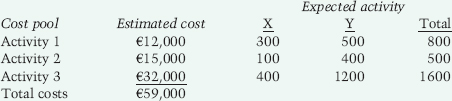
Table 13.15 Brixton Industries budget information.
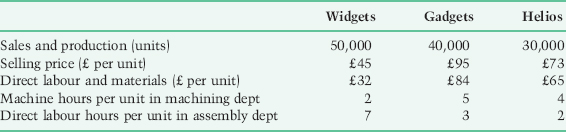
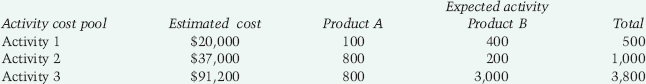
Table 13.16 Brixton Industries activity cost pools and drivers.
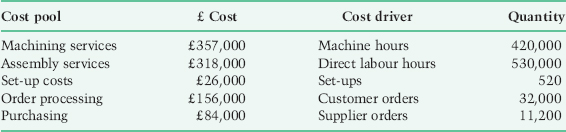
Table 13.17 Brixton Industries estimates.
- Prepare and present a profit calculation showing the profitability of each product using traditional absorption costing.
- Prepare and present a profit calculation showing the profitability of each product using activitybased costing.
- Explain the differences between the product profitability using absorption and activity-based costing.
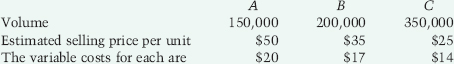
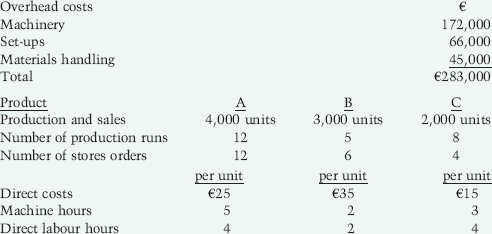
- Calculate the contribution per unit of volume (and in total) for each service. Which is the preferred service? Why? What should the business strategy be?
- Determine the absorption (full) cost per unit for the three services using three different methods of allocating overheads.
- How do the results of these different methods compare?
- Assuming a constant mix of the services sold, calculate the breakeven point for the business.