
Chapter 15
Performance Evaluation of Business Units
The shift towards a decentralized, multidivisional business structure and the measurement and management of divisional (i.e. business unit) performance has influenced the development of management accounting. This chapter introduces the structure of business organizations, with emphasis on the divisionalized structure and decentralized profit responsibility. This chapter describes the two main methods by which the performance of divisions and their managers is evaluated: return on investment and residual income. We also consider the issue of controllability and the transfer pricing problem and introduce the theory of transaction cost economics. This chapter suggests that some management accounting techniques may provide an appearance rather than the reality of ‘rational’ decision making.
Structure of business organizations
Emmanuel et al. (1990) described organizational structure as:
a potent form of control because, by arranging people in a hierarchy with defined patterns of authority and responsibility, a great deal of their behaviour can be influenced or even pre-determined (p. 39).
Child (1972) defined organization structure as ‘the formal allocation of work roles and the administrative mechanisms to control and integrate work activities’ (p. 2), emphasizing that structure depends on the decision-makers’ evaluation of environmental impacts, the standard of required performance and the level of performance actually achieved. This stresses the role of decision-makers, defined as the ‘power-holding group’ (p. 13).
Galbraith and Nathanson (1976) suggested that the choice of organizational form was the result of choices about five design variables: task; people; structure; reward systems; and information and decision processes. These choices should be consistent with the firm’s product–market strategy, i.e. there should be ‘fit’ or ‘congruence’. Galbraith and Nathanson applied Chandler’s (1962) four growth strategies – expansion of volume, geographic dispersion, vertical integration and product diversification – to see how each affects the form of organizational structure, based on Chandler’s thesis that structure follows strategy. They argued that:
Variation in strategy should be matched with variation in processes and systems as well as in structure, in order for organizations to implement strategies successfully (p. 10).
Galbraith and Nathanson further built on Chandler’s research, adding that diversification leads to multidivisional forms, with internal competition as an important variable.
Businesses produce products/services through a variety of organizational forms, but predominantly through either a functional structure or a divisionalized structure. The functional structure locates decision making at the top of the corporate hierarchy, with functional responsibilities for marketing, operations, human resources, finance and so on allocated to departments, as shown in the typical functional organization chart in Figure 15.1.
Figure 15.1 Functional organization chart.
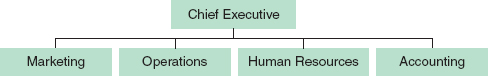
In the functional structure, accounting provides a staff function to the line functions, simplified here as marketing, operations and human resources. Accounting knowledge tends to be centralized in the accounting department, which collects, produces, reports and analyses accounting information on behalf of its (internal) customer departments.
The functional structure may be suitable for smaller organizations or those with a narrow geographic spread or a limited product/service range, but it is not generally suitable for larger organizations.
The divisional structure is based on a relatively small head office with corporate specialists supporting the chief executive, with business units established for major elements of the business. The advantage of the divisional structure is that while planning is centrally coordinated, the implementation of plans, decision making and control is devolved to local management who should have a better understanding of their local operations. The divisions are often referred to as business units to describe their devolved responsibility for a segment of the business. These business units may be based on geographic territories or different products/services, and each division will typically have responsibility for all the functional areas: marketing, operations, human resources and accounting. A typical divisional structure showing three divisions (or business units) is shown in Figure 15.2.
Figure 15.2 Divisional organization chart.

Management within divisions will carry out a significant function in analysing and interpreting financial information as part of their local management responsibilities, typically supported by locally based accounting staff. The role of accounting is quite different in a divisionalized structure as it is more focused on providing advice and information to local management to support planning, decision making and control, rather than carrying out the monitoring role accounting usually undertakes at the corporate head office. At the local level, accounting will typically be associated with more of the management accounting techniques described in this book than with financial reporting, which will more commonly be a head office role. Accounting therefore influences and is influenced by the organizational structure adopted and the extent of delegated managerial responsibility for business unit performance.
Business units are, in accounting, termed responsibility centres. Responsibility centres are business units which, through their managers, are held responsible for achieving certain standards of performance. There are three types of responsibility centres for divisionalized businesses:
- Cost centres – where managers are responsible for controlling costs within budget limits. Managers are evaluated on their performance compared to budget in keeping costs within budget constraints.
- Profit centres – where managers are responsible for sales performance, achieving gross margins and controlling expenses, i.e. for the ‘bottom-line’ profit performance of the business unit. Managers are evaluated on their performance compared to budget in achieving or exceeding their profit target. They have more flexibility than cost centres because they are usually able to exceed their cost budget provided they meet or exceed their profit targets.
- Investment centres – where managers have profit responsibility but also influence the amount of capital invested in their business units. Managers are evaluated based on a measure of the return on investment made by the investment centre. These managers have even more flexibility because they are able to influence their return on investment not only by increasing profits but by reducing the level of investment in their business units.
The decentralized organization and divisional performance measurement
While the evaluation of new capital expenditure proposals is a key element in allocating resources across the whole organization (see Chapter 14), a further aspect of strategy implementation is improving and maintaining divisional performance. Decentralization implies the devolution of authority to make decisions while divisionalization adds to decentralization the concept of delegated profit responsibility (Solomons, 1965). Solomons is recognized for having written the earliest and what remains the definitive text on divisional performance evaluation.
Divisionalization makes it easier for a company to diversify, while retaining overall strategic direction and control from a corporate head office. Performance improvement is encouraged by assigning individual responsibility for divisional performance to managers, typically linked to executive remuneration (e.g. bonuses, profit sharing, share options). Since shareholder value is the criterion for overall business success, so divisional performance is the criterion for divisional success. However, divisional performance measurement has also moved beyond purely financial measures to incorporate the drivers of financial results, i.e. non-financial performance measures (see Chapter 4).
Solomons (1965) highlighted three purposes for financial reporting at a divisional level:
The decentralization of businesses has removed the centrality of the head office in larger organizations with its functional structure and many support functions are now devolved to business units, which may be called subsidiaries (if they are legally distinct entities), divisions or departments. For simplicity, we will use the term divisionalization although the same principle applies to any business unit. Divisionalization allows managers to have autonomy over operational aspects of the business, but those managers are then accountable for the performance of their business units. While budgets and evaluating performance against budget are the subjects of Chapters 16 and 17, evaluating divisional performance is the subject of this chapter.
There are three methods by which divisional performance can be evaluated:
- absolute profit;
- return on investment;
- residual income.
In each case, we are trying to evaluate the performance of the business unit, and the performance of its management team.
Absolute profit
Under this method, the total profit (usually compared with budget) is the method by which divisional performance is evaluated. Although it is easy to use, being based on standard financial reports, absolute profit is not a good measure because it does not consider the investment in the business or how long-term profits can be affected by short-term decisions such as reducing research, maintenance and advertising expenditure. These decisions will improve reported profits in the current year, but will usually have a detrimental long-term impact.
Return on investment
The relative success of managers can be judged by the return on investment (or ROI, which was introduced in Chapter 7). This is the rate of return achieved on the capital employed and was a method developed by the DuPont Powder Company early in the twentieth century. Using ROI, managerial and divisional success is judged according to the rate of return on the investment. As we saw with capital expenditure evaluation in Chapter 14, if a business as a whole desires to achieve a particular ROI, then each investment must contribute to that ROI. Equally, with a divisionalized business, each division must contribute to overall business ROI, hence one way in which divisional ROI can be evaluated is by comparison to the ROI that is calculated from the company’s financial statements.
However, a problem with this approach is whether a high rate of return on a small capital investment is better or worse than a lower return on a larger capital. For example:
| Division A | Division B | |
| Capital invested | €1,000,000 | €2,000,000 |
| Operating profit | €200,000 | €300,000 |
| Return on investment | 20% | 15% |
Division B makes a higher absolute profit but a lower return on the capital invested in the business. While there will always be pressure to improve operating profits, measuring ROI also emphasizes the elimination of under-utilized assets (in Chapter 7 we said that the only reason a business invests in assets is to generate sales and profits).
Solomons (1965) argued that a decision cannot be made about relative performance unless we know the cost of capital, something which we introduced in Chapter 14.
Residual income
A different approach to evaluating performance is residual income, which takes into account the cost of capital. Residual income (or RI) is the profit remaining after deducting the notional risk-adjusted cost of capital from the investment in the division. The RI approach was developed by the General Electric Company and more recently has been compared with Economic Value Added (EVA, see Chapter 2), as both methods deduct a notional cost of capital from the reported profit. Using the above example:
| Division A | Division B | |
| Capital invested | €1,000,000 | €2,000,000 |
| Operating profit | €200,000 | €300,000 |
| Less cost of capital at 17.5% | €175,000 | €350,000 |
| Residual income | €25,000 | −€50,000 |
As the cost of capital is 17.5% in the above example, Division A makes a satisfactory return but Division B does not. Division B is eroding shareholder value while Division A is creating it.
The aim of managers should be to maximize the residual income from the capital investments in their divisions. However, Solomons (1965) emphasizes that the RI approach assumes that managers have the power to influence the amount of capital investment. Solomons argued that an RI target is preferred to a maximization objective because it takes into account the differential investments in divisions, i.e. that a larger division will almost certainly produce – or should produce – a higher residual income. Johnson and Kaplan (1987) believe that the residual income approach:
overcame one of the dysfunctional aspects of the ROI measure in which managers could increase their reported ROI by rejecting investments that yielded returns in excess of their firm’s (or division’s) cost of capital, but that were below their current average ROI (p. 165).
One of the problems with both the ROI and RI measures of divisional performance is the calculation of the capital investment in the division: should it be total (i.e. capital employed) or net assets (i.e. equity)? Should it include only non-current assets, or both non-current and current assets? Should non-current assets be valued at cost or written-down value (i.e. net of depreciation?) Should the book value be at the beginning or end of the period? Solomons (1965) argued that it was the amount of capital put into the business, rather than what could be taken out, that was relevant. The investment value, according to Solomons, should be total assets less controllable liabilities, with non-current assets valued at cost using the value at the beginning of the period. ROI calculations therefore relate controllable operating profit as a percentage of controllable investment. An RI approach would measure net residual income plus actual interest expense (because the notional cost of capital has already been deducted in calculating RI) against the total investment in the division.
One of the main problems in evaluating divisional performance is the extent to which managers can exercise control over investments and costs charged to their responsibility centres. Hence controllability is an important element in the performance evaluation of business units.
Controllability
The principle of controllability, according to Merchant (1987, p. 316), is that ‘individuals should be held accountable only for results they can control’ (p. 336). One of the limitations of operating profit as a measure of divisional performance is the inclusion of some costs over which the divisional manager may have no control. The need for the company as a whole to make a profit often results in corporate costs being allocated to divisions so that these costs can be recovered in the prices charged. The problem arises when a division’s profit is not sufficient to cover the head office charge. Solomons (1965) argued that so long as corporate expenses are independent of divisional activity, allocating corporate costs is irrelevant because a positive contribution by divisions will cover at least some of those costs (we introduced this concept in relation to market segmentation in Chapter 10).
Solomons separated the controllable from non-controllable components in the divisional profit report, a simplified example of which is shown below:
| Sales | £1,000,000 | |
| Less variable cost of goods sold | £200,000 | |
| Other variable expenses | £100,000 | £300,000 |
| Contribution margin | £700,000 | |
| Less controllable divisional overhead | £250,000 | |
| Controllable profit for division | £450,000 | |
| Less non-controllable overhead | £175,000 | |
| Operating profit for division | £275,000 |
The controllable profit is the profit after deducting expenses that can be controlled by the divisional manager, but ignoring those expenses that are outside the divisional manager’s control. What is controllable or non-controllable will depend on the circumstances of each organization. While the business as a whole may consider the operating profit to be the most important figure for the business unit, performance evaluation of the manager should only be carried out based on the controllable profit. Solomons (1965) argued that the most suitable figure for appraising divisional managers was the controllable residual income before taxes. Using this method, the controllable profit is reduced by the corporate cost of capital. For decisions in relation to a division’s performance, the relevant figure is the net residual income after taxes.
The following case study provides an example of divisional performance measurement using ROI and RI techniques.
| Division A | Division B | |
| Current investment | $4 million | $20 million |
| Profit | $1 million | $2 million |
Table 15.1 ROI on original investment.
| A | B | |
| Current investment | $4 million | $20 million |
| Current profit | $1 million | $2 million |
| ROI | 25% | 10% |
Table 15.2 ROI on additional investment.
| A | B | |
| Additional investment | $1 million | $1million |
| Additional contribution | $200,000 | $130,000 |
| ROI on additional investment | 20% | 13% |
Table 15.3 RI on original investment.
| A | B | |
| Current investment | $4 million | $20 million |
| Current profit | $1,000,000 | $2,000,000 |
| Cost of capital @ 15% | $600,000 | $3,000,000 |
| Residual income (profit – cost of capital) | $400,000 | -$1,000,000 |
Table 15.4 RI on additional investment.
| A | B | |
| Additional investment | $1 million | $1million |
| Additional contribution | $200,000 | $130,000 |
| Less cost of capital @ 15% | $150,000 | $150,000 |
| Residual income | $50,000 | -$20,000 |
Transfer pricing
When decentralized business units conduct business with each other, an important question is what price to charge for within-company transactions, as this affects the profitability of each business unit. Transfer prices may be based on:
- Market price: where products/services can be sold on the outside market, the market price is used, including a normal profit margin. This is the easiest way to ensure that divisional decisions are compatible with corporate profit maximization. However, if there is no external market, particularly for an intermediate product – i.e. one that requires additional processing before it can be sold – this method cannot be used.
- Full cost or cost-plus: this method would recover both fixed and variable costs, with or without a profit margin included. This method has the same overhead allocation problem as identified in Chapter 13.
- Marginal cost: the transfer price is the incremental (or variable) cost incurred, with or without a profit margin included.
- Negotiated prices: this may take into account market conditions, marginal costs and the need to motivate managers in each division. It tends to be the most practical solution to align the interests of divisions with the whole organization and to share the profits equitably between each division. In using this method, care must be taken to consider differential capital investments between divisions, so that both are treated equitably in terms of ROI or RI criteria.
In an increasingly globalized marketplace, manufacturing, assembly and selling operations may take place in different countries. In these cases, transfer prices are often set with a goal of ensuring that reported profits are earned in countries where lower corporation tax is payable to maximize the after-tax earnings (and hence shareholder value) of the multinational corporation. These arrangements are consequently scrutinized by taxation authorities. In practice, many organizations negotiate transfer prices with taxation authorities and then adopt negotiated prices between divisions in order to avoid the demotivating effects of the other methods on different business units. However, in some Japanese companies (see Chapter 13 for a discussion of some Japanese management accounting practices) it is common to leave the profit with the manufacturing division, placing the onus on the marketing division to achieve better market prices.
However, transfer prices that are suitable for evaluating divisional performance may lead to divisions acting contrary to the corporate interest (Solomons, 1965). Therefore, an important issue in establishing a transfer price is the motivational effect that this may have on managers of both the buying and selling business units, who may prefer to buy and sell on the open market in order to maximize their divisional profits, ROI or RI, even if that results in detriment to the business as a whole.
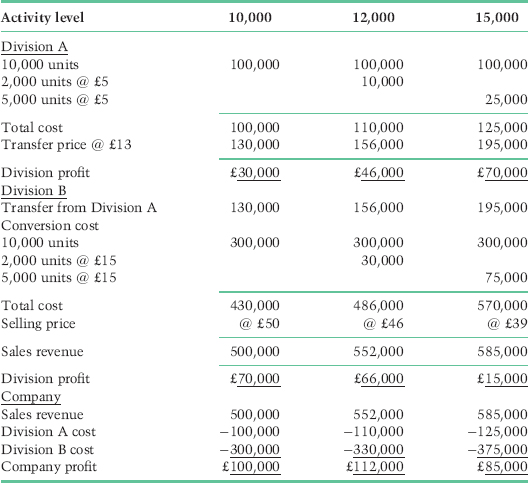
For example, consider a company with two divisions. Division A can produce 10,000 units for a total cost of £100,000, but additional production costs are £5 per unit. Division A sells its output to Division B at £13 per unit in order to show a satisfactory profit. Division B carries out further processing on the product. It can convert 10,000 units for a total cost of £300,000, but additional production costs are £15 per unit. The prices B can charge to customers will depend on the quantity it wants to sell. Market estimates of selling prices at different volumes (net of variable selling costs) are:
| Volume | Price |
| 10,000 units | £50 per unit |
| 12,000 units | £46 per unit |
| 15,000 units | £39 per unit |
The financial results for each division at each level of activity are shown in Table 15.5. Division A sees an increase in profit as volume increases and will want to increase production volume to 15,000 units. However, Division B sees a steady erosion of divisional profitability as volume increases and will seek to keep production limited to 10,000 units, at which point its maximum profit is £70,000. The company’s overall profitability increases between 10,000 and 12,000 units, but then falls when volume increases to 15,000 units. From a whole-company perspective, therefore, volume should be maintained at 12,000 units to maximize profits at £112,000. However, neither division will be satisfied with this result, as both will see it as disadvantaging them in terms of divisional profits, against which divisional managers are evaluated.
Table 15.5 Divisional financial results.
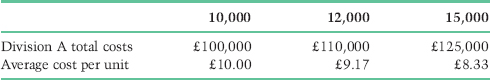
For Division A, variable costs over 10,000 units are £5, but its transfer price is £13, so additional units contribute £8 each to divisional profitability. A’s average costs reduce as volume increases, as Table 15.6 shows.
Table 15.6 Division A costs.
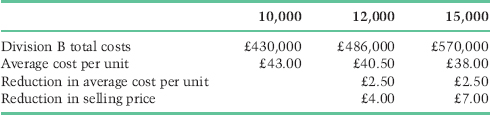
However, for Division B, its variable costs over 10,000 units are £28 (transfer price of £13 plus conversion costs of £15). The reduction in average costs of £2.50 per unit is more than offset by the fall in selling price (net of variable selling costs), as Table 15.7 shows.
Table 15.7 Division B costs.
Transaction cost economics
A useful theoretical framework for understanding divisionalization and the transfer pricing problem is the transactions cost (also called the markets and hierarchies) approach of Oliver Williamson (1975), a winner of the Nobel prize for economics, who was concerned with the study of the economics of internal organization. Transaction cost economics seeks to explain why some separate activities that require coordination occur within the organization’s hierarchy (i.e. within the corporate multi-divisional structure), while others take place through exchanges outside the organization in the wider market (i.e. between arm’s-length buyers and sellers).
The markets and hierarchies perspective considers the vertical integration of production and the decision about whether organizations should make or buy. Both bounded rationality (the assumption that decision-makers have limited information and limited ability to process that information in an uncertain and complex environment – see Chapter 4); and opportunistic behaviour (see Chapter 6 for a discussion of this in relation to agency theory) are assumed in this perspective. Transaction costs are affected by asset specificity, i.e. when an investment is made for a specific rather than a general purpose. They are also affected by uncertainty and the frequency with which transactions take place.
The work of business historians such as Chandler (1962) reflects a transaction cost approach in explanations of the growth of huge corporations such as General Motors (GM) in the first half of the twentieth century, in which hierarchies were developed as alternatives to market transactions. Recent trends, not only in the automotive industry, have reversed this with the strategy being to outsource as much production as possible to the lowest cost producer – automotive companies like GM, Ford and Toyota now only assemble vehicles, the components for which are manufactured by several tiers of suppliers.
Transactions are more than exchanges of goods, services and money. They incur costs over and above the price for the commodity bought or sold, such as costs associated with negotiation, monitoring, administration and insurance. They also involve time commitments and obligations, and are associated with legal, moral and power conditions. Understanding these costs may reveal that it is more economic to carry out an activity in-house than to accept a market price that appears less costly but may incur ‘transaction’ costs that are hidden in overhead costs. However, the high costs of market-related transactions can be avoided by specifying the rules for cooperative behaviour within the organization.
For managers using accounting information, attention is focused on the transaction costs associated with different resource-allocation decisions and whether markets or hierarchies are more cost effective. Under transaction cost economics, attention focuses on the transaction costs involved in allocating resources within the organization, and determining when the costs associated with one mode of organizing transactions (e.g. markets) would be reduced by shifting those transactions to an alternative arrangement (e.g. the internal structure of an organization).
Williamson (1975) argued that the desire to minimize transaction costs leads to transactions being kept within the organization, favouring the organizational hierarchy over markets. Markets are favoured where there are a large number of trading partners, which minimizes the risk of opportunistic behaviour. Recurring, complex and uncertain exchanges that involve substantial investment may be more efficiently undertaken when internal organization replaces market transactions. The efficiency of a transaction that takes place within the organization depends on how the behaviour of managers is governed or constrained, how economic activities are subdivided and how the management accounting system is structured. However, decision-makers may themselves indulge in opportunistic behaviour that causes the benefits of internal transactions to be reduced. Therefore, the management accounting system can be used to ensure that these internal transactions are conducted efficiently.
Rather than reflecting a concern with utility maximization (the assumption of agency theory), the transaction cost framework is more concerned with bounded rationality. While an agency perspective ignores the power of owners and also that of employees who can withdraw their labour, transaction cost theory gives recognition to power in the hierarchy that is used to coordinate production.
Conclusion: a critical perspective
In this chapter we have described the divisionalized organization and how divisional performance can be evaluated using return on investment (ROI) and residual income (RI) techniques. The divisional form is a preferred organizational structure because it allows devolved responsibility while linking divisional performance to organizational goals through measures such as ROI and RI that are meaningful at different organizational levels, particularly when these support shareholder value methods such as the link between RI and EVA. In this chapter we have also discussed the controllability principle and the transfer pricing problem and how these can lead to managers making decisions that benefit their divisions but may not be optimal for the organization as a whole.
However, a critical stance can be applied to the divisionalized form of organization. Roberts and Scapens (1985) argued that in a divisionalized company there is distance between the division and the head office, such that ‘the context within which accounting information is gathered will typically be quite different from the context in which it is interpreted’ (p. 452). Like the social construction perspective in Chapter 5, divisional managers and the corporate head office may see the same financial information in very different ways. This may result in manipulating the appearance of accounting reports. Roberts and Scapens concluded:
The image of an organization which is given through Accounts will be from a particular point of view, at a particular point in time and will be selective in its focus. Events, actions, etc. which are significant for the organization may be out of focus, or not in the picture at all . . . the image conveyed by the Accounts may misrepresent the actual flow of events and practices that it is intended to record (p. 454).
Managers are often critical that the corporate head office fails to distinguish adequately between controllable and non-controllable overhead. Research by Merchant (1987) identified that the controllability principle was not found in practice and that managers should be evaluated ‘using all information that gives insight into their action choices’.
Relationships between business units frequently cause friction, particularly in some organizations where the number of business units has been increased to a level that is difficult to manage. Transaction cost economics, a rational markets and hierarchies approach like agency theory (Chapter 6), provides a useful though limited perspective as it does not address the power relations between divisions and between divisions and the corporate head office. The political process inherent in transfer pricing between divisions is also evidenced in many multinational corporations, where transfer pricing has become more concerned with how to shift profits between countries so as to minimize income taxes on profits and maximize after-tax profits to increase shareholder value. While this is undoubtedly in the interests of individual companies and does need the approval of taxation authorities, it raises issues of the ethics of transfer pricing when multinationals minimize their profits and taxation in relatively high-tax countries such as the UK from which they enjoy many benefits.
References
Chandler, A. D. J. (1962). Strategy and Structure: Chapters in the History of the American Industrial Enterprise. Cambridge, MA: Harvard University Press.
Child, J. (1972). Organizational structure, environment and performance: the role of strategic choice. Sociology, 6, 1–22.
Emmanuel, C., Otley, D. and Merchant, K. (1990). Accounting for Management Control (2nd edn). London: Chapman & Hall.
Galbraith, J. R. and Nathanson, D. A. (1976). Strategy Implementation: The Role of Structure and Process. St Paul, MN: West Publishing Company.
Johnson, H. T. and Kaplan, R. S. (1987). Relevance Lost: The Rise and Fall of Management Accounting. Boston, MA: Harvard Business School Press.
Merchant, K. A. (1987). How and why firms disregard the controllability principle. In W. J. Bruns and R. S. Kaplan (Eds), Accounting and Management: Field Study Perspectives. Boston, MA: Harvard Business School Press.
Roberts, J. and Scapens, R. (1985). Accounting systems and systems of accountability – understanding accounting practices in their organizational contexts. Accounting, Organizations and Society, 10(4), 443–56.
Solomons, D. (1965). Divisional Performance: Measurement and Control. Homewood, IL: Richard D. Irwin.
Williamson, O. E. (1975). Markets and Hierarchies: Analysis and Antitrust Implications. A Study in the Economics of Internal Organization. New York: Free Press.
- original investment;
- additional investment; and
- total new level of investment.
- Calculate Green’s ROI currently, for the additional investment and after the investment.
- How will Green and Brummy Co. view this investment opportunity?
- Calculate the effect of the new investment opportunity on Green’s residual income.
| Compax | Newpax | |
| Initial capital investment | £6,400,000 | £5,200,000 |
| Net cash inflows (before tax) | ||
| Year 1 | £2,400,000 | £2,600,000 |
| Year 2 | £2,400,000 | £2,200,000 |
| Year 3 | £2,400,000 | £1,500,000 |
| Year 4 | £2,400,000 | £1,000,000 |
| Net present value (@ 16% p.a.) | £315,634 | £189,615 |
- Prepare accounting rate of return (ARR) and residual income (RI) calculations for the Compax and the Newpax for each year.
- Suggest which equipment is preferred under each method.
- Compare this with the NPV calculation.
| Division A | |
| Investment | €1,000,000 |
| Net profit | €75,000 |
| Division B | |
| Investment | €1,500,000 |
| Net profit | €90,000 |
| Division C | |
| Investment | €2,000,000 |
| Net profit | €150,000 |
- the current performance of each division; and
- which proposal the board should approve if finance limits the decision to a single proposal.
Table 15.8 Serendipity – capital investment evaluation.
