Chapter 16
Budgeting
This chapter explains the budgeting process. It begins with an overview of what budgeting is and the budgeting process, and then uses four case studies to illustrate both profit budgets and cash forecasts for service, retail and manufacturing businesses. The case studies show how sales, cost of sales and expense predictions are converted using inventory requirements into purchase budgets, and how the cash flow forecast links back to the Statement of Cash Flows that was described in Chapter 6. The chapter concludes with a behavioural perspective on budgeting, and a critique of budgeting.
What is budgeting?
Anthony and Govindarajan (2000) described budgets as ‘an important tool for effective short-term planning and control’ (p. 360). They saw strategic planning (see Chapter 14) as being focused on several years, contrasted with budgeting that focuses on a single year. Strategic planning:
precedes budgeting and provides the framework within which the annual budget is developed. A budget is, in a sense, a one-year slice of the organization’s strategic plan (p. 361).
Anthony and Govindarajan also differentiated the strategic plan from the budget, on the basis that strategy is concerned with product lines while budgets are concerned with responsibility centres. This is an important distinction, as although there is no reason that budgets for products/services cannot be produced (they tend to stop at the contribution margin level, perhaps because of the overhead allocation problem described in Chapter 13), traditional budgetary reports are produced for responsibility centres and used for divisional performance evaluation, as described in Chapter 15.
A budget is a plan expressed in monetary terms covering a future time period (typically a year broken down into months). Budgets are based on a defined level of activity, either expected sales revenue (if market demand is the limiting factor) or capacity (if that is the limiting factor). While budgets are typically produced annually, rolling budgets add additional months to the end of the period so that there is always a 12-month budget for the business. Alternatively, budgets may be re-forecast part way through a year, e.g. quarterly or six-monthly, to take into account changes since the last budget cycle (hence the common distinction made by organizations between budget and forecast; a forecast usually refers to a revised estimate, or a budgetary update, part-way through the budget period).
Budgeting provides the ability to:
- implement strategy by allocating resources in line with strategic goals;
- coordinate activities and assist in communication between different parts of the organization;
- motivate managers to achieve targets;
- provide a means to control activities; and
- evaluate managerial performance.
The budgeting process
There are four main methods of budgeting: incremental, priority based, zero based and activity based. Each is described below.
Incremental budgets take the previous year’s budget as a base and add (or subtract) a percentage to give this year’s budget. The assumption is that the historical budget allocation reflected organizational priorities and was rooted in some meaningful justification developed in the past.
Priority-based budgets allocate funds in line with strategy. If priorities change in line with the organization’s strategic focus, then budget allocations would follow those priorities, irrespective of the historical allocation. A public-sector version of the priority-based budget is the planning, programming and budgeting system (PPBS) that was developed for the US space programme. Under PPBS, budgets are allocated to projects or programmes rather than to responsibility centres. Priority-based budgets may be responsibility centre based, but will typically be associated with particular projects or programmes. The intention of PPBS and priority-based budgeting systems is to compare costs more readily with benefits by identifying the resources used to obtain desired outcomes.
An amalgam of incremental and priority-based budgets is priority-based incremental budgeting. Here, the budget-holder is asked what incremental (or decremental) activities or results would follow if budgets increased (or decreased). This method has the advantage of comparing changes in resources with the resulting costs and benefits.
Zero-based budgeting identifies the costs that are necessary to implement agreed strategies and achieve goals, as if the budget-holder were beginning with a new organizational unit, without any prior history. This method has the advantage of regularly reviewing all the activities that are carried out to see if they are still required, but has the disadvantage of the cost and time needed for such reviews. It is also very difficult to develop a ‘greenfields’ budget while ignoring ‘brownfields’ resource allocations.
Activity-based budgeting is associated with activity-based costing (ABC, see Chapter 13). ABC identifies activities that consume resources and uses the concept of cost drivers (essentially the cause of costs) to allocate costs to products or services according to how much of the resources of the firm they consume. Activity-based budgeting (ABB) follows the same process to develop budgets based on the expected activities and cost drivers to meet sales (or capacity) projections.
Whichever method of budgeting is used, there are two approaches that can be applied. Budgets may be top down or bottom up. Top-down budgets begin with the sales forecast and, using the volume of sales, predict inventory levels, staffing and production times within capacity limitations. These are based on bills of materials, labour routings and standard costs (see Chapter 11). For services, the top-down budget is based largely on capacity utilization and staffing levels needed to meet expected demand. In both cases, senior management establishes spending limits within which departments allocate costs to specific line items (salaries, travel, office expenses etc.). Senior managers set the revenue targets and spending limits that they believe are necessary to achieve profits that will satisfy shareholders. Bottom-up budgets are developed by the managers of each department based on current spending and agreed plans, which are then aggregated to the corporate total.
Top-down budgets can ignore the problems experienced by operational managers. However, boards of directors often have a clear idea of the sales growth and profit requirement that will satisfy stock market expectations. By contrast, the bottom-up budget may be inadequate in terms of ‘bottom-line’ profitability or unachievable as a result of either capacity limitations elsewhere in the business or market demand. Therefore, the underlying factors may need to be modified. Consequently, most budgets are the result of a combination of top-down and bottom-up processes. By adopting both methods, budget-holders are given the opportunity to bid for resources (in competition with other budget-holders) within the constraints of the shareholder value focus of the business.
Budgets are based on standard costs (see Chapter 11) for a defined level of sales demand or production activity. The budget cycle – the period each year over which budgets are prepared – may last several months, with budget preparation commencing some months before the commencement of each financial year. The typical budget cycle will follow a common sequence:
Budgeting will take place at the responsibility centre level (see Chapter 15), where good practice involves looking at the opportunities for earning income, the causes of costs and the business processes in use. Bidding for funds for capital expenditure to fund new initiatives or projects is an important part of budgeting because of the need for growth and continual improvement. The process of budgeting is largely based on making informed judgements about:
- how business-wide strategies will affect the responsibility centre;
- the level of demand placed on the business unit and the expected level of activity to satisfy (internal or external) customers;
- the technology and processes used in the business unit to achieve desired productivity levels, based on past experience and anticipated improvements;
- any new initiatives or projects that are planned and require resources;
- the headcount and historic spending by the business unit.
In preparing a budget it is important to carry out a thorough investigation of current performance, i.e. to get behind the numbers. For example, as many costs (particularly in service industries) follow headcount (as we saw in Chapter 12), it is essential that salary and related costs are accurately estimated, and the impact of recruitment, resignation and training is taken into account in cost and productivity calculations.
The complexity of the budget will depend on a number of factors, such as:
- knowledge of past performance;
- understanding of customer demand trends, seasonal factors, competition etc.;
- whether the business is a price leader or price follower (see Chapter 10);
- understanding the drivers of business costs (see Chapter 13);
- the control that managers are able to exercise over expenses.
How well these factors can be understood and modelled using a spreadsheet will depend on the knowledge, skills and time available to the business. Typically, budgets either at the corporate or responsibility centre level will contain a number of subjective judgements of likely future events, customer demand and a number of simplifying assumptions about product/service mix, average prices, cost inflation etc.
Once the budget is agreed in total, the budget needs to be allocated over each month. This should not be simply dividing the budget into 12 equal monthly amounts. The process of profiling or time-phasing the budget is commonly based on the number of working days each month and takes into account seasonal fluctuations etc. Profiling is important because the process of budgetary control (see Chapter 17) relies on an accurate estimation of when revenue will be earned and when costs will be incurred.
The profit budget
The sales, cost of sales and expense budget looks very much like an Income Statement, with substantially more detail for management than would be provided in the financial statements included in the Annual Report to shareholders. The budgeted profit would be profiled or time-phased over each accounting period (normally 12 monthly budgets) and would be supported by statistical data from which the income, cost of sales and expense projections were made. The case study of Superior Hotel illustrates the profit budget and how the figures in that budget are derived from the supporting statistical data.
Table 16.1 Service budget example: Superior Hotel – budget statistics.
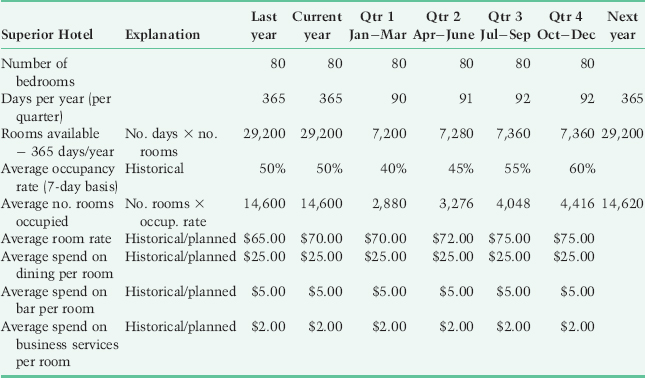
Table 16.2 Service budget example: Superior Hotel budget.

A budget for a retailer will require an estimation, separate from the sales forecast, of the level of inventory to be held. This results in a purchasing budget. Similarly, a budget for a manufacturing business will involve developing a production budget (materials, labour and overhead) by cost centre in order to produce the goods or services needed to satisfy the sales forecast and maintain agreed levels of inventory.
The first problem to consider is inventory, which is shown in Case study 16.2.
Table 16.3 Sports stores co-operative sales and expenses estimate.

Table 16.4 Sports Stores Co-operative inventory calculation.


Table 16.5 Sports Stores Co-operative closing inventory.

If we move from the example of a retailer to a manufacturer, the budget becomes more complex as budgeting must account for the conversion process of raw materials into finished goods. The third case study is the production budget for a manufacturing business.
Table 16.6 Telcon Manufacturing budget.

Table 16.7 Telcon Manufacturing Production budget.
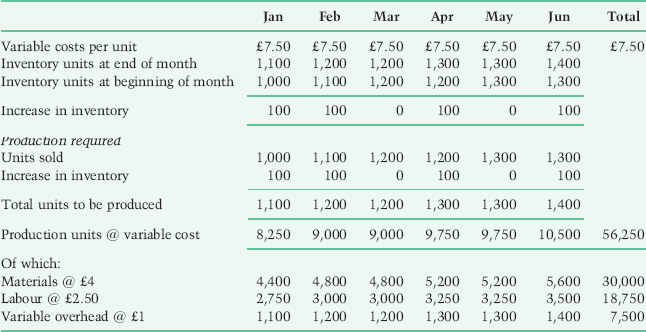
Table 16.8 Telcon Manufacturing Materials budget.

Cash forecasting
Once a profit budget has been constructed, it is important to understand the impact on cash flow. The purpose of the cash forecast is to ensure that sufficient cash is available to meet the level of activity planned by the sales and production budgets and to meet all the other cash inflows and outflows of the business. Cash surpluses and deficiencies need to be identified in advance to ensure effective business financing decisions, e.g. raising short-term finance or investing short-term surplus funds.
There is a substantial difference between profits and cash flow (for a detailed explanation see Chapter 6) because of:
- the timing difference between when income is earned and when it is received (i.e. receivables);
- increases or decreases in inventory for both raw materials and finished goods;
- the timing difference between when expenses are incurred and when they are paid (i.e. payables);
- non-cash expenses (e.g. depreciation);
- capital expenditure;
- income tax;
- dividends;
- new borrowings and repayments; and
- proceeds from new share issues and repurchases of shares.
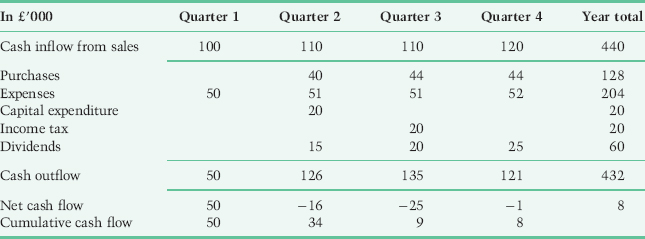
Case study 16.4 provides a cash forecasting example for a retail business.
Table 16.9 Retail News Group budget.

Table 16.10 Retail News Group sales receipts budget.

Table 16.11 Retail News Group purchase budget.

Table 16.12 Retail News Group supplier payments budget.

- capital expenditure of £2,500 committed in March;
- £3,000 of dividends due to be paid in June;
- a loan repayment of £1,000 due in February.
Table 16.13 Retail News Group cash forecast.

Table 16.14 Retail News Group Statement of Cash Flows (cash forecast).
| Operating profit | £8,625 | |
| Plus non-cash expense | ||
| Depreciation | 3,000 | |
| 11,625 | ||
| Less income tax paid | 5,000 | |
| Less increase in working capital − | ||
| Receivables | 1,000 | |
| Inventory | 300 | |
| Insurance prepayment | 3,000 | |
| 4,300 | ||
| Less increase in payables | 1,100 | |
| Net increase in working capital | 3,200 | |
| Cash flow from operations | 3,425 | |
| Cash flow from investing activities | ||
| Capital expenditure | 2,500 | |
| Cash flow from financing activities | ||
| Dividend | 3,000 | |
| Loan repayment | 1,000 | 4,000 |
| Decrease in cash | £3,075 |
A behavioural perspective on budgeting
Although the tools of budgeting and cash forecasting are well developed and made easier by the wide use of spreadsheet software, the difficulty of budgeting is in predicting the volume of sales for the business, especially the sales mix between different products or services and the timing of income and expenses. This is because there is uncertainty in terms of economic conditions, customer demand and competitor strategies.
As budget targets are often linked to managerial rewards (promotion, bonuses, share options, etc.) budgets result in behavioural consequences that are unintended, and often dysfunctional. Buckley and McKenna (1972) emphasized the importance of participation in the budget process; frequent communications and information flow throughout the organization; inclusion of the budget in decisions about salary, bonuses and career promotion; and clear communication by accountants to non-accountants as elements of ‘good budgeting practice.’ However, Buckley and McKenna also recognized the impact of setting difficult budget targets and the introduction of bias.
Lowe and Shaw (1968) carried out research into sales budgeting in a retail chain, in which annual budgeting was an ‘internal market by which resources are allocated’ (p. 304) in which managers had to cooperate and compete. Lowe and Shaw identified three sources of forecasting error: unpredicted changes in the environment; inaccurate assessment of the effects of predicted changes; and forecasting bias. Lowe and Shaw examined the sources of bias: the reward system; the influence of recent practice and norms; and the insecurity of managers, arguing that bias may be a common phenomenon as in ‘the desire to please superiors in a competitive managerial hierarchy’ (p. 312). They also explained counter bias as ‘the attempt by other managers to eliminate that part of a forecast which stems from the personal interest of the forecaster’ (p. 312).
Other behavioural problems have been recognized in relation to the budget process. One is with the aggregation of divisional budgets into a corporate budget. Operational managers often prepare their budgets with a degree of deliberate bias, e.g. understating sales projections and overstating expense projections in the hope that either: (i) if head office adjusts these budgets they will fall into line with what the manager wanted as a target in the first place; and/or (ii) managerial performance is perceived to be much better if the budget target is exceeded, hence the tendency by managers to set more easily achievable targets than might be set by head office. Berry and Otley (1975) explored the estimation of budget figures made by individuals at one hierarchical level in an organization, and the coupling of these estimates to those made at a higher level to show the resulting bias in estimating that takes place. Otley and Berry (1979) argued that quite mild deviations from ‘expectation budgets’ at the unit level can produce severe distortions when budgets are aggregated to the organizational level.
Reflecting interpretive or critical perspectives, budgets are one of the main sources of power in organizations, as a result of the influence of accountants over budgetary allocations. Czarniawska-Joerges and Jacobsson (1989) depicted budgets as:
a ritual of reason; budgets are presented according to and conforming with prevailing norms of rationality. Budgeting is also a language of consensus; there are several mechanisms in budgetary processes for reducing the level and amount of conflict (pp. 29–30).
Covaleski and Dirsmith (1988) argued that budgeting systems help to represent vested interests in political processes and maintain existing power relationships. In their case study of the introduction of diagnostic-related costing in hospitals, Covaleski et al. (1993) found that case-mix accounting systems ‘appear also to determine power by redistributing that power from physician to administrator’ (p. 73). Czarniawska-Joerges and Jacobsson (1989) depicted budgets as: ‘a symbolic performance rather than a decision-making process’ (p. 29).
A final word in relation to budgeting concerns risk. Collier and Berry (2002) identified risk as being managed in four different domains: financial, operational, political and personal. These were the result of the unique circumstances, history and technology in different organizations that had led to different ideas about risk. These domains of risk revealed how participants in the budgeting process influenced the content of the budget through their unique perspectives. Collier and Berry distinguished the content of budgets from the process of budgeting and contrasted three types of budget. In the risk-modelled process, there was an explicit use of formal probability models to assess the effect of different consequences over a range of different assumptions. In the risk-considered process, informal sensitivity (or what-if) analysis is used to produce (for example) high, medium and low consequences of different assumptions. The risk-excluded budget manages risk outside the budget process, and the budget relies on a single expectation of performance. Collier and Berry found that little risk modelling was used in practice, and that although risk was considered during the budgeting process, the content of the budget documents largely excluded risk.
A critical perspective: beyond budgeting?
Budgeting has been criticized in recent years because it can disempower the workforce, discourage information sharing and slow the response to market developments. Hope and Fraser (2003) suggested that budgets should be replaced with a combination of financial and non-financial measures, with performance being judged against world-class benchmarks. Business units could also measure their performance against comparable units in the same organization. This, it is argued, shifts the focus from short-term profits to improving competitive position over time.
The Beyond Budgeting Round Table (www.bbrt.co.uk; www.bbrt.org) was established over 10 years ago to find steering mechanisms that could replace budgeting and help to make organizations more adaptive to change. The membership includes (at the time of writing) American Express, John Lewis Partnership, Sydney Water, Telekom Malaysia and Toyota. BBRT has identified 10 reasons why budgets cause problems. They:
- are time consuming and expensive;
- provide poor value to users;
- fail to focus on shareholder value;
- are too rigid and prevent fast response;
- protect rather than reduce costs;
- stifle product and strategy innovation;
- focus on sales targets rather than customer satisfaction;
- are divorced from strategy;
- reinforce a dependency culture;
- can lead to unethical behaviour.
Compared with the traditional management model, ‘beyond budgeting’ is a more adaptive way of managing. In place of fixed annual plans and budgets that tie managers to predetermined actions, targets are reviewed regularly and based on stretch goals linked to performance against world-class benchmarks and prior periods. Instead of a traditional hierarchical and centralised leadership, ‘beyond budgeting’ enables decision making and performance accountability to be devolved to line managers and fosters a culture of personal responsibility. This, it is argued, leads to increased motivation, higher productivity and better customer service.
A strong view of the need for change has been presented by the Beyond Budgeting Round Table:
Budgeting, as most corporations practice it, should be abolished. That may sound like a radical proposition, but it is merely the final (and decisive) action in a long running battle to change organizations from centralized hierarchies to devolved networks. Most of the other building blocks are in place. Firms have invested huge sums in quality programs, IT networks, process reengineering, and a range of management tools including EVA, balanced scorecards, and activity accounting. But they are unable to establish the new order because the budget, and the command and control culture it supports, remains predominant (www.bbrt.org).
The origin of the Beyond Budgeting movement was a case study by Jan Wallander of Swedish bank Handelsbanken. Case study 16.5 providers a summary of Wallender’s paper.
Conclusion
In this chapter we have seen budgeting as an extension of the strategy process. We described various approaches to budgeting and the mechanics of the budgeting cycle. Through a series of four case studies we explored budgeting for a service, retail and manufacturing organization and introduced cash forecasting. The chapter concluded with a behavioural perspective on budgeting, and by drawing on the example of the ‘Beyond Budgeting’ movement and the case of Handelsbanken we questioned whether budgets are necessary at all. The assumptions behind the production of budgets are important for planning purposes, but crucial when managers are held accountable for achieving budget targets. This is the process of budgetary control, which is the subject of Chapter 17.
References
Anthony, R. N. and Govindarajan, V. (2000). Management Control Systems (10th edn). New York: McGraw-Hill Irwin.
Berry, A. and Otley, D. (1975). The aggregation of estimates in hierarchical organizations. Journal of Management Studies, May, 175–93.
Buckley, A. and McKenna, E. (1972). Budgetary control and business behaviour. Accounting and Business Research, Spring, 137–50.
Collier, P. M. and Berry, A.J. (2002). Risk in the process of budgeting. Management Accounting Research, 13, 273–97.
Covaleski, M. A. and Dirsmith, M. W. (1988). The use of budgetary symbols in the political arena: an historically informed field study. Accounting, Organizations and Society, 13(1), 1–24.
Covaleski, M. A., Dirsmith, M. W. and Michelman, J.E. (1993). An institutional theory perspective on the DRG framework, case-mix accounting systems and health-care organizations. Accounting, Organizations and Society, 18(1), 65–80.
Czarniawska-Joerges, B. and Jacobsson, B. (1989). Budget in a cold climate. Accounting, Organizations and Society, 14(1/2), 29–39.
Hope, J. and Fraser, R. (2003). Beyond Budgeting: How Managers Can Break Free from the Annual Performance Trap. Boston, MA: Harvard Business School Press.
Lowe, E. A. and Shaw, R. W. (1968). An analysis of managerial biasing: evidence from a company’s budgeting process. Journal of Management Studies, October, 304–15.
Otley, D. and Berry, A. (1979). Risk distribution in the budgetary process. Accounting and Business Research, 9(36), 325–7.
Wallander, J. (1999). Budgeting – an unnecessary evil. Scandinavian Journal of Management, 15, 405–21.
| January | £100,000 |
| February | £120,000 |
| March | £110,000 |
- Calculate how much will be received in March.
- What is the value of receivables at the end of March?

- Calculate the profit for each of the three months from July to September and in total.
- Calculate the cash balance at the end of each month.
- Prepare a Statement of Financial Position at the end of September.
- Construct a budget for East Division for the year based on the above figures.
- What can you say about the rate of gross profit?
| Quarter 1 | 100,000 tonnes |
| Quarter 2 | 110,000 tonnes |
| Quarter 3 | 105,000 tonnes |
| Quarter 4 | 120,000 tonnes |
| Salaries and wages | £3,000 for the first half year, increasing by 10% for the second half year |
| Maintenance | £1,500 |
| Council rates | £400 |
| Insurance | £120 |
| Electricity | £1,000 |
| Depreciation | £5,400 |
| Other costs | £2,500 in the first and fourth quarters, £1,800 in the second and third quarters |
| Interest | £600 |
| Capital expenditure | £6,500 in the first quarter, £2,000 in the second quarter, £1,000 in the third quarter and £9,000 in the fourth quarter |
| Dividend payment | £10,000 in the third quarter |
| Debt repayments | £1,000 in the first quarter, £5,000 in the second quarter, £4,000 in the third quarter and £3,000 in the fourth quarter |
Table 16.15 Placibo Ltd.
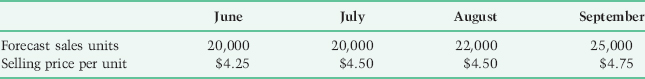
Table 16.16 Carsons Stores Ltd.
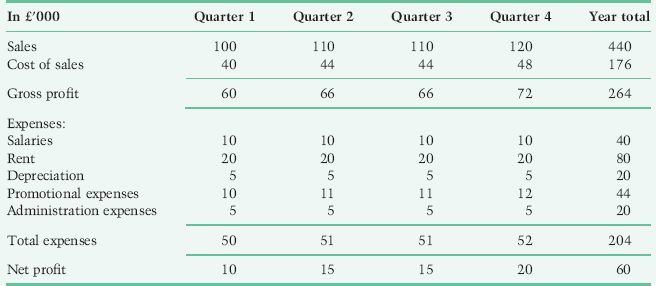
Table 16.17 Carsons Stores Ltd.