
To push back the physical limitations or to convert them into opportunities requires first that management understand what system of production its operations require and what the principles of that system are; and second that it apply these principles consistently and thoroughly. Production is not the application of tools to materials. It is the application of logic to work. The more clearly, the more consistently, the more rationally the right logic is applied, the less of a limitation and the more of an opportunity production becomes.
In the quotation above, Drucker points out that the role of the manager is to ensure that work is organized in a logical manner. In order to logically organize work, managers use tools to organize their thinking and to ensure that the work design that they use overcomes limitations (when possible) and allows production to create opportunities for their company.
Value stream maps are one tool that managers and others can use to visualize what must be done to serve the customer and what is currently being done to serve the customer. The value stream map makes the logic of a system visible. It creates a visual map of every step in the process and the current limitations of each step. It extends the simple process flow diagram—a value stream map shows the entire value stream for a product or service. The value stream map starts with how the inputs to the process are obtained and shows the steps through the process up to and including the delivery of the outputs to the customer.
A value stream is defined as:
All of the actions, both value-creating and nonvalue-creating, required to bring a product from concept to launch (… the development value stream) and order from delivery (… the operational value stream). These include actions to process information from the customer and actions to transform the product on its way to the customer. (Marchwinski, Shook, and Schroeder 2008, p. 109)
How to Create a Value Stream Map: Step 1—SIPOC Diagram
It is easiest to create a value stream map if you see it as a set of structured steps that need to be performed. The first step is to use a SIPOC diagram to obtain information that will be used in creating the value stream map.
The SIPOC diagram is a tool used to identify the relevant elements of a value stream. The name, “SIPOC,” is an acronym that stands for Supplier, Input, Process, Output, and Customer. A sheet of paper with a column for each letter—as illustrated in Table 7.1—can be used to gather data about the process. It is best to use a landscape layout.
The Supplier is the provider of the inputs. The supplier may be a department within the company or it may be an external supplier. The Inputs requirements can be either material or information. What determines if it is an input to the process is whether the process can proceed without it—if it can’t then it is an input. The requirements specify what the process needs to perform correctly on time. For example, if the Input is a credit report, the requirement may be that it should be provided by the supplier within 60 minutes of the request. These are the correct inputs and requirements of the process. If the process receives the credit report within the stated time, it can be correctly performed, otherwise the process is stopped.
Table 7.1 Supplier providing Input for Processes that provide Output for Customers (SIPOC)
S Supplier(s) |
I Inputs requirements |
P Process |
O Output(s) requirements |
C Customer(s) |
|
|
|
|
|
The Process consists of the steps that are internal within the company or department that is responsible for performing some transformation of the inputs into something else. Usually, this is the department of the manager who is doing the SIPOC analysis. For example, the credit report input from above could be used by the process as an input into a customer credit review. But, processes often consist of multiple steps. All of these steps are recorded in the process section of the SIPOC diagram. For example, if for those customers whose credit rating is satisfactory, the department uses the satisfactory credit rating to lease equipment to the customer, then the process would include a second step. This second step would be to prepare the lease documents. The point is to include all of the process steps that are performed.
The Output requirements identifies what is sent from the process to the customers and the requirements that this output must meet to provide a satisfactory input to the customer. The outputs are shown along with the requirements for the output. For example, the output of the process to review credit and lease equipment above would be a lease agreement, and the requirement might be that it be two pages maximum and include full terms and conditions and payment terms. The Customer is whoever receives the output of the process. There may be multiple outputs of a process and multiple customers.
SIPOC Diagram Example
Mary is the scheduling manager of a set of operating rooms (ORs) in a hospital. She has prepared the SIPOC diagram as shown in Table 7.2 as a first step in creating a value stream map. She is doing this in order to understand her process and the logic of how each portion of the work is conducted.
Mary’s process starts with a phone call from the office manager in a surgeon’s office to request time for the surgeon to conduct a particular procedure. The surgeon typically wants a slot in the OR that is immediately after any other surgery that he or she has scheduled.
When the scheduler receives the request for a particular type of surgery by a particular physician, they do several things. First, they look at the computerized schedule to see what days and time the surgeon is currently scheduled and whether there are suitable ORs available after one of the already scheduled surgeries. Second, they look at the physician’s preference card (this is actually a historical record of what special instruments and supplies the requesting surgeon requires for a particular surgery and the surgeon’s average time to perform that surgery). Finally, based on the room availability and the surgery’s equipment requirements, the scheduler suggests a time to the surgeon’s office manager who has been waiting on the phone.
Table 7.2 Example of SIPOC diagram for OR scheduling
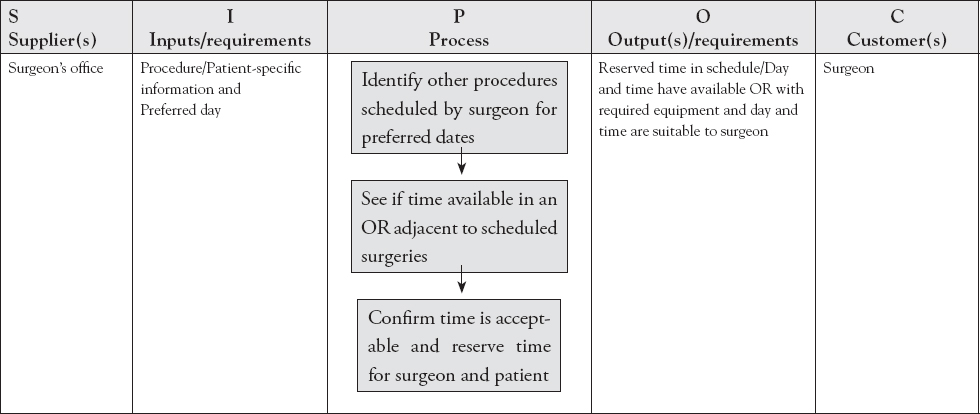
The surgeon’s office manager either accepts that time or requests a different time. Once a time is agreed upon, the scheduler then asks for more detailed information from the physician’s office manager. The information requested includes special instruments and supplies required by the surgeon; whether x-ray and lab tests need to be conducted during the surgery; and information about the patient. The scheduler confirms that all the instruments, supplies, x-ray, and lab tests will be available on the chosen date and confirms the reservation for the surgeon and patient. The data is sent to the schedule file, so that the time in a particular OR and the equipment and so on is reserved for that surgeon and for that patient.
This information is recorded in the SIPOC diagram moving from left to right. Note that the steps in the Process column are shown as a vertical process flow diagram. These steps may not be shown in great detail, but there has to be enough detail to provide the reader with an overview of the process. Note that both the input and output columns include the requirements that the process needs and that the process must provide for the process to operate successfully and to have a successful outcome.
How to Create a Value Stream Map: Step 2—The Value Stream Map
A value stream map is a simple diagram of the steps required in a process. As stated above, it gives more detailed information about the process and its limitations or constraints and performance than is provided by a process flow map. There are four general areas where a value stream map has more information than a process flow diagram.
- A value stream map includes the customer, the supplier, and how the process is controlled.
- The value stream map includes more data about each activity than is included in the process flow diagram. This data is given in the data box below the activity.
- The value stream map includes a time line that shows the length of time that a flow unit is in process and the length of time the flow unit is waiting. The time in which a unit is in process typically adds value to the process. Therefore it is also referred to as value added time. It is this time that the customer is typically willing to pay for.
- The value stream map includes decisions about how work is prioritized at each work station. For example, is the work to be done selected based on First-In-First-Out (FIFO) order, or is the job to be done selected on some other basis such as due date?
Similar to process flow maps the value stream map that is originally created is of the current process. So, this value stream map is usually referred to as the Current-State Value Stream Map. This may be used as a basis to create a picture of the desired future state, which is usually referred to as the Future-State Value Stream Map.
Figure 7.1 illustrates some symbols used in a value stream map. The value stream map uses a large variety of symbols. The purpose of this is to communicate a lot of information using visual symbols instead of words.
Just as in the process flow map, a value stream map produced at one company may use slightly different symbols than one produced at a different company. Typically companies standardize the use of their symbols internally, so all employees use the same set of symbols. This improves the ability of employees to communicate with each other.
All of the symbols in Figure 7.1 are typically not used in process flow maps except for the Triangle and Block Arrow symbols. The Customer or Supplier symbol identifies who receives the outputs and who provides the inputs, respectively. The Truck Transport symbol could be replaced by a train symbol or an airplane symbol. This visually shows how the inputs arrive or the outputs are delivered and it shows the frequency within the transportation symbol (e.g., 1 × the week). The Process symbol is a set of rectangles stacked on top of each other. The top rectangle gives the operation title, while the data about the operator is shown in the symbol’s second rectangle. The Data Box provides detailed information about the process step being performed. The FIFO lane symbol visually represent whether the process selects the next input to be processed using FIFO or whether it uses a different selection method. The Electronic Communication symbol either looks like a sharp sine wave, or a snake. It visually shows whether the data is sent electronically and thus, not on paper. The Paper or Personal communication symbol is a straight arrow, and it visually shows how information is delivered.
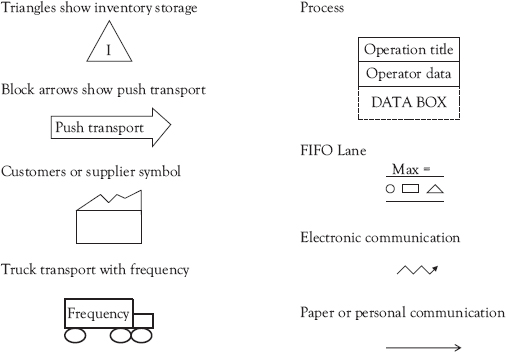
Figure 7.1 Legend for value stream map symbols
Example of Creating a Value Stream Map
In Table 7.3 is a SIPOC diagram that provides the basis for creating a Current Value Stream Map (Current VSM) for the Hot Bagel Company (HBC).
This SIPOC diagram is used to create the current value stream map for HBC. The first step in creating the Current VSM is to start on the left and show the supplier (Red Hat Flour) and the delivery method and frequency. In Figure 7.2, Red Hat deliver by truck once a week to HBC’s Flour warehouse. The warehouse is identified inside the triangle symbols, which is typically used to show storage. The method by which Red Hat receives the order is shown as an electronic communication using the jagged arrow. A text box is placed on this arrow to show that the order is sent once a week. Notice that it is the production supervisor who sends the weekly order. The second step is to show how the production supervisor obtains the information to place the order. This is being provided via a weekly forecast of sales that is based on the actual sales data. The sales data is in a cylinder, which means that it is data in a database. The input to the sales data was the customer of the process, that is, the HBC stores.
Table 7.3 Example of SIPOC diagram for HBC
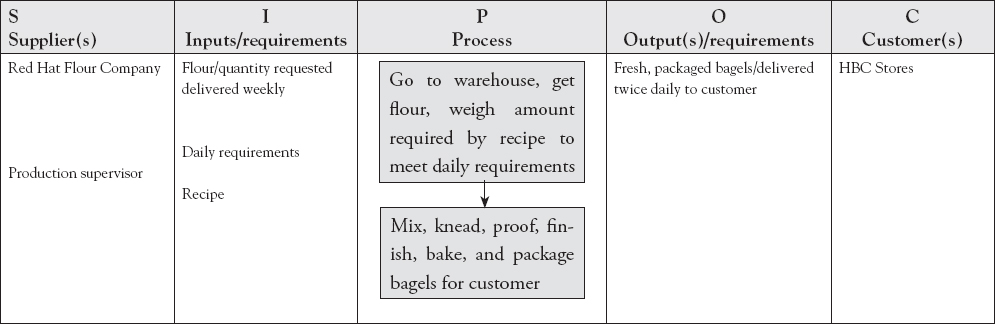
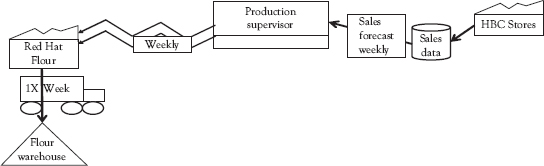
Figure 7.2 First stages in creating the current value stream map for HBC
The customers of HBC are its own chain stores. This is shown below on the right hand side. Notice that the customer (i.e., HBC Stores) is on the right hand side of this VSM and the supplier is on the left-hand side. The production supervisor who controls the process is in the middle. The arrows between the stores and the production supervisor are straight because there is no electronic communication between them in this process. The arrows on the left side from the production supervisor to the supplier (Red Hat Flour) are not straight to show that this is electronic communication. The transport method from the supplier to the storage area (i.e., flour warehouse) is illustrated with a picture of a truck, with the frequency of delivery shown as one time a week.
At HBC, bagels are made daily in a series of steps. The Bagel Meister gets the order from the production control supervisor about the number of each type of bagel that are needed. Once the Bagel Meister has the order, the Bagel Meister goes to the store room, removes the flours, and transports them to the scale and weighs the appropriate flour (e.g., rye, white, whole wheat) into a mixing container (T = 10 minutes). This container with the weighed flour is then taken to the Mix and Knead station where it sits to wait for this step. This station has a different Operator who does the work in FIFO sequence.
The mixer operator adds (T = 2 minutes) the other ingredients (e.g., salt, yeast, sugar) and then mixes for 5 minutes. After mixing, the mixer operator kneads it for 10 minutes in the same work station. Then the mixer operator takes the kneaded dough on the kneading board to the proofing room and leaves it to rest for 60 minutes (it should double in size). There is no operator in the proofing room.
When ready, the Forming Cook removes the dough from the proofing room and takes it to the finish room, where it is punched down and formed into a rope (10 minutes). The Forming Cook cuts the rope into 5 inch pieces. Once the entire batch is cut into 5 inch pieces, the Forming Cook stretches the last half inch of each end of the 5 inch piece about half inch so that there is a gentle taper on the last inch of both ends. After stretching each piece, before putting it down, the Forming Cook shapes it into a circle. Then it is placed on a floured pan (Total time for a batch to be formed into circles in the pan is 15 minutes). They are then transported to the cook.
The cook takes the bagels from the proof box and drops them into a boiling pot of water. It takes the cook 1 minute to do this. The bagels stay in the water for 4 minutes. It takes the cook 5 minutes to remove them from the water, put them in a pan, and put them in the oven for 20 minutes. The cook removes them from the oven and puts them on a cooling tray (T = 1 minute). After 15 minutes to cool, the bagels are taken to packaging.
The cooled bagels are packaged by one of two packing clerks. The bags are put into a marked case (T = 20 minutes/batch) for each store. The clerks select from the selection of cooled bagels, what is needed for them to complete an order for an individual store. Packaging is prioritized according to the next store that has a scheduled delivery. There are two deliveries a day from the HBC commissary to each HBC store.
The current value stream map that includes the individual processes is shown in Figure 7.3.
The production supervisor starts the process with a daily schedule that is given to the bagel meister. This is shown by the straight line from the production supervisor to the Bagel Meister. That there is only one bagel meister is shown by having only one smiling face ☺. The production supervisor also controls the process by sending a daily shipping schedule to the package department where the clerk uses it to pick orders for each shipment to the HBC store.
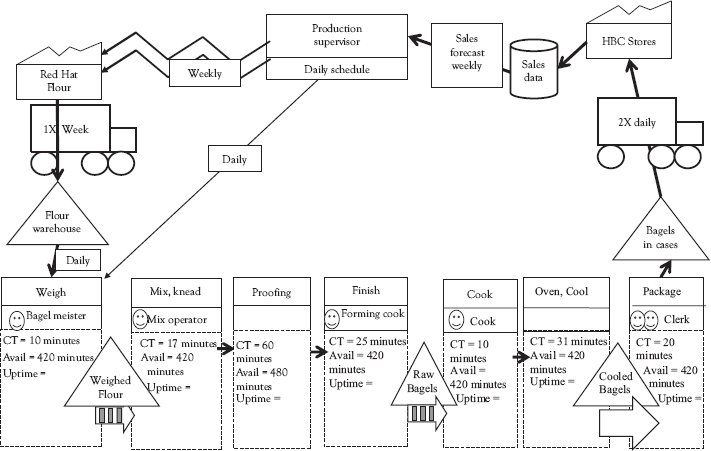
Figure 7.3 Current value stream map including process steps
The weighed flours sit in an inventory between the weigh process and the mix and knead process. This is shown by the triangle in the Current VSM. The block arrow with the vertical bars in it shows that the weighed flours are pushed forward by the bagel meister and are taken by the mix operator in FIFO sequence. The block arrow signifies a push and the bars signify FIFO. This does not mean that there is a FIFO lane, since the symbol for it is not the symbol given in Figure 7.1.
The lack of an operator in the proofing operator box means that this process depends on staff from the surrounding processes. This is also the situation with the cook and the oven and cool processes where the same cook operates both processes. However, in the package process there are two smiling faces, which means that there are two clerks doing this process.
The block arrow below the stored bagels between the oven, cool process, and the package process does not have bars in it. ![]() This means that it is not a FIFO process. However, using the block arrows implies that the prior process is pushing the inventory (i.e., bagels) to the packaging step. The same is true of the block arrow between the package process and the truck. The package process pushes the packaged bagels to the truck, but the truck is not necessarily taking them in FIFO order. As we read in our description of the process above, it follows urgency of delivery to each store.
This means that it is not a FIFO process. However, using the block arrows implies that the prior process is pushing the inventory (i.e., bagels) to the packaging step. The same is true of the block arrow between the package process and the truck. The package process pushes the packaged bagels to the truck, but the truck is not necessarily taking them in FIFO order. As we read in our description of the process above, it follows urgency of delivery to each store.
The truck symbol placed between the package process and the HBC store customer in the Current VSM shows the frequency of deliveries (two times a day here) and the method of delivery (by truck).
The final step in creating the current value stream map is to add a time line on the bottom as shown in Figure 7.4. The purpose of this time line is to illustrate the ratio of the value added time to the total time in the process. The lower this ratio the less efficient is the process in creating value for the customer.
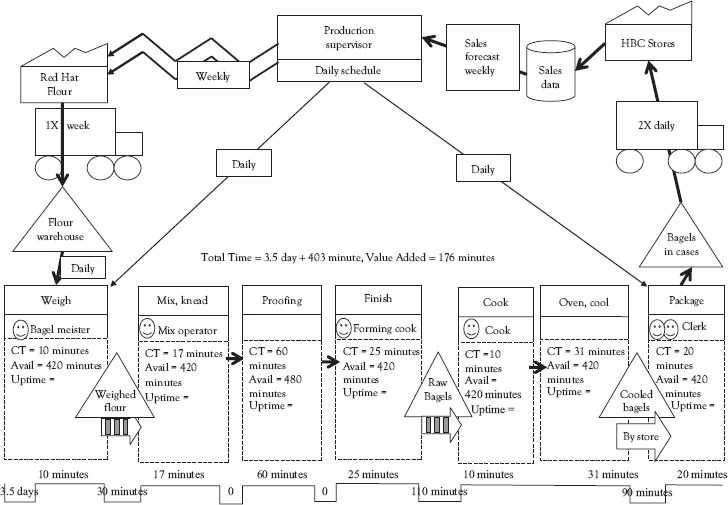
Figure 7.4 Current value stream map including value added time
The timeline in Figure 7.4 shows the differences between the value added time and the waiting times by placing the times in different horizontal lines.
The time lines are shown below the processes in Figure 7.4. In the HBC time line, the time waiting is shown on the bottom line. The value added time is shown on the line above the time waiting line. In this example the 3.5 days wait below the weigh process is the average time the flour sits in the warehouse storage before it is used. It is 3.5 days because flour is delivered once a week and is used at the same rate each day and is assumed to be gone when the next delivery arrives. Since people like fresh bagels each day, HBC works 7 days a week.
The value added time for the weigh process is given on the upper of the two lines below the process box. The value added time is the same as the cycle time (CT) given in the databox for the weigh process. This is repeated for each process and both the total time and the value added time are summed. This shows that the value added time is 176 minutes of the total time in the process of 403 minutes but also that the total flow time of the flour from arrival to shipping is actually 3.5 days plus 403 minutes. Since an operating day at HBC is 480 minutes (8 hours × 60 minutes) it takes almost 4.5 days from the purchase of flour until flour is transformed into a product (i.e., bagels) that customers want to buy.
References
Drucker, P.F. 1954. The Practice of Management. New York: Harper.
Liker, J.K., and D. Meier. 2006. The Toyota Way Fieldbook: A Practical Guide for Implementing Toyota’s 4 Ps. New York: McGraw-Hill.
Marchwinski, C., J. Shook, and A. Schroeder, eds. 2008. Lean Lexicon: A Graphical Glossary for Lean Thinkers. 4th ed. Cambridge, MA: Lean Enterprise Institute.
Womack, J.P., and D.T. Jones. 2005. Lean Solutions: How Companies and Customers Can Create Value and Wealth Together. New York: Free Press.