
Visual Control Using Pull Systems
The way the plant had functioned previously—with flows being pushed forward without any concern for the assembly unit’s actual needs—had understandably kept the employees from feeling at home in the plant.
—Greif (1991, p. 24)
… in the Toyota system … the people of a certain process go to the preceding process to withdraw the necessary units in the necessary quantities at the necessary time. The preceding process produces only enough units to replace those that have been withdrawn. This method is called the pull system.
—Monden (1993, p. 6)
Kanban and kanban systems are nothing more than a means and their essence lies in the thorough going improvement of production systems.
—Shingo (1989, p. 188)
The quotes above illustrate that many managers view the pull system as an important part of the visual control system, which we discussed in the previous chapter (Chapter 5). An important point is made by Shingo— the pull system is to involve everyone in continuous improvement of the system. As everyone improves the flow of materials and of work, workers start to feel that their work space belongs to them. The pull system gives them this feeling of ownership.
Fundamentally, the pull system is a simple method of performing work only when it is needed. It supports improvement by making the flow of work visible and ensures a swift and even flow of work—every worker needs to seek out and eliminate hidden wastes. As Shingo (1989) points out, the use of a pull system as kanban (which was used at Toyota) is actually a means of achieving process improvement.
What Is a Pull System?
A pull system is essentially an input/output control system (Wight 1970). The input and output control system means that the output from a production or service process determines the input to that process. This means only if work leaves (i.e., there is output) is work allowed to enter (i.e., input) the process. The information for regulating input to the process is provided using feedback about the throughput (i.e., the output) from the process. In a pull system, work is given to a station or to a worker, only when two conditions are met: (1) they are ready to work (i.e., they are not working on something else) and (2) there is demand for the work.
A simple way to realize a pull system is to limit the amount of work or load that is in the production (or service) process. This is done by allowing work to enter the process only if the work currently in the process is below a certain limit. This can be realized automatically, so that when one piece of work is completed (i.e., leaves the system), more work can enter the system—but, only if the total amount of work that is then in the system does not exceed the upper limit.
The pull system is a means of achieving visual control within a facility.
i. |
It reduces inventory, which often hides problems or makes it difficult to understand the material flow. |
ii. |
It creates signals about when to start working on a job and when to move inventory. |
The pull system is not a magical solution to problems. What the pull system does is turn the process into a visible control system. It creates visible feedback loops and information flows. As shown in Figure 6.1, two work processes are connected to each other, not only by the material flowing between them but also by the information flowing between them. By making the feedback visual, everyone involved knows what is happening at each point in time.
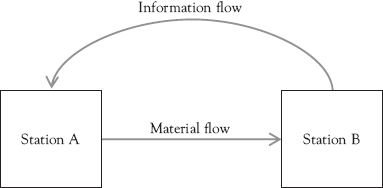
This information feedback tells the producer when more material is needed and identifies any problems in the quality or delivery of the material. Thus, user and producer communicate over a structured channel with each other, which allows for coordination. This ensures that material flows from the producer to the user only when it is needed or just-in-time. This means, there will be no unrequired work-in-process (WIP) on the shop floor and overall WIP will be reduced.
How Does a Pull System Work?
In a pull system, work or jobs are released using signals so that the workload on the shop floor stays within limits. Hopp and Spearman (2004) argue that it is the limit of work—or WIP Cap—that is allowed into the workplace at any time that creates a pull system.
There are multiple signals that can be used. Kanban cards are the most widely known signal. These are discussed in a separate section that follows. But there are many other signals as, for example, andon lights. For these signals to be effective, they have to mean that the unit sending the signal is ready for work. The signaling systems can be sophisticated or they can be very simple.
Example: One example of a simple signaling system that was easily installed in a factory was a light switch. A pallet of cut metal parts was used as raw material in the process of department B. The pallet was made by a department in another building, which was physically separated from the user in department B. The plant manager had an electrical circuit run between the producer and the user in department B. When a worker in department B took a pallet of material, they pushed a switch, which turned on a light that was below a sign in department A, telling A what to make. When A had made the material, they then shut off the light and signaled a forklift driver to come and pick it up and move it.
Kanban Cards and Other Pull Systems
Lean systems prefer visible feedback about the throughput of the system. The most famous examples of making throughput visible are kanban cards or kanban containers. These are requests for work to be performed and are strict limits on the amount of work to be done.
The kanban production and inventory control system was introduced into Toyota during the late 1950s. This system allows movement of material or the manufacturing of material only when authorized by a card (Kanban means card in Japanese). It allowed Toyota to implement a supermarket system in its factories. In this system, as in a supermarket, when a customer pulls material off of the shelf to put into their cart, an employee views the empty shelf space as a signal to restock the shelf, and goes to get more material to put onto the shelf.
Note, however, that the kanban (supermarket) system can be characterized as “incomplete synchronization,” in that the system needs inventories between workstations, as opposed to the Ford idea of seamless conveyor networks. There is an interesting contrast between the Ford and Toyota systems: What Ford … achieved in practice was essentially partial adoption of complete synchronization, while Toyota’s efforts can be seen as thorough adoption of incomplete synchronization. (Fujimoto 1999, p. 59)
The basic concept is that the downstream department comes to the upstream department to obtain material to work with. The amount of material is controlled by the size of the kanban container. By combining the use of kanban containers with supermarkets (see next section), a higher level of control can be obtained. Both the production and user quantities will be one container. The use of the kanban container system with the supermarket will ensure that the rate of production matches the rate of consumption. Units will only be produced when they are used. For example, if the kanban container has room for 20 parts to be placed into it, it is moved to the production location when it is empty and the production location only moves it back to the storage location when there are 20 parts in it.
In the example below (Figure 6.2), when User Part A finishes a container of Part A, they take it to the supermarket and put the empty container into the area for empty containers. They then take the next container of Part A from the supermarket shelf. When Producer of Parts A, B, and C is ready to work on another part, they take the box of parts they had just finished to the supermarket and then take the next empty container to fill it. This empty container is then taken back to their work area. The card on the side of the container includes the work instructions, such as the part number, quantity, and so on. In this way, work is literally pulled. In our example, User Part C is not using that part right now, so there is no demand for the part and the producer will not make it as long as there is no demand for it. The production is controlled to match the rate of usage by limiting the amount of inventory that can be in the system using the supermarket.
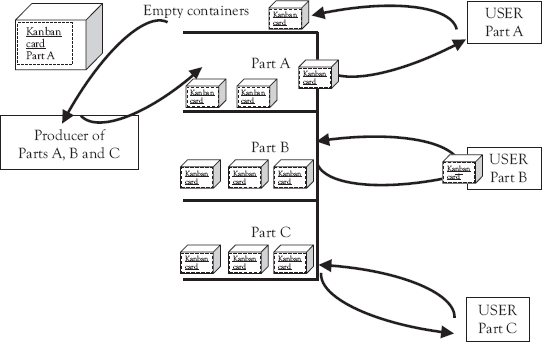
Figure 6.2 Supermarket with kanban containers
The function of a Supermarket is to decouple two parts of the system using inventory. It is based on the supermarket we all know when we go shopping. This is why it is called “supermarket.” Taiichi Ohno took the idea for the supermarket from photos of American supermarkets where goods were simply placed in shelves for withdrawal by customers (Ohno 2013). This was different from the Japanese system at that time, which was similar to deliveries from a vendor, such as an iceman, who would come to a home once a week. This resulted in housewives (or men) buying more than needed at that time, just so they could be sure they had enough. The supermarket system allowed the housewife (or man) to go to the supermarket only if they need something. This meant there was less waste since only items that were needed would be purchased.
As Mr. Ohno and I parted, he commented that his shop floor workers inevitably produced too much. His remark has stayed with me; even today I believe the true significance of the kanban system is that it addresses that very problem. (Shingo 1989, p. 168)
Supermarkets are one means of keeping work controlled and limited. They do this by creating a visible storage point for inventory used within the process. To be effective they are located near where the inventory in the supermarket originates. In this way when the inventory is removed from the supermarket a signal can be quickly sent to the process that is responsible for producing and replacing the inventory.
Level Production (Heijunka)—A Tool in the Pull System
One tool used in lean to reduce variance between the shop floor and customer demand is to level production. Production leveling means that the peaks and valleys of demand are leveled so that the demand experienced by the shop has less variance. This can be done by using a pre-shop buffer pool that releases work to the shop in a way that the workload stays leveled. This makes it easier to ensure that the capacity available to do the work matches the amount of work that has to be done. A technique to do this in lean is called heijunka. Heijunka is a Japanese term, which means leveling the type and quantity of work over a fixed period of time.
Heijunka is a technique to level the amount of work being done in one period (i.e., levelization). By leveling the workload, the amount of information that has to be transmitted in each period is reduced, because the same amount of work will arrive in each period. This leveling of the workload is achieved by using a detailed production plan that is focused on reducing fluctuations in both output rate and product mix. To do this in a car assembly plant, the product mix will be distributed throughout the entire production shift. One model of car may require a high level of work from one or more workstations, while another model may require less work form these workstations. So, the mixed model production will reduce lot sizes for components and help balance the workload at each assembly station.
Example: Heijunka mixed model calculation for repetitive manufacturing
The ABC plant needs to produce 20,000 units a month. There are 20 working days in the month. The 20,000 units consist of four different models. Demand for model A is 8,000; demand for model B is 6,000; demand for model C is 4,000; demand for model D is 2,000. To develop a level, mixed-model schedule for this plant for a month:
- Divide the monthly production target by the number of working days in the month to get the target production for each day. Daily target = 20,000 per month/20 days per month = 1,000 units per day. Similarly, this can be done for each model, so that the daily target for A is 8,000/20 days = 400 units of A per day; for B it is 6,000/20 days = 300 units of B per day; for C it is 4,000/20 days = 200 units per day; and for D it is 2,000/20 days = 100 units per day. The sum of A, B, C and D each day is 1,000 units a day.
- Create a sequence for model production that minimizes the number of units produced adjacent to each other. The ratio of A:B:C:D is 4:3:2:1. Summing these gives a total of 10 units to be produced in a chunk of the sequence (4 + 3 + 2 + 1 = 10 units). Starting with D since it is the only singleton in the chunk and then moving to A, since it has the largest number in the sequence gives a sequence of DAXAXAXAXX, where the X are to be determined. Adding the B and C to the chunk so that there are as many other units between them as possible gives DABACABACB. The D is made every 10th unit. An A is made every 1.5 (6/4) units. A B is made every two units and a C is made every four units on average.
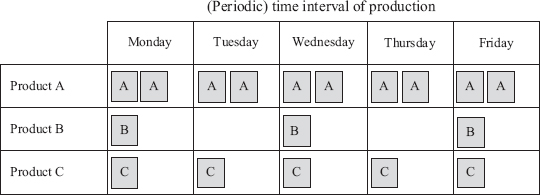
Figure 6.3 Heijunka box
The work schedule is typically represented in a heijunka box as illustrated in Figure 6.3. This makes the schedule visible for each resource and allows schedule deviations to be easily identified. For example, cards that should already be at the shop floor are still in the heijunka box.
For improvement activities to take place, every employee—from top management to terminal worker—must have and share a strong consciousness to eliminate the hidden wastes, abnormalities, and various other problems within the plant. These problems must be visible to every employee … (Monden 1993, p. 202)
Pull System as an Improvement System
The limits on performing work in the pull system can signal the need for improvement. Shingo (1989) gives an example where kanban cards drive improvement. If a system must stop or slow down because there are no available materials, then a problem has been identified. This is valuable information if the company then uses it to make an improvement.
There are four variables involved in production according to Hopp and Spearman (2004). There is variance in the system (whether due to demand or to variance in the process) and there are buffers to protect throughput from this variance. The three buffers are inventory, lead time, and capacity. They can be substituted for each other. For example, more capacity may allow us to operate with less inventory or too little capacity may force us to have longer lead times. Limiting the workload in a shop reduces the size of the inventory buffer. Little’s Law (i.e., Inventory = Throughput × Flow Time) explains that this inventory buffer reduction then reduces the flow time on the shop floor. It could increase pre-shop floor waiting time.
As stated above, not only does limiting work decrease flow time, but it can also drive improvement, because limited inventory in the system means that if there are any problems they become visible. This highlights the problem and allows for workers and managers to generate a problem solution. The importance of inventory reduction is discussed next.
Inventory Hides Problems
Inventory was often seen as a solution to handle the shop. Managers used the inventory as buffer to protect throughput from variance. Yet, as we know from Little’s law, the high inventory results in long flow times. Little’s Law is independent of the type of system used. It only says that there is a relationship between three variables—inventory, throughput rate, and flow time. By using the pull system, which includes limiting the inventory level, Little’s Law says that flow time will be reduced if the throughput rate remains the same.
Example: If the throughput rate is 30 widgets an hour and the inventory in the process is 90 widgets, then the flow time is: T = I/R = 90 widgets/(30 widgets/60 minutes) = 180 minutes. If the pull system allows us to reduce the inventory to 30 widgets, then the flow time is: T = 30/(30 widgets/60 minutes) = 60 minutes.
Lean prefers to control the level of inventory in a system by using a pull system as discussed above. This results in shorter lead times and facilitates continuous improvement. Since, the inventory can hide problems. As problems are hidden, they cannot be identified and solved. In general, the inventory serves as a good—and visible—thermometer, giving a rough measure of the health of the system. The higher the level of the inventory needed for the system to maintain throughput, the less healthy is the system.
This is illustrated in Figure 6.4—inventory can hide problems such as unreliable vendors, poor maintenance, and high levels of scrap. These problems can be made visible and thus solvable by reducing the inventory in one part of the process and seeing what happens. For example, is there a stockout at one part of the process? Is there a quality problem? Does a machine problem lead to a production stoppage? When the problem is identified, a team can be set up to solve this problem.
An important aspect is that the inventory serves as a buffer to protect the throughput. Therefore, if the inventory is reduced, another buffer (e.g., lead time or capacity) has to be provided. Otherwise the system may come to a halt and customer requirements may not be met. For example, Toyota reduced its shifts to two allowing a one shift capacity buffer if needed.
It is important to remember, however, that all the kanban system does is make the transmittal of information easy and prompt. It is nearly meaningless unless the production system itself has been improved through the adoption of the SMED system or one-piece-flows. (Shingo 1989, p. 186)
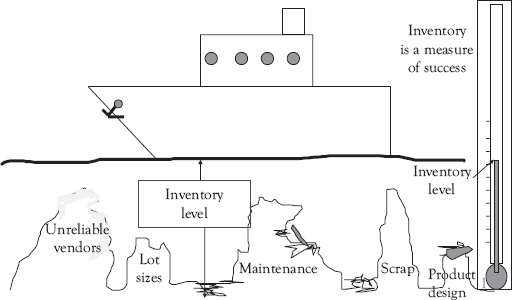
Figure 6.4 Inventory as a measurement of success
Implementing Pull Systems Using the Theory of Constraints
A separate system to accomplish a pull system was popularized by Elija Goldratt as a system he referred to as the Theory of Constraints (TOC). A central idea in Goldratt’s books (e.g., Goldratt and Cox 2004) is illustrated in Figure 6.5.
Figure 6.6 shows Goldratt’s concept of Drum-Buffer-Rope (DBR). The first step in implementing the system is to identify the bottleneck or the constraint in the system. What prevents achieving additional throughput from the system? This bottleneck can then be improved in multiple ways. First, it can be protected from system variance by putting a buffer of inventory in front of it. But didn’t we learn that inventory should be reduced to reduce the flow time? Inventory has to be carefully balanced. If it is too high, then it increases the lead times. But if it is too low then a work center may run out of work and be starving.
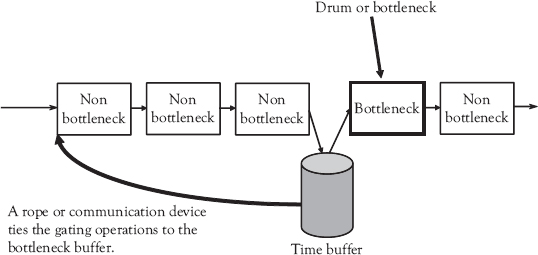
Figure 6.5 Drum-buffer-rope
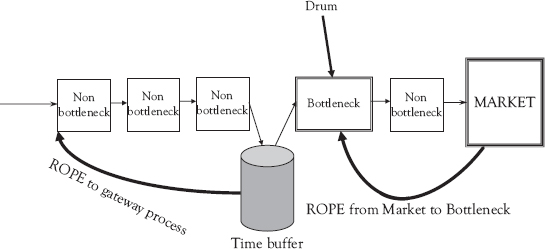
Figure 6.6 DBR includes the market
The buffer of inventory protects the bottleneck from system variance for a time period determined by the rate at which the bottleneck uses inventory. This calculation is based on Little’s Law. The rate of consumption from the time buffer is shared with the first nonbottleneck process or gateway process in the system. Since the second and third bottleneck processes can only produce what is sent to them by their preceding processes, limiting production of the gateway process to the rate of consumption of the bottleneck resource means that excess inventory does not grow between the gateway and the bottleneck.
Excess inventory cannot grow after the bottleneck since the nonbottleneck resources following the bottleneck only receive work from the bottleneck at the rate at which the bottleneck completes the work. So the entire system moves to the beat of the drum, which is the bottleneck process. The next step is to tie the bottleneck production rate to the consumption rate of the market (see Figure 6.7). This prevents overproduction of the inventory. In the figure below, the bottleneck is tied to the market by a rope or communication device that pulls production from the bottleneck when the market needs production.
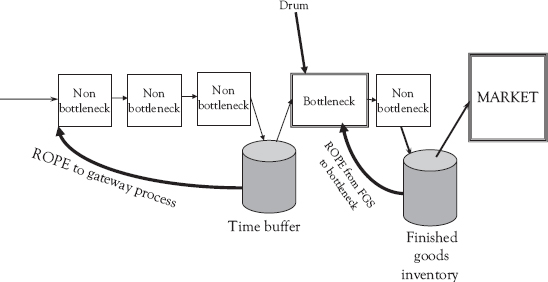
Figure 6.7 DBR with finished goods inventory
The lessons contained within this DBR concept are that controlling the release of work at the gateway work center to the bottleneck production rate limits WIP inventory to what is needed to protect the bottleneck (i.e., the time buffer). By limiting the production rate of the bottleneck to the market demand, the amount of finished goods inventory in the system is limited. This concept can be expanded to explicitly consider the finished goods inventory.
In Figure 6.7, the market wants the product immediately so it is stored in a warehouse or on a retailer’s shelves. The DBR heuristic limits the finished goods inventory by producing only at the rate of consumption. As inventory is consumed by the market, a signal is sent to the bottleneck to produce more to replace what has been consumed.
References
Fujimoto, T. 1999. The Evolution of a Manufacturing Systems at Toyota. London: Oxford University Press.
Goldratt, E.M., and J. Cox. 2004. The Goal: A Process of Ongoing Improvement. 3rd revised ed. Great Barrington, MA: North River Press.
Greif, M. 1991. The Visual Factory: Building Participation Through Shared Information. New York, NY: Productivity press.
Hopp, W.J., and M.L. Spearman. 2004. “To Pull or Not to Pull: What Is the Question?” Manufacturing & Service Operations Management 6, no. 2, pp. 133–48.
Monden, Y. 1993. Toyota Production System: An Integrated Approach to Just-in-Time. 2nd ed. Norcross, GA: Industrial Engineering and Management Press.
Ohno, T. 2013. TaiichiOhno’s Workplace Management, Special 100th Birthday Edition. Original Japanese edition, OhnoTaiichi No GenbaKeiei, 1982.
Shingo, S. 1989. A Study of the Toyota Production System from an Industrial Engineering Viewpoint. Cambridge, MA: Productivity Press.
Wight, O.W. 1970. “Input/Output Control: A Real Handle on Lead Times.” Production and Inventory Management Journal 11, no. 3, pp. 9–30.