Chapter 3. Measuring Depth, Directionally Drilled Wells, and Directional Surveys*
* For all figures in this chapter (in the printed book only), see the preface for information about registering your copy on the InformIT site for access to the electronic versions in color.
Introduction
Accurate subsurface maps require that the data used to construct those maps be placed in the correct X (latitude) and Y (longitude) position. For many maps, especially depth structure maps but also net pay, isotherm, and isobar maps, it is important that data also be properly located in Z (depth) as well. There are significant uncertainties in all of these measurements (X, Y, and Z). It is important that geoscientists understand the sources and magnitudes of these uncertainties so that maps can be made as accurately as possible and important business decisions can be made on the basis of those maps with the explicit recognition of the uncertainty contained within the maps.
X and Y uncertainty derives from any uncertainty associated with the surface location along with the added uncertainty related to the directional path of the well. Depth uncertainty similarly is associated with uncertainties in the measured depth of the well along with the added uncertainty of converting measured depth to true vertical depth (TVD). The goal of this chapter is not to instruct the reader in how to recognize and minimize these uncertainties. The primary goal is to make the reader aware that these uncertainties exist and that they must be considered in any subsurface map.
There are two distinct types of depth uncertainty to keep in mind. The first is relative depth uncertainty. This is the depth uncertainty of different log markers within a single well. The second depth uncertainty is absolute depth uncertainty. This is the uncertainty relative to a specific reference, usually mean sea level. Absolute uncertainty is most important when comparing depths from different wells.
Vertical Wells
Early in the development of the oil industry, all wells were drilled vertically because vertical wells are easier, cheaper, and safer to drill. That situation began to change in the late 1920s as operators struggled to develop oil fields that straddled the California coastline (LeRoy et al. 1977, Chilingarian and Vorabutr 1981). As recently as 1990, about 80% of all wells being drilled in the United States were vertical, and the remaining 20% were evenly split between deviated wells and horizontal wells (Baker Hughes Weekly Rig Count as of July 2018). By the middle of 2018, the picture had changed completely with almost 90% of the wells being drilled in the United States being horizontal and the remaining 10% being evenly split between vertical and directional wells (Baker Hughes Weekly Rig Count as of July 2018).
Determining the X, Y, and Z values for a vertical well is relatively straightforward. The X and Y values are taken from the surveyed location of the rig drilling the well. The Z is determined by direct measurement in the well. The situation for deviated and horizontal wells is more complicated and is discussed in more detail later in this chapter.
Surface Location Uncertainty
Although determining the X and Y location of a well is relatively straightforward, the available data is not always accurate. A recent attempt to locate several hundred wells in southwestern Wyoming revealed that about a quarter of them were mislocated in the state’s database by up to one mile (Joyce 2016). A number of studies encompassing 12,000 wells found that 40% of the surface locations were off by over 100 ft (Stigant 2012). There are numerous reasons why the surface location of wells can be incorrect in a database. In the early days of petroleum exploration, well locations were not always recorded or were recorded only very generally (Frischkneckt et al. 1985). Older survey methods (pre-1990) were not as accurate as modern methods using GPS satellites, especially in frontier areas and in difficult terrain such as the swamps of southern Louisiana. During the 1990s, the U.S. government deliberately degraded civilian accuracy of GPS data, but this practice was ended in May 2000. Current commercial GPS surveys are usually accurate within 1 ft or less.
Positional uncertainty of the surface location of carefully surveyed older wells is frequently ± 66 to 164 ft (± 20 to 50 m) (Williamson 1999). Even when the surface location of a well is accurately surveyed, the location may be incorrectly labeled on the drilling permit, scout ticket, or well header. Accurate surface locations may be entered incorrectly into computer databases. Finally, the surface location may be reported in the wrong geodetic datum and ellipsoid or the wrong map projection, causing the well to appear in the wrong location on a map (Williamson 1999, Jamieson 2012). A single point on the earth’s surface will have different latitude and longitude depending on the geodetic datum and ellipsoid referenced. Taking latitude and longitude from one datum and using it incorrectly with a different datum can produce hundreds of feet of error in the surface location (Stigant 2012, Jamieson 2012).
Jamieson (2012) lists several key facts pertinent to surface locations, including that latitude and longitude, elevations/heights, units, and headings are not unique unless qualified with a datum or reference; that every time data is handled or transferred, there is a chance that the references are not properly interpreted; and that most databases have incomplete metadata describing the references. Most geoscientists do not understand geodesy, the science of positioning on the earth’s surface. Unless you understand geodesy, you should always consult someone who does when setting up a mapping project (Jamieson 2012).
In many areas with a long history of drilling, it may be necessary to confirm the surface location of old wells. In some cases, it may be possible to do this from geographically registered air photos or even satellite images (Barnes 2005). In other cases, it may be necessary to use airborne magnetometers carried by either low-flying planes or helicopters to locate surface locations from the magnetic signatures of casing cut off below ground level as part of the abandonment process (Frischkneckt et al. 1985, Hammack et al. 2016). In difficult cases, it may be necessary to check surface locations on foot. In a few cases, it may not be possible to locate or confirm the location of old wells, especially if the well’s casing was cut off below the surface and pulled, leaving no equipment or surface magnetic anomaly to find.
Even when the surface location of a well is accurate, the data from that well can be assigned to the wrong wellbore. For example, data from a sidetrack may be incorrectly stored in a database as being from the original hole or from a different sidetrack. Log data can also be incorrectly stored under a different well with a similar name (Storey 2014). When data does not fit the map, it is important to go back and check that the data is assigned to the correct well at the right surface location.
Well Depth
Depth in a well is usually measured either with drill pipe, called driller’s depth, or with wireline, called logger’s depth. The reference elevation of the well has traditionally been the kelly bushing, a large piece of the drilling rig. Other common reference elevations are the rig floor (RF) or derrick floor (DF), the rotary table (RT), the bradenhead flange (BHF), and ground level (GL). In some offshore wells, a well may be started with one rig and finished with another rig. The same reference point on the different rigs may be at significantly different elevations relative to mean sea level (MSL). Thus, the zero depth for a shallow log run may be at a different elevation than the zero depth for a deeper log run.
We begin by discussing measured depth (MD), also known as along hole depth (e.g., Brooks et al. 2005) or true along hole depth (TAH) (Forsyth et al. 2013). For vertical wells MD is equal to TVD (which we discuss later in the chapter). In deviated wells, MD is not equal to TVD and must be corrected for the directional path of the well. Before we deal with the directional path of the well, however, it is important to understand the uncertainty in MD, as TVD can never be known more accurately than we know MD.
Depth is the most fundamental measurement made in a well, and yet it is a measurement for which there are few, if any, industry standards or accepted auditable practices (Forsyth et al. 2013, Bolt 2015). Bolt (2015) recently listed some of the costs of depth uncertainties (Table 3-1). These costs range from minor, thousands or tens of thousands of dollars, to major, tens of millions or hundreds of millions of dollars. Depth uncertainty is one of the largest uncertainties in assessing the value of oil and gas fields (Fig. 3-1), but it is rarely considered. It is important to get depth values as accurately as possible.
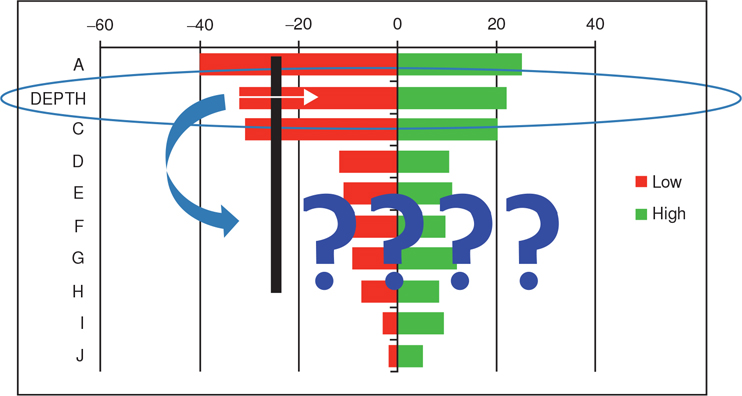
Figure 3-1 Depth is one of the key uncertainties in determining the value of oil and gas fields. (After Bolt 2015. Published with permission from Harald Bolt.)
Table 3-1 Potential cost of depth uncertainties (after Bolt 2015)
Event |
Cost ($) |
|---|---|
Lost time repeat surveys |
Thousands |
Interval relogging |
Tens of thousands |
Field depth resurveys |
Hundreds of thousands |
Field studies and sidetracks |
Millions |
Equity value discrepancies |
Tens of millions |
Incorrect reserves and geological models |
Hundreds of millions |
The largest investment decision that many geoscientists will ever work on is the development plan for a new discovery. These decisions can involve billions of dollars of investment capital in frontier discoveries, for example. Suboptimal development plans can result in the unnecessary spending of tens or hundreds of millions of dollars by installing larger facilities or drilling more wells than needed to develop a field. Alternatively, fields may be undercapitalized, requiring retrofitting or additional facilities at a much higher cost than if the initial field development plan was more appropriate. Worst of all would be the failure to develop a profitable discovery because the cost of the development was inaccurately assessed. Failure to accurately recognize field complexity and compartmentalization due to a lack of understanding of depth uncertainty associated with fluid contacts, for example, can contribute to very expensive business mistakes (Forsyth et al. 2013; Bolt 2015).
All structure maps are created relative to a horizontal reference plane, usually MSL. The elevation of MSL is constant over short distances but it is not constant over large distances. MSL in the United States and Canada used to be the National Geodetic Vertical Datum of 1929 (NGVD 29). NGVD 29 assumed that 26 tidal gages in the United States and Canada were the same elevation. More accurate surveying has revealed that these 26 gages actually differ in elevation by up to 5 ft (1.5 m) (FEMA 2014). NGVD 29 was supplanted with a new datum in the early 1990s, the North American Vertical Datum of 1988 (NAVD 88). Elevations relative to MSL for pre-1991 wells in the United States and Canada are likely to be relative to the NGVD 29 datum, whereas elevations relative to MSL for wells drilled after 1991 are likely to be referenced to NAVD 88. Although reference elevation differences for nearby wells referenced to the different datums are likely to be very small, it is possible to check elevations relative to the two different standards using a program (VERTCON) on the U.S. government’s National Oceanic and Atmospheric Administration (NOAA) website. Different areas of the world have different datums for MSL, but these differences are unlikely to affect any local mapping project.
Driller’s depth is measured with joints of drill pipe, which are generally measured on a pipe rack. Traditionally, joints of drill pipe have been measured from pipe shoulder to pipe shoulder using steel measuring tape under ambient surface conditions, although in recent years they are frequently measured using lasers (Jamieson, 2012). A joint of pipe will have a slightly different length when measured in North Dakota in the winter than if the same joint of pipe were measured in the Permian Basin in August. Driller’s depth is determined by summing the length of every joint of pipe in the drill string along with any bottomhole assembly (BHA) that is in the hole below the reference elevation of the well. The reference for the length of every joint of pipe run in the drill string is known as the driller’s tally. Traditionally, mudlogs, casing points, and total depth (TD) of a well have been based on driller’s depth.
Since Schlumberger introduced the resistivity log in France in 1927, most well depth measurements that are used in subsurface mapping are based on various types of wireline logs. These logs are generally measured with cable or wireline depths. Recently, more and more logs have been acquired using logging while drilling (LWD). LWD logs are measured, somewhat indirectly, using driller’s depth. Actual log readings are referenced to time. The depth of the bit is also referenced to time. Cross-referencing the time of a log reading and the depth of the bit at that time, along with knowledge of the position of tool sensors relative to the bit, allows the depth of log measurements to be determined.
In some situations, pipe-conveyed logs (PCL), also referred to as tough logging conditions (TLC or TCL) logs, are acquired using pipe-conveyed wireline tools. Some logs are also obtained on slickline, but these logs are almost invariably obtained within cased holes. Their depth is usually tied to an open hole log and are not considered further in this book. It is important that geoscientists and engineers making and working with subsurface maps understand that depth measurements of different types of logs, especially wireline and LWD logs, are made with different measuring tools and frequently give different depths for the same subsurface marker (Fig. 3-2). To produce accurate subsurface maps, it is important that mappers understand how depth is measured for different types of logs, how and why these depths may differ, and how these differences can be minimized.

Figure 3-2 Wireline and LWD logs from a single Gulf of Mexico well showing a hydrocarbon-bearing sand that is at different depths on the two different logs. The 20-ft depth difference occurs because wireline depth and LWD depth are measured using different tools. (Published with permission of J. Brenneke.)
Wireline Depth Measurements
Since the 1930s, most formation depths in wells have been measured using wireline tools. Wireline depths are measured by determining the position of various logging tools on the logging sonde and measuring the length of wireline cable lowered into the hole. In most cases the length of cable is measured using some type of wheel device. A number of factors can affect the measurement of cable length, but in modern wells, these factors are relatively minor and are not discussed in detail in this book. Interested readers are referred to extensive discussions of these factors in publications such as Bolt (2015).
The main factors affecting wireline length changes in the hole are cable stretch and thermal expansion/contraction. Most service companies have relatively accurate algorithms that allow depth correction for cable stretch (Bolt 2015, 2016), although these algorithms continue to be improved (e.g., Fitzgerald and Pedersen 2007). Wellbore deviation affects the stretch of wireline cables as friction on the borehole wall in deviated wells decreases cable tension (Fitzgerald and Pedersen 2007). Older algorithms are probably less accurate than more recent ones. The thermal expansion/contraction of modern logging cables is complicated, as they are composed of several different materials that react differently to temperature. The reaction to temperature may vary from one cable type to another. Some workers report that increased temperatures lengthen cables, whereas other workers report that increased temperatures shorten cables (Bolt 2015).
Wireline data may be measured either while running into the hole or when pulling out of the hole. Different companies prefer one method or the other, but the depths from the two methods are different (Pedersen and Constable 2006; Fitzgerald and Pedersen 2007). Most final logs are recorded while pulling out of the hole, although the depth on these logs may be adjusted to the depth recorded running into the hole.
LWD Depth Measurements
LWD depth measurements are based on driller’s depths, which in turn are based on the length of drill pipe and BHA in the borehole at any given time. The driller’s depth is based on three factors. First, the length of pipe and BHA is measured on the surface using steel tape measures or, increasingly, lasers. Second, the length of pipe and BHA is recorded in the driller’s tally book. Third, the length of drill pipe that is in the drill string but not yet in the hole is determined by the height of the traveling block or top drive above the reference location of the well.
LWD data is not really measured relative to depth. It is measured relative to time. The depth of the LWD data is then determined from the logger’s depth of the drill bit at the time the data was recorded and the distance of the LWD sensors from the drill bit.
The length of the drill pipe is measured under ambient surface conditions and no stress. Once in the hole, the drill pipe is subjected to forces different than ambient surface conditions and no stress. The two most significant forces with respect to drill pipe length are the tensional stress due to the weight of the drill string and thermal stress related to the in situ temperature of the pipe in the hole. The temperature experienced by the drill pipe is not the static temperature of the earth but the actual temperature in the borehole, which is affected by mud circulation and frictional heating from the drill bit. Both tensional stress and thermal stress cause the drill pipe to lengthen, and these forces tend to increase as a function of TVD. Lesser forces that affect the length of the drill pipe are the mud weight, which partially offsets the weight of the drill pipe; friction along the borehole wall, weight on bit (WOB), and borehole geometry, which also affect the tension on the drill string and thus its stretch; pump pressure, which can cause the drill pipe to balloon slightly, shortening the pipe; and torque, which can also shorten the pipe (Chia et al. 2006).
The length of each section of drill pipe is recorded in the driller’s tally book. Occasionally, a joint or stand is left out of the tally book due to human error. Also occasionally, one joint may be switched out for another of a slightly different length, perhaps because the first joint’s threads were scored or some other imperfection in the joint was recognized. If the length of the first joint is already recorded in the tally book, it might not be replaced with the length of the second joint. The final accuracy of driller’s depth cannot exceed the accuracy of the driller’s tally book.
Once a well is drilled as deeply as can be done with a given amount of drill pipe, the drill pipe is set in the slips at the rig floor and a new joint or joints of drill pipe is attached to the existing drill string. The top drive or traveling block is then attached to the top of the new joint or joints of drill pipe and drilling is resumed. The distance the top drive or traveling block moves down from its position in the top of the derrick after drilling resumes is used to determine the depth of the bit in the well.
As a well is drilled, the main forces acting on the drill pipe usually result in elongating the drill string. This elongation results in events logged in the well to be recorded at shallower depths than they really occur (Fig. 3-3).

Figure 3-3 Diagram explaining why LWD logs are almost invariably shallower than wireline logs in deeper wells. The length of the drill pipe is measured under ambient conditions at the surface. Tensional stress and thermal stress result in pipe stretch, which is generally not corrected for on LWD logs. (Published with permission of J. Brenneke.)
Pipe-Conveyed Log Depth Measurement
Pipe-conveyed logging (PCL) is usually performed when wireline logs are required but the conditions of the wellbore do not allow the wireline sonde to go down in the wellbore on its own. The wireline sonde is attached to the end of the drill pipe, and the wireline cable is run outside of the drill pipe through a side entry sub. The wireline operator plays out cable as the drill pipe is lowered into the hole. Prior to logging the interval in question, the PCL log is depth tied to an existing log, which may be either a wireline log or an LWD log. During the logging operation, the wireline operator attempts to synchronize the movement of the cable with the movement of the drill pipe. This synchronization is frequently not perfect, resulting in depth errors that are difficult to quantify (Wilson et al. 2004). LWD logs are also usually acquired with some WOB, whereas PCL logs are acquired with no WOB, resulting in some difference in driller’s depth between the two logs (Wilson et al. 2004). PCL logs are relatively uncommon and are not considered further in this book.
Relative Depth Uncertainty
Relative depth uncertainty is depth uncertainty within a single well. Both wireline and LWD logs generally have good relative depth uncertainty, so the distance between markers within a single well is usually relatively accurate. On some occasions, however, LWD relative depth uncertainty becomes less accurate (Fig. 3-4) (Storey 2013). The example in Figure 3-4 is somewhat extreme, but smaller variations are not uncommon (e.g., Forsyth et al. 2013, Fig. 5). The cause of these relative depth uncertainties in the LWD logs is not addressed by Storey (2013) or Forsyth et al. (2013) but could be related to poor calibration of the hanging block in the middle of a stand (R. Wylie, personal communication, 2018) or by variations in WOB. The relative depth uncertainty in the LWD data can be seen when both LWD and wireline logs are available but may go unrecognized if only LWD depth is available.
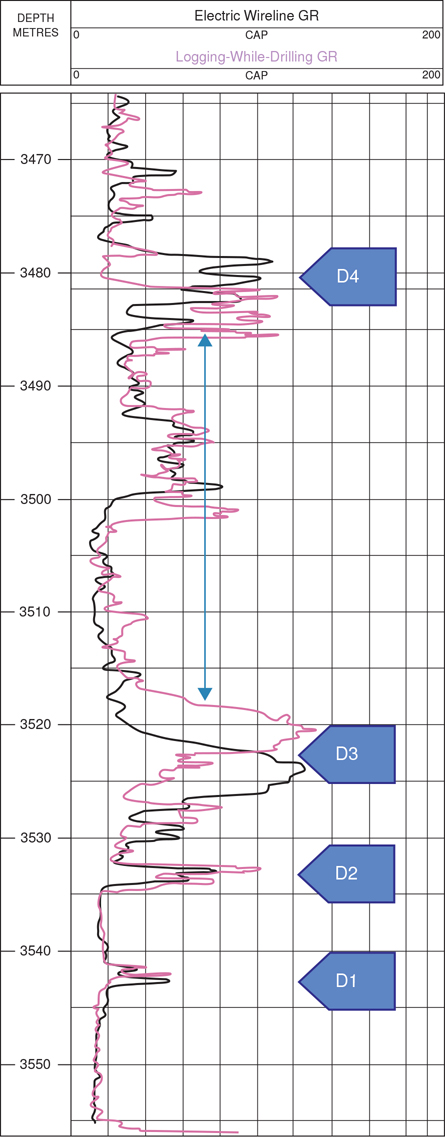
Figure 3-4 Relative depth uncertainty between an LWD log and a wireline log. The two gamma ray (GR) logs are on depth near both the top and the bottom of this section, but they are off depth by several meters near the center of the interval. The interval thickness between the D3 and D4 markers is 32.6 m (107 ft) based on the wireline log and 40.3 m (132 ft) based on the LWD log. This thickness difference, approximately 25%, would have a significant impact on volumetrics. (From Storey 2013. Published with permission of Oilfield Technology.)
It is important to check the WOB to minimize the possibility of relative depth uncertainty in an LWD log. If the WOB decreases while the drill pipe is rotating and the hanging block is stationary, the drill bit is probably drilling a new hole, and the LWD sensors are recording values from the new section. These readings may not be displayed because LWD logs generally display only the first readings from a given depth, and if the hanging block is not moving, the depth is assumed to be constant. Similarly, if the WOB is increasing and the hanging block is moving, the bit may not be moving as much as the hanging block. In extreme cases, if the drill string goes from extension into compression, the drill pipe could buckle or corkscrew, resulting in significant movement of the hanging block with no movement of the drill bit (Fig. 3-5).
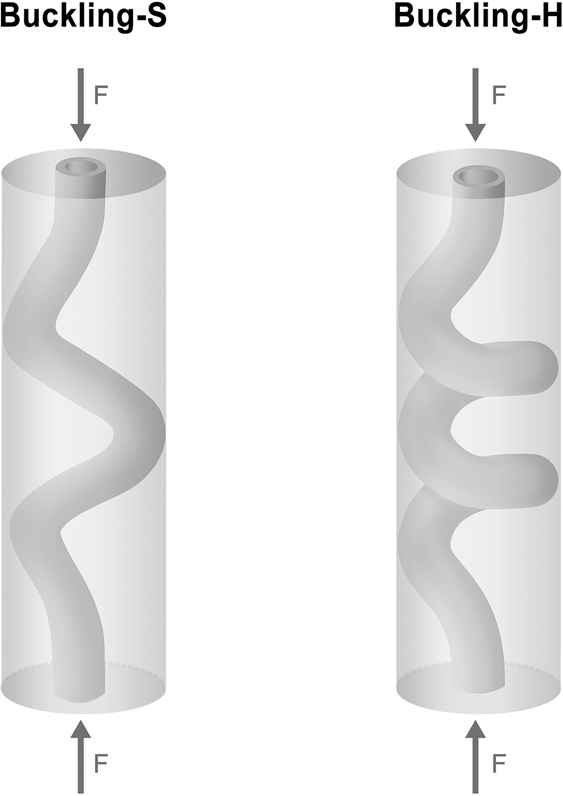
Figure 3-5 Drill pipe in compression can produce sinusoidal buckling (Buckling-S) or helical buckling (Buckling-H), which can cause driller’s depth to be greater than TAH. In a deviated well, some parts of the drill string may be in compression while other parts are in tension. (From Jamieson 2012. Image courtesy of Pegasus Vertex, Inc.)
Absolute Depth Uncertainty
Although the relative depth uncertainty within a single well is generally small, the uncertainty in the absolute depth of any well is greater (Fig. 3-2). This uncertainty produces a depth uncertainty between wells. Because drill pipe stretch is rarely corrected for in LWD logs, LWD logs must almost invariably be shifted deeper to match wireline logs (Fig. 3-6).
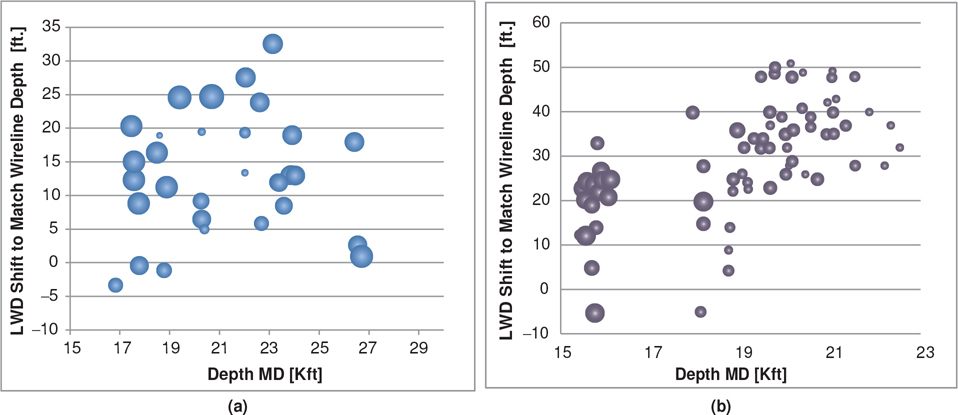
Figure 3-6 (a) LWD depth shift required to match wireline log depth for deep, deviated wells in the Gulf of Mexico. Dot size is proportional to maximum well deviation that ranged from 5.38 deg to 48.47 deg. (b) LWD depth shift required to match wireline log depth for deep, near-vertical wells in the Gulf of Mexico. Dot size is proportional to hole diameter ranging from 5.75 in. to 14.75 in. (From Pineda and Bergeron 2017. Published with permission of Society of Petrophysicists and Well Log Analysts.)
When both wireline and LWD logs are run in a well, the LWD logs can be depth shifted to tie the wireline log. This depth shift is not constant, however, but varies with depth, and not always in a constant direction (Fig. 3-7). The real problem arises when only LWD logs are run in a well and it is compared to wells with wireline logs. There are no correction tables or rules of thumb that allow LWD logs to be depth shifted to mimic wireline depths, but in wells deeper than 15,000 ft, depth shifts of 20 ft to 50 ft are not uncommon.
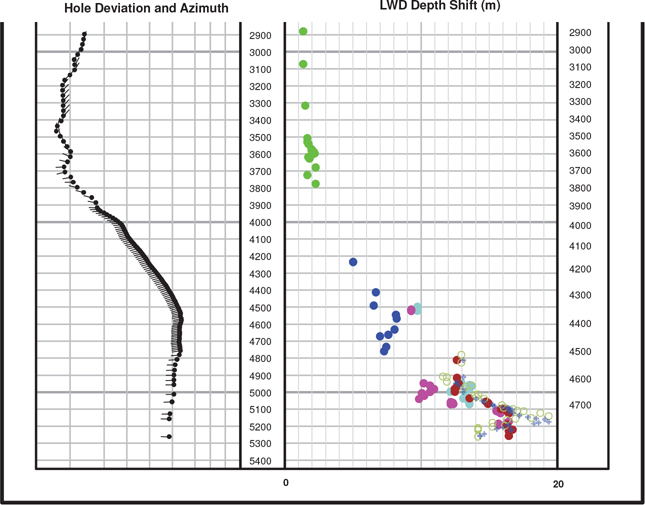
Figure 3-7 Depth shift required to tie an LWD log to a wireline log in a deviated well from Kristin Field, Norwegian Sea. The required log shift reaches a maximum of 19.5 m (64 ft) between 5100 m and 5200 m MD (16,730 ft to 16,060 ft). This shift decreases to just over 14 m (46 ft) at TD. (From Pedersen and Constable 2006. Published with permission of Society of Petrophysicists and Well Log Analysts.)
LWD logs can be depth shifted to correct for drill pipe stretch if sufficient drilling data is available (Chia et al. 2006). These corrections allow the length of each joint of drill pipe to be corrected for mechanical stretch and thermal expansion and can dramatically reduce the depth differences between LWD and wireline logs (Fig. 3-8). The required drilling data are almost always available to the service company running the log but may not be available to other companies who wish to use the log in mapping.

Figure 3-8 (a) LWD and wireline GR logs from a deep, highly deviated well. The left side shows the curves differ in depth by 11 m (36 ft) as supplied in final form by the service company. The right side of the figure shows the depth agreement between the two logs after both the LWD and wireline depths have been corrected. (b) LWD and wireline GR logs from a well in a different field with a simpler geometric profile. Again, the logs on the left side of the figure are the final results supplied by the service company. Here the depth difference is 5.3 m (17 ft). The logs on the right side of the figure have been depth corrected. Here the depth correction to the wireline log is very small, but the depth shift to the LWD log is substantial. (From Chia et al. 2006. Published with permission of Society of Petroleum Engineers.)
Directionally Drilled Wells
A directionally drilled, or deviated, well is defined as a well drilled at an angle less than 90 deg to the horizontal (Fig. 3-9). Wells are normally deviated intentionally in response to a predetermined plan; however, straight holes often deviate from the vertical due to bit rotation and natural deviation tendencies related to rock types and structure.
The technique of controlled directional drilling began in the late 1920s on the U.S. Pacific coast (LeRoy et al. 1977, Chilingarian and Vorabutr 1981). Through the use of controlled directional drilling, a wellbore is deviated along a preplanned course to intersect a subsurface target horizon(s) at a specific location (Fig. 3-10). Our primary interest in directionally drilled wells in this textbook centers around their application to subsurface mapping.
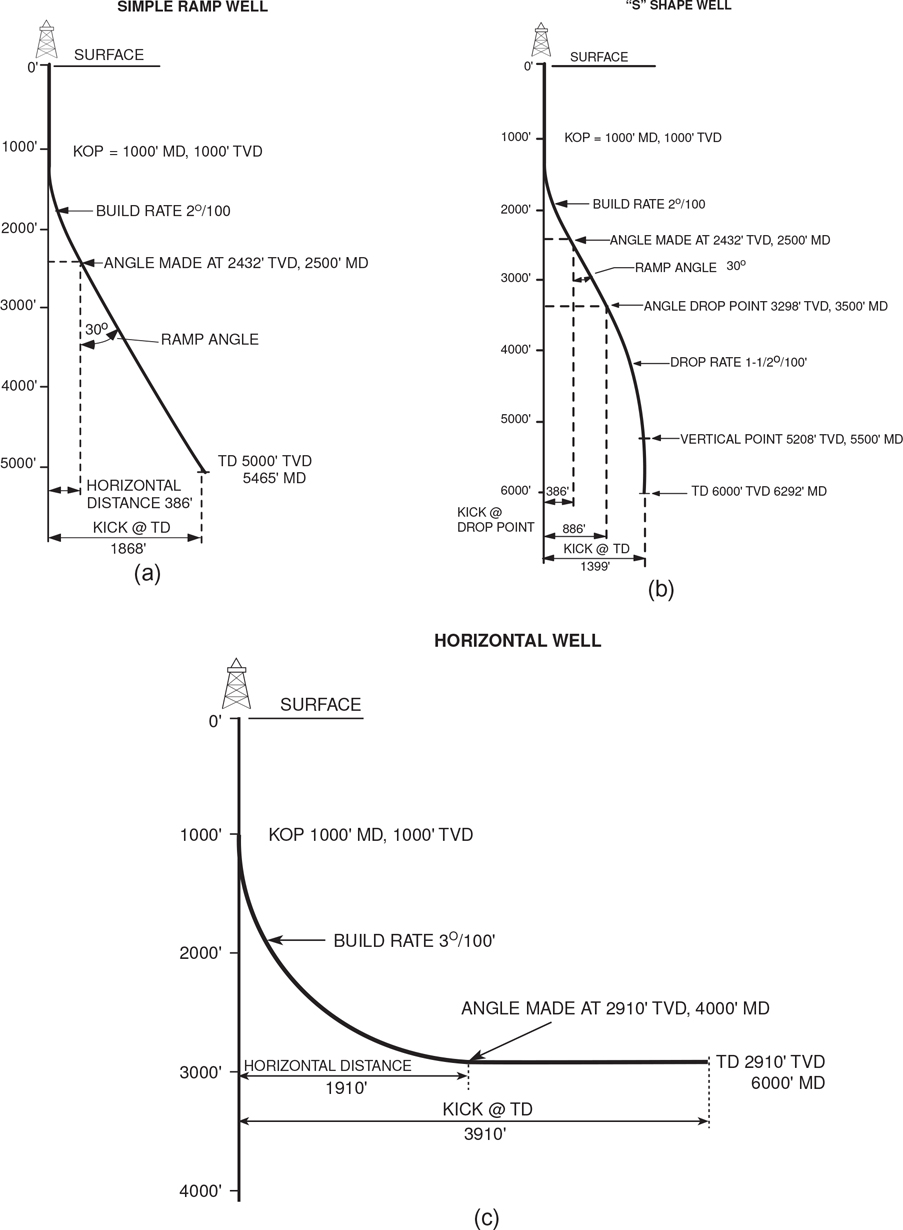
Figure 3-9 Diagrammatic cross sections of (a) a simple ramp or L-shaped well, (b) a more complicated S-shaped well, and (c) a horizontal well. (Figures [a] and [b] published by permission of Tenneco Oil Company; [c] published by permission of J. Brewton.)
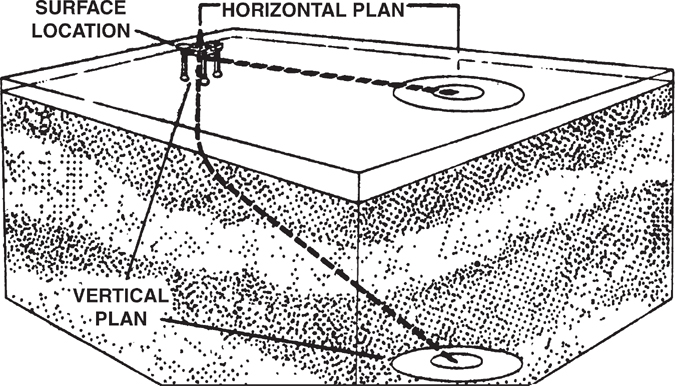
Figure 3-10 Block diagram showing the vertical and horizontal plan views of a well directionally drilled to a predetermined subsurface target. (Published by permission of Eastman Christensen.)
Application of Directionally Drilled Wells
There are a number of reasons to drill a directional well. Some of the more common applications are shown in Figure 3-11. For many years, the most common application was the drilling of offshore wells from a single platform location (Fig. 3-11a). The use of a single platform or subsea manifold from which multiple wells are drilled improves economics and simplifies production facilities. Onshore, many unconventional plays are now being drilled from well pads that include multiple wells. This approach minimizes lost time due to rig moves and can also minimize the amount of surface disturbance and the cost of pipeline connections. Some modern rigs can actually “walk” short distances from surface location to surface location without being broken down for transport (e.g., Wethe 2015).

Figure 3-11 Applications of directional drilling. (a) Multiple wells offshore or from artificial islands. (b) Shoreline drilling. (c) Fault control. (d) Inaccessible surface location. (e) Stratigraphic trap. (f) Relief well control. (g) Straightening hole and side tracking. (h, i, j) Saltdome drilling. (From LeRoy et al. 1977. Published by permission of the Colorado School of Mines.)
Onshore, wells are commonly deviated because of inaccessibility to the surface location directly over the subsurface target. Buildings, towns, cities, rivers, shorelines, and mountains are the kinds of surface obstructions that require the drilling of a deviated well. Some offshore wells are also located away from seafloor topographic complications such as escarpments or unstable conditions, requiring the drilling of deviated wells. Horizontal wells are a special type of directional well. They have many applications, most of which are designed to increase productivity rate and improve project economics. These wells are discussed in more detail in the next section.
One very important safety application of a deviated well is the drilling of a relief well to kill a well that has blown out (Fig. 3-11f). Relief wells may be required to kill a well that has blown out during drilling/completion, such as BP’s Deepwater Horizon Macondo well, or a completed well such as California’s Aliso Canyon disaster in which an old well in a natural gas storage field flowed gas for 118 days before being killed by a relief well. There are other applications of deviated wells, but they are beyond the scope of this textbook and are not discussed.
Over the last two decades, highly deviated wells and horizontal wells have become increasingly common. Horizontal wells are drilled to access both conventional and unconventional reservoirs and are the most common type of well drilled in the United States and probably the world today.
Common Types of Directionally Drilled Wells
Many complex factors go into the design of a directionally drilled well; however, most deviated wells fall into one of three types. For years, the most common type was a simple ramp well (Fig. 3-9a), sometimes called an L-shaped hole. These wells are drilled vertically to a predetermined depth and then deviated to a certain angle, which is usually held constant to TD of the well. Many wells are drilled with an S-shaped design. For an S-shaped hole, the well begins as a vertical hole and then builds to a predetermined angle, maintains this angle to a designated depth, and then the angle is lowered again, often going back to vertical (Fig. 3-9b). Finally, horizontal wells are configured by continuously building the deviation angle until the desired near-horizontal orientation is reached (Fig. 3-9c). Under very rare circumstances, such as in the tar sands of Canada, wells may be spudded at an angle. This allows for larger step-out distances at very shallow depths.
General Terminology
The terms used to describe various aspects of a directionally drilled well are defined in Table 3-2 and illustrated in Figure 3-9.
Table 3-2 Aspects of directionally drilled wells
KOP |
Kick-off point. Depth of initial deviation from vertical measured as measured depth (MD), true vertical depth (TVD), or subsea true vertical depth (SSTVD). |
Build rate |
Build angle. Rate at which the angle changes during deviation. It is usually expressed in degrees per 100 ft drilled. Example: 2 deg per 100 ft. |
Ramp angle |
Hole angle, drift angle, angle of deviation. Angle from the vertical that a well maintains from the end of the build through the ramp segment of the well. |
BHL |
Bottomhole location. Horizontal and vertical coordinates to the total depth point usually measured from the surface location. |
Drop rate |
Rate at which the ramp angle changes in degrees per 100 ft. Measured in S-shaped holes. |
Vertical point |
The depth where the well is back to vertical, measured as MD, TVD, or SSTVD. |
Horizontal Wells
Horizontal wells are typically considered to be wells with the borehole drilled within about 3 deg of bed dip or wells drilled nearly horizontally. These include extended-reach wells with long horizontal displacements, as well as long- and medium-radius horizontal wells. Short-radius horizontal wells are often called drain hole wells.
Extended-reach wells can be similar to the S-shaped well but with very high ramp angles in the 80 deg range. Although they are nearly horizontal, they might not be considered true horizontal wells. These wells are generally drilled when the surface location is necessarily a great distance from the target. Long-radius horizontal wells have build rates in the 3 deg per 100-ft range, and generally the horizontal part of the borehole is several thousand feet in length. Medium-radius horizontal wells have build rates in the 30 deg per 100-ft range and are usually drilled for shallow objectives. Short-radius horizontal wells are borehole segments drilled from a vertical borehole that penetrated the objective interval, with the deviation from vertical to horizontal made within a vertical interval of about 20 ft. These wells usually have horizontal segments of only a few hundred feet, but several horizontal segments may be drilled from the same vertical wellbore. These drain hole wells are used in low permeability reservoirs and enhanced recovery projects.
The purpose of drilling most horizontal wells is to improve the economics of a project by increasing production rates. For example, horizontal wells can improve production rates from (1) reservoirs containing heavy oil, such as the Orinoco heavy oil belt (Venezuela); (2) reservoirs with mostly fracture porosity, such as the Austin Chalk (onshore Gulf of Mexico); and (3) reservoirs of low permeability. This latter feature is responsible for the rapid development of unconventional reservoirs in the United States and the rapid shift of well type from predominantly vertical in 1990 to dominantly horizontal in 2018 (Fig. 3-12).
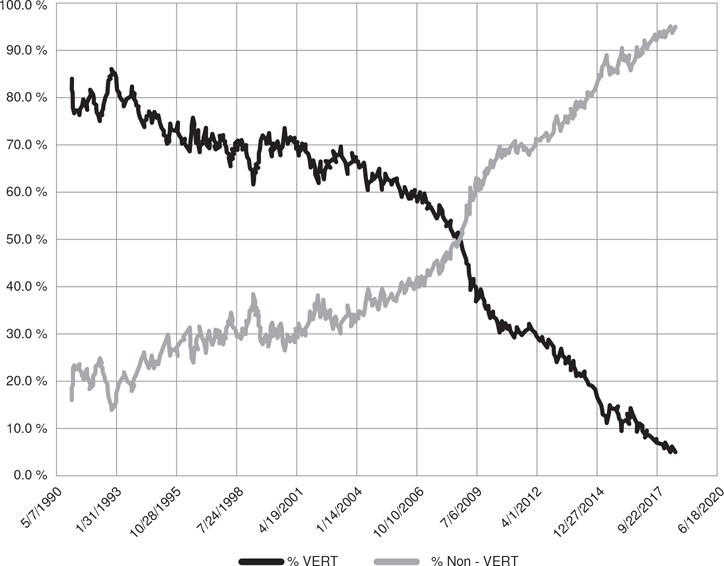
Figure 3-12 Percentage of wells of various well types drilled in the United States. Most nonvertical wells drilled after 2007 are horizontal wells. By 2018, 88% of wells drilled in the United States were horizontal. Data from Baker Hughes website. (Published with permission of J. Brenneke.)
Horizontal wells can also be used to penetrate and produce from multiple reservoirs that are laterally discontinuous. For example, separate fluvial channel sands that are in the same stratigraphic interval but are laterally discontinuous can be penetrated by a single horizontal well to drain multiple sand bodies. Also, for multilobed reservoirs with attic reserves above the highest wells on the structure, a horizontal well can be designed to encounter all the lobes, whereas a vertical well might miss some of the lobes that truncate up-dip. Another application of horizontal wells is to drill for thin oil zones over water. These zones are subject to coning of water into vertical wells. A horizontal well can significantly reduce the problem of water coning. There are other applications of horizontal wells, but most well plans are based on increasing production rates and shortening well life to improve project economics.
Directional Well Plan
A variety of data go into the design of a directionally drilled well, including the depth and distance from the surface location to each subsurface target, diameter of the target, KOP, build rate, platform location, lease lines, hole size, and total depth of the well. Once preliminary studies indicate the need for a deviated well, most companies rely on a directional drilling service company to prepare the final directional plan.
A directional well design consists of both vertical and horizontal plans. Figure 3-13 shows the horizontal and vertical plans for the Diamond Shamrock Well No. 1. Reviewing Figure 3-13a, we see that the KOP for this well is about 950 ft MD, and the build rate averages about 2 deg per 100 ft to a maximum deviation angle of 45°30' at a MD of 4800 ft. Figure 3-13b shows the horizontal plan for the well. The plane of the proposed direction is south 46°25' west from the surface location with the bottomhole location (BHL) 10,873 ft from the surface location. The well is drilled to a MD of 19,484 ft, which is equal to a TVD of 15,695 ft.
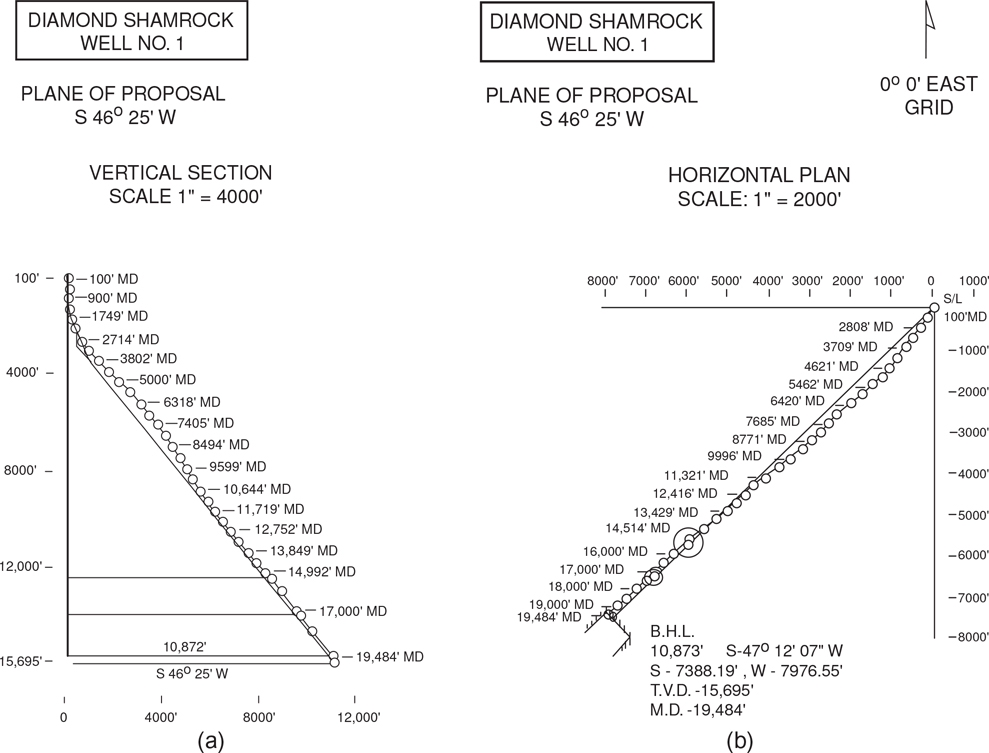
Figure 3-13 (a) Vertical section plan for a directional well. (b) Horizontal plan for the same directional well shown in Figure 3-13a. (Published by permission of Gardes Directional Drilling.)
A grid reference for north is shown in Figure 3-13b. Several coordinate systems exist for industry’s use and, unfortunately, it is common for the data sources (e.g., directional well surveys and seismic surveys) and maps used in a project to be in different coordinate systems. It is critical that all of them be converted to the same system to reduce errors in location.
Figure 3-14 illustrates the vertical plan for a well that has a maximum deviation angle of 94 deg and a maximum build angle of 14 deg per 100 ft. The wellbore is vertical near the surface, and at a depth of 1659 ft (TVD), it is horizontal.

Figure 3-14 Vertical plan for a nearly horizontal well with a maximum deviation angle of 94 deg. (Published by permission of Gardes Directional Drilling.)
Commonly, deviated wells are drilled with a build rate of 2 deg per 100 ft of hole drilled. Figure 3-15 shows the scaled chart for a 2 deg per 100 ft build rate. Such charts are used to make a quick estimate of well design after structure maps have been made on target horizons. For example, from the chart, a target horizon located at a TVD of 10,000 ft and a horizontal distance of 4000 ft from the platform location requires the drilling of a well with a deviation angle of approximately 23 deg to a MD of 10,800 ft. Such charts are available from directional service companies for build rates ranging from 1 deg to 5 deg per 100 ft. In most cases today, however, these charts have been replaced with computer software that can calculate preliminary directional plans quickly.
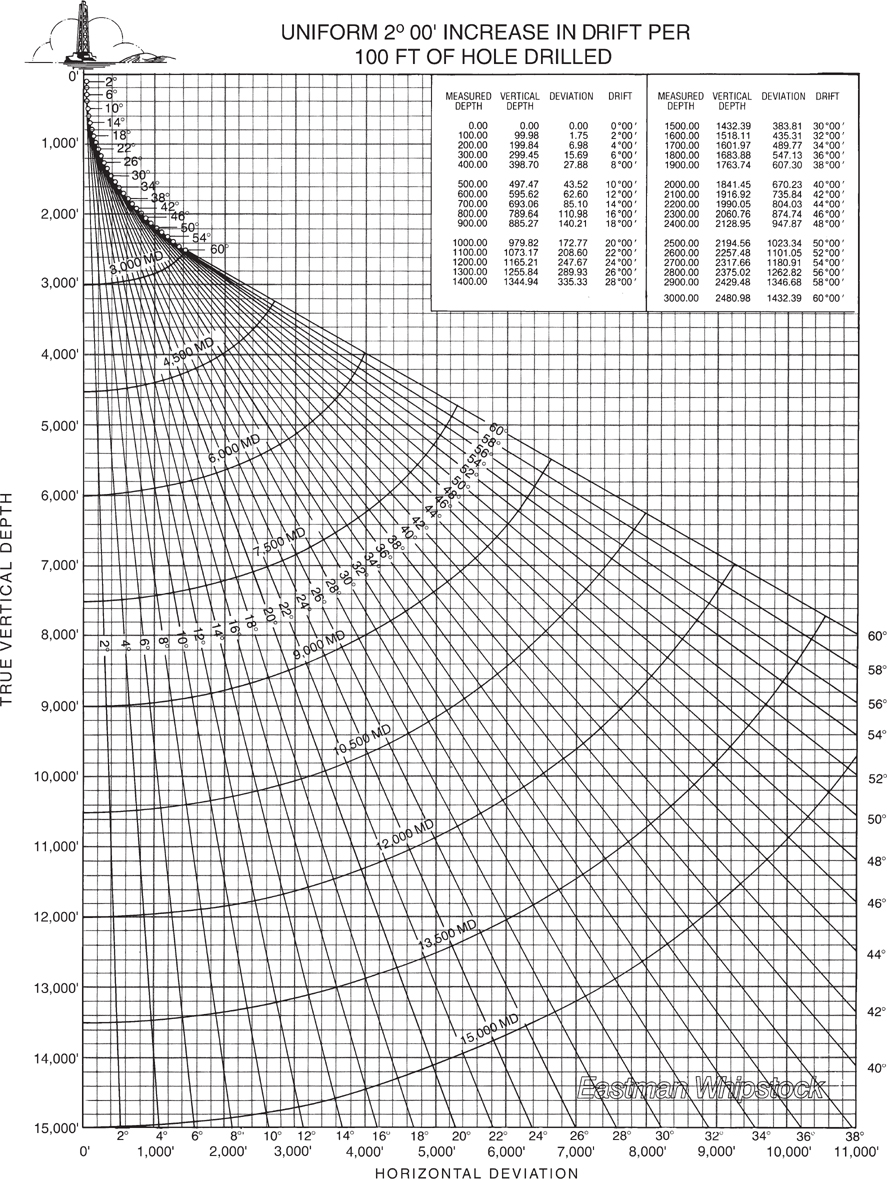
Figure 3-15 Scaled chart for a build rate of 2 deg per 100 ft of hole drilled. (Published by permission of Eastman Christensen.)
Directional Tools Used for Measurements
Three features of a directional wellbore are measured at given points within the well: (1) measured depth, which is the distance from the surface to a given point, measured along the wellbore; (2) angle of inclination from the vertical (drift angle or deviation angle); and (3) drift direction, or the directional path of the wellbore. These parameters are the basis for calculations of the position of each point in the subsurface, and all this information is included in a directional survey. Drift angle and drift direction are measured by a survey tool conveyed in drill pipe or by wireline, and MD is determined by length of drill pipe or wireline. The various tools that are used fall into two categories: magnetic and nonmagnetic.
Magnetic Surveys
Magnetic is a generic term for describing several survey tools that use a magnetic compass for direction and therefore must be run inside a special nonmagnetic drill collar to negate the effects of the drill pipe. An example of such a survey is the single-shot magnetic survey. This device records, on a heat-resistant film disc, the magnetic direction and inclination angle of the wellbore at specific depth intervals. A multishot survey uses a filmstrip to record several readings of hole angle and direction at different depth intervals. Newer wireline tools provide real-time survey data at the surface. Measurement accuracy of magnetic survey tools has been improved within the last 30 years. Modern magnetic tools are used for measurement-while-drilling (MWD) surveying. These surveys provide real-time data for more efficient directional drilling.
Nonmagnetic Surveys
Nonmagnetic survey tools are of two types: those with no direction-finding device and those with a gyroscopic mechanism for determining direction. A drift indicator tool (e.g., a Totco tool) measures only drift angle and is usually run in vertical wells or shallow vertical sections of deviated wells where directional information is not required. This tool generally consists of a housing or barrel, a motion indicator, a timer, a punch, and a printed paper disc. The unit is either run on a wireline or dropped on a drill bit. When the motion sensor determines that the tool is no longer moving, the timer is activated, and after a predetermined interval of time the punch is released. The punch, which is allowed to swing freely and act as a plumb bob, drops vertically and punches a hole in the paper disc, which is marked in degrees. Figure 3-16 shows a Totco disc scaled to a maximum of 8 deg. The hole punched in the disc indicates an inclination angle of 4.5 deg, but the drift direction is unknown.
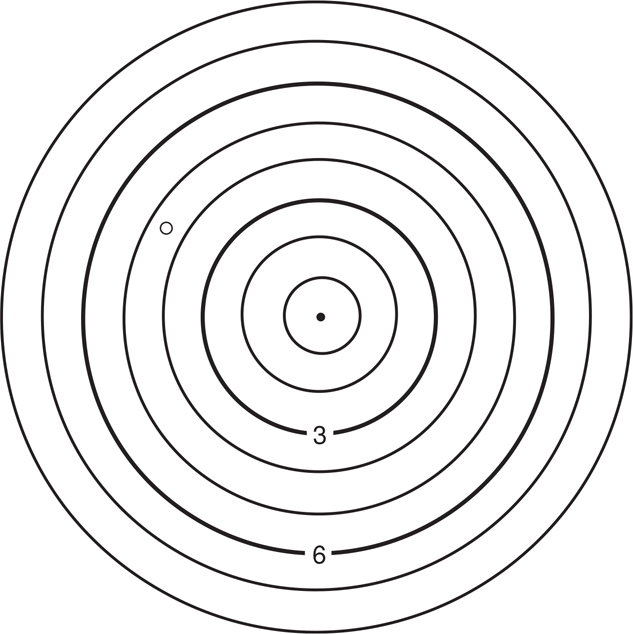
Figure 3-16 Example of a Totco survey. Well deviation angle is 4.5 deg.
Gyroscopic survey tools are widely used and are capable of providing more accurate data than magnetic survey tools. Because the magnetic compass is replaced by a gyrocompass, the system can be run in both cased and uncased holes and run where cased holes are nearby, as in a platform well cluster. The gyro system can be set up as a single-shot or multishot instrument. Conventional tools, referred to as free gyros, are less accurate than the newer rate gyros, which are of different construction. A gyro survey is sometimes run after an MWD magnetic survey to provide additional information for well path determination. Gyroscopic tools have recently been developed for use while drilling (gyroscope while drilling [GWD]) (e.g., Weston et al. 2014).
Survey Frequency
Survey frequency can affect the accuracy of a survey, especially if the well is drilled with the traditional mud motor and bent housing. Deviated wells drilled using a mud motor and bent housing are drilled using a combination of sliding and drilling. During sliding, the bent sub is oriented in the direction the driller wants to turn the well, and the mud motor rotates the bit while the drill pipe is not rotated. After a short section of hole is drilled this way, the drill pipe is rotated and additional hole is drilled. In this system, sliding and then drilling will result in a slightly different TVD than drilling and then sliding, even if the MD, borehole inclination, and borehole azimuth are identical at the beginning and end of the hole section (Jamieson 2012). Wells drilled with rotary steerable assemblages may be less susceptible to errors due to survey frequency, but it is still best practice to survey deviated wells at frequent intervals, generally every 100 ft or less.
Directional Survey Calculations
More than 20 methods have been developed to calculate the directional survey, which provides the 3D location of a directional wellbore anywhere along its entire length. The more common methods include (1) tangential, which is the least accurate and is no longer used; (2) trapezoidal, also called balanced tangential; (3) average angle; (4) radius of curvature; and (5) minimum curvature. Many companies have their own methods, and new algorithms are occasionally published. The accuracy of any method varies with the configuration of the wellbore. The radius of curvature and minimum curvature methods are the most widely used today, and the latter is considered slightly more accurate for most wells. The method of calculation is typically noted on the survey. If you work in an area with deviated wells and surveys of different vintages, you can reduce the wellbore position uncertainty due to calculation method by using the same algorithm, such as minimum curvature, to recalculate all surveys. Computer software for this is readily available. The TVD calculated for a survey can vary by tens of feet between an older method, such as the tangential method, and a more modern method, such as the minimum curvature method.
If you are working an area with surveys of different vintages and using a computer workstation, all of the directional survey data for the wells should be entered as the basic survey measurements, that is, MD, deviation angle, and direction of deviation. Allow the computer software to calculate the directional survey results using the radius of curvature or minimum curvature method. Some computer software allows you to enter calculated data from directional surveys, such as TVD and rectangular coordinates, rather than MD. If you enter these calculated data from old surveys rather than the MD, you are introducing unnecessary positioning errors associated with older calculation methods into your database.
Three measurements go into the directional survey: (1) measured depth, (2) deviation angle, and (3) direction of deviation. These measurements, taken at specific depth intervals, are used to calculate the directional survey of a well. Figure 3-17 shows a portion of the directional survey from a deviated well. The tabular printout for this directional survey has nine columns of data for each survey point in the well (Table 3-3).
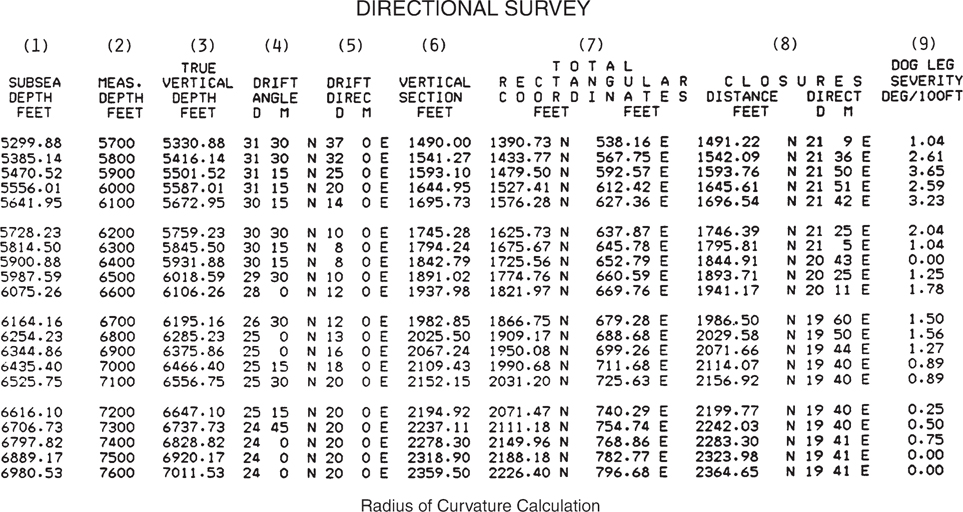
Figure 3-17 Part of the directional survey for a deviated well. (Published by permission of Gardes Directional Drilling.)
Table 3-3 Explanation of data shown in Figure 3-17
Column |
Data |
|---|---|
1 |
Subsea depth of wellbore in feet |
2 |
Measured depth of wellbore in feet |
3 |
True vertical depth of wellbore in feet |
4 |
Angle of wellbore deviation (inclination angle) |
5 |
Planned direction of wellbore (true bearing) |
6 |
Distance in feet from the surface location along the proposed directional path |
7 |
True bearing and distance of each survey point from the surface location in rectangular coordinates |
8 |
True bearing and distance from surface location directly to each survey point |
9 |
Maximum change in hole angle in degrees per 100 ft |
If the cased or surface section of the hole was surveyed with a nonmagnetic survey tool such as a drift indicator, the angle of the cased portion of the hole will be displayed on the survey along with an estimate of the maximum possible deviation of this portion of the hole, as shown in Figure 3-18. The 146.75-ft maximum deviation, prominently shown on the survey, indicates that if the wellbore drift in the cased portion of the hole were all in the same direction, the well at a depth of 3513 ft could be as much as 146.75 ft from the surface location. Notice at the end of the survey that it indicates that the bottom of the hole lies within a circle of radius 146.75 ft with its center located 203.94 ft south 63°27' west of the surface location. Such information may be important in fault, structure, and isochore mapping.

Figure 3-18 A directional survey from a well in which the surface casing was surveyed with a Totco tool providing deviation angle but not direction. Notice, at 3513 ft, that the maximum possible deviation of the cased hole is 146.75 ft. This assumes that the wellbore deviation in this portion of the hole was in one direction.
Directional surveys are used to plot wellbores on base maps. The applications of these plots are discussed later in this chapter.
Directional Survey Uncertainties
The error introduced by the method of calculation becomes almost academic when the other directional survey uncertainties are considered. Uncertainty in measurement can be directly related to the type of survey tool and its operating condition and procedures. The diagrams in Figures 3-19 and 3-20 are derived from a predictive mathematical model that was based on extensive research on North Sea wells by Wolff and de Wardt (1981), who showed that position uncertainties of boreholes are controlled by systematic errors. Vertical uncertainty (Fig. 3-19) refers to inconsistencies in determination of depths. Lateral uncertainty (Fig. 3-20) applies to inconsistencies in determination of lateral position. Magnetic surveys are compared to gyroscopic surveys. The magnetic and free gyroscope surveys display a significant range of potential inaccuracy, which can be due to the quality of survey equipment, operating procedures, and wellbore position. Note that more highly deviated wellbores are subject to more uncertainty in position. The actual predicted amounts of inaccuracy are not directly applicable to areas other than the North Sea, circa 1980, for a variety of reasons. For example, a higher latitudinal position produces more uncertainty in magnetic surveys. Also, the mathematical model does not apply to horizontal wells, including extended-reach wells. Many companies have detailed proprietary information about degree of error in particular types of survey tools, as used under certain operating conditions in given areas.
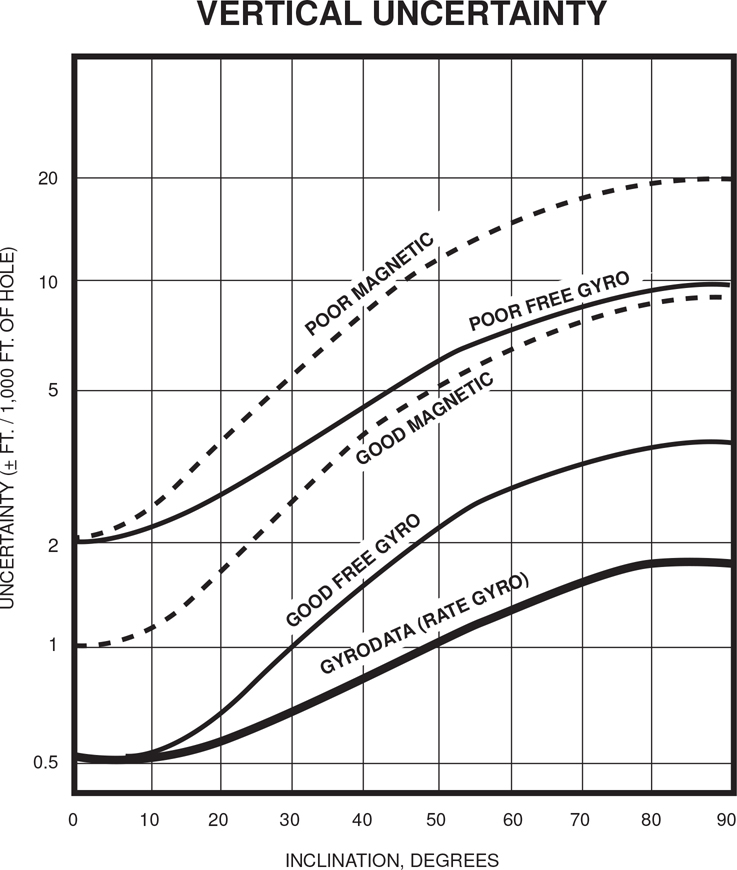
Figure 3-19 Expected vertical uncertainty in a deviated well considering various types of surveys. (Modified from Wolff and de Wardt 1981. Published by permission of the Journal of Petroleum Technology and Gyrodata, Inc.)
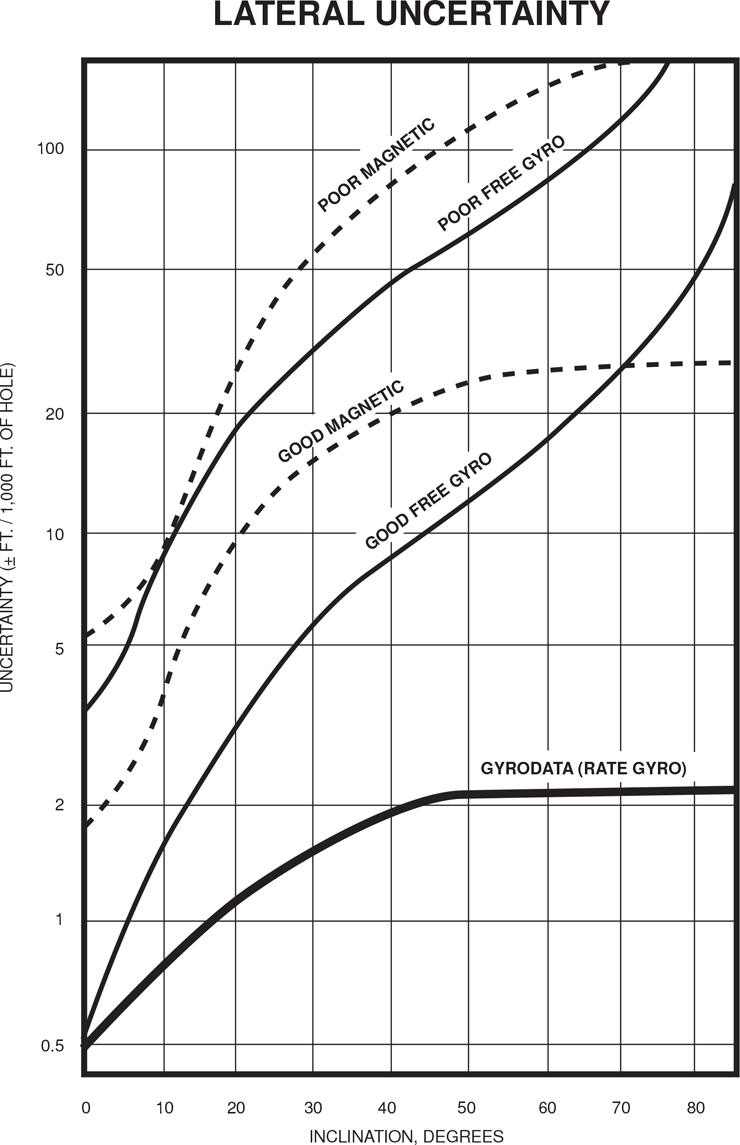
Figure 3-20 Expected lateral uncertainty in a deviated well considering various types of survey tools. (Modified from Wolff and de Wardt 1981. Published by permission of the Journal of Petroleum Technology and Gyrodata, Inc.)
Tenneco Oil Company conducted a detailed study of directional survey uncertainties in 1980. An important conclusion from the study indicates that there is a 90% certainty that any directional well will have an error of 35 ft or less TVD and 140 ft or less in departure. This conclusion is drawn irrespective of MD, hole angle, or survey type. This means that wells with hydrocarbon contacts that vary up to 35 ft TVD may well be in the same reservoir, with the variations due merely to survey error rather than such geological factors as permeability barriers or faults.
Today’s directional surveys are potentially more accurate than those described above, provided that the tools and operating procedures are of high quality. However, that does nothing to mitigate the errors inherent in surveys of older wells. Always remember that data based on directional wells, including new wells, should not be taken at face value. Apparent discrepancies in data used in mapping may be due to errors in depth and lateral position of points in wells. For example, the depth of a mapped surface or a water contact in a deviated well may not match satisfactorily with depths at nearby points. The reason could be an error in the directional survey or perhaps in the spotting of the wellbore. The same caution applies even to data discrepancy in a vertical well, which may have a significant but unrecognized deviation from the vertical.
Jamieson (2012) gives some typical current uncertainties in modern directional surveys. He states that a typical uncertainty in MD is 2 m/1000 m, a typical uncertainty in inclination is 0.3 deg, and a typical uncertainty in azimuth is 1 deg. These uncertainties result in a cone of location uncertainty along the wellbore and ellipses of uncertainty at TD (Fig. 3-21).

Figure 3-21 Ellipses of uncertainty in a hypothetical well drilled 4000 m vertically and then 3000 m horizontally and surveyed with modern directional survey tools. (a) Vertical section showing vertical and lateral uncertainty in a vertical plane. (b) Plan view showing lateral uncertainty. (Jamieson 2012. Published with permission of the author.)
Survey errors can be corrected in some cases in fields that have hydrocarbon/water contacts. Wells are often “corrected” to fit the contact. This is usually done by selecting a contact that fits most of the wells and then adjusting the depth of the well(s) that does not fit. An example of how to adjust a well is shown in Figure 3-22. The water contact in Wells No. 1 and 2 is at a depth of −9738 ft, whereas the contact in Well No. 3 is at a depth of −9748 ft. As data from two wells are in agreement with a water contact at −9738 ft, Well No. 3 is adjusted upward 10 ft to correct the water level from −9748 ft to −9738 ft. Not only is the water level corrected, but the structural depths of the sand (top and base) are also corrected upward 10 ft. Therefore, the top of the sand at a depth of −9720 ft becomes −9710 ft. In some cases, with stacked pays, depth shifting wells to produce a flat-water contact at one horizon will also significantly reduce water contact depth variation at other horizons. An understanding of directional survey errors can at times eliminate the need for a “production fault” or “permeability barrier” to explain discrepancies in water levels. Avoiding such production faults or permeability barriers can have a significant impact on field development plans.
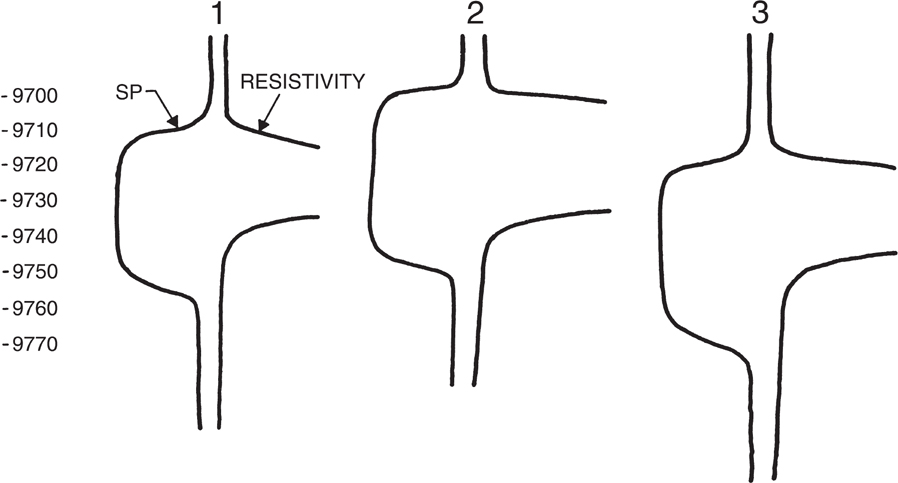
Figure 3-22 Different hydrocarbon/water contacts caused by directional survey errors.
Sag Correction in MWD Directional Surveys
The BHA of the tool string has to be flexible enough to pass through curves in the wellbore. When wells are drilled at high inclinations, the flexibility of the BHA causes it to sag, which can cause an error in the inclination reading of the sensor (Jamieson 2012). Wells drilled at inclinations above 45 deg should have sag corrections applied to the MWD directional survey. If a well with an MWD survey does not seem to fit the map or if production is disappointing, it could be due to a failure to apply a sag correction (Jamieson, 2012).
Directional Well Plots
Directional survey data are used to determine the depth and lateral position of the borehole along its entire length. These data are normally plotted on a base map in one of two ways: (1) as straight lines from the surface to BHL or (2) as detailed directional plots.
The simplified straight-line method of plotting a directional well is shown in Figure 3-23a. The only data required and plotted on the base map are the surface location and BHL, which may be the only data available. The MD to TD may be recorded next to the BHL. A straight dashed line is usually drawn between the surface location and BHL. This directional well plot provides absolutely no information about the position or depth of the wellbore in the subsurface between the surface and bottomhole locations. Such a plot is not helpful in the interpretation, construction, and evaluation of fault, structure, or isochore maps. Some computer databases use this type of map to show what wells have been drilled in a given area. Data in the database is then tied to the wells on the screen and is available with the click of a mouse.
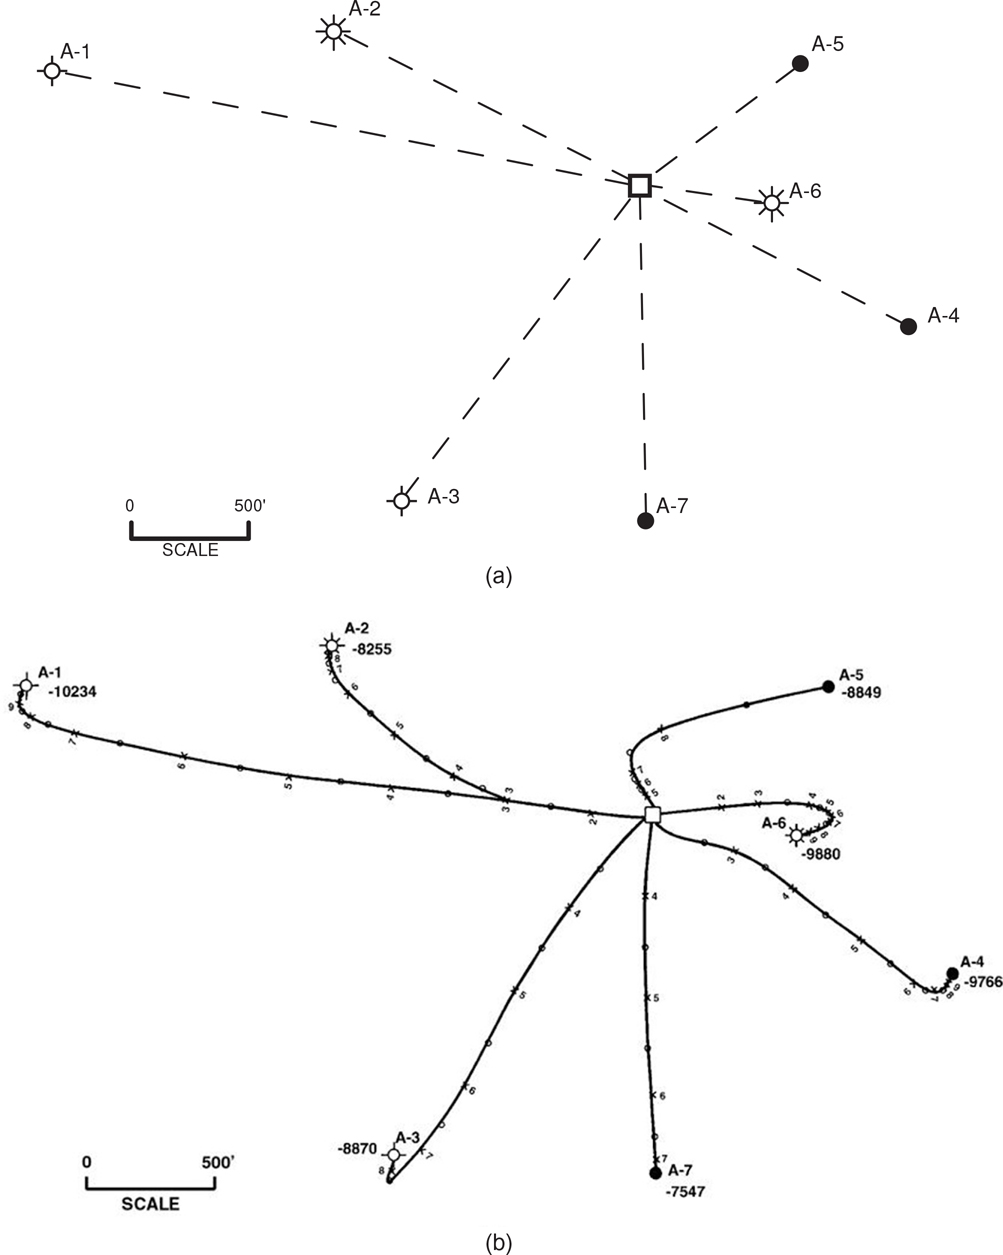
Figure 3-23 (a) Straight-line method of plotting directional wells in map view. (b) Detailed plot of directional survey data indicating the location and subsea depth of the wellbores along their entire length. Compare this plot to that in Figure 3-13a.
When directional survey data are actually plotted to provide detail about the lateral position and subsea depth of the wellbore, as shown in Figure 3-23b, the plot has real value. Such a plot provides a visual guide (in map view) to the location and subsea depth of the wellbore anywhere along its path. It saves time in preparing subsurface maps and is extremely helpful in the interpretation, construction, and evaluation of fault, structure, and isochore maps. Later chapters examine several important benefits to fault surface and structure mapping derived from plotting on a base map the actual location and subsea depth, at fixed increments (usually 500 ft or 1000 ft), of all directional wells. This type of basemap is seldom used these days, as computer workstations plot the location of formation tops and fault cuts on directional well paths.
Figure 3-24 illustrates the cross-sectional view of a directionally drilled well and the detailed map-view plot of the directional data in 500-ft increments of subsea TVD along the actual well path. If subsea data are to be used in mapping, the directional well data are corrected to subsea before being plotted on the base map.
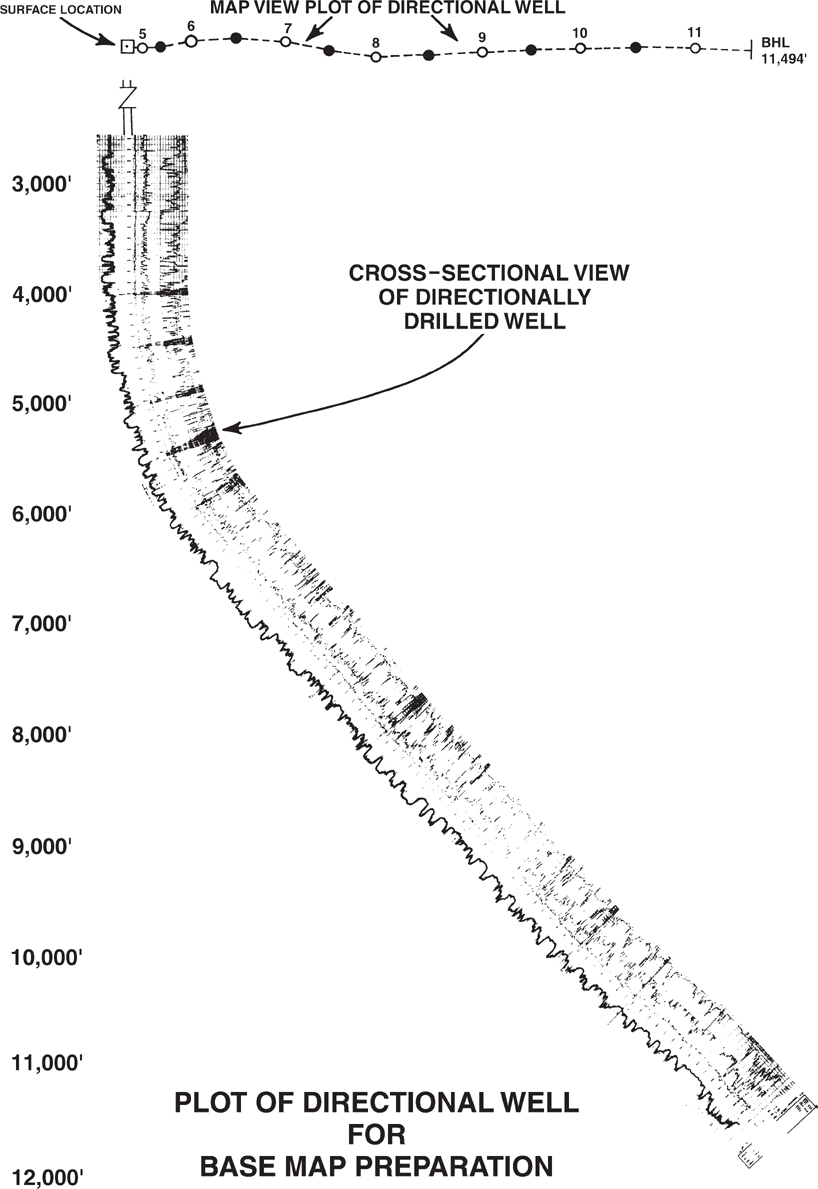
Figure 3-24 Cross-sectional view of a directional well and its detailed map-view plot in increments of 500 ft.
Figure 3-25 shows the map-view well plot for the Cognac “A” Platform in the Mississippi Canyon Block 194 in the U.S. Gulf of Mexico. The platform is the largest multiple-well platform in the world. The platform is located in 1000 ft of water and has a total height of 1260 ft. Wells were deviated with high angles, up to 75 deg. Horizontal displacements up to 11,500 ft result in a well pattern that covers an area with a diameter of more than 4 mi. Total cost for the project was over $1 billion.
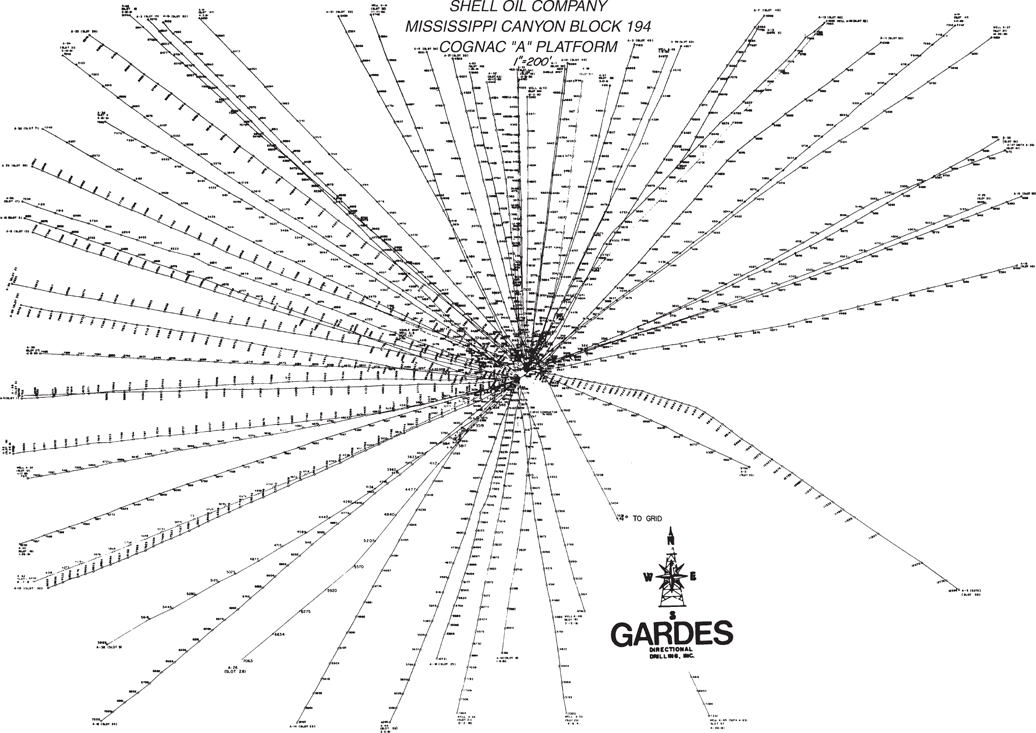
Figure 3-25 Spider directional well plot for the Cognac “A” Platform, Offshore Gulf of Mexico. (Published by permission of Gardes Directional Drilling.)
Wells Without Directional Surveys
Many wells that are planned to be vertical are drilled without running a directional survey. Wells that are reported to be vertical but do not have a directional survey are frequently not vertical. Anderson (1929) surveyed many “vertical” wells in California and showed that the wells frequently deviated significantly from the vertical. This situation is still true (Fig. 3-26) (Stigant 2012). If tops do not seem to match surrounding wells, it is frequently desirable to run a new directional survey if the wellbore is still available. New directional surveys should always be run in wells that are being sidetracked, and these directional surveys should be run as deep as possible.
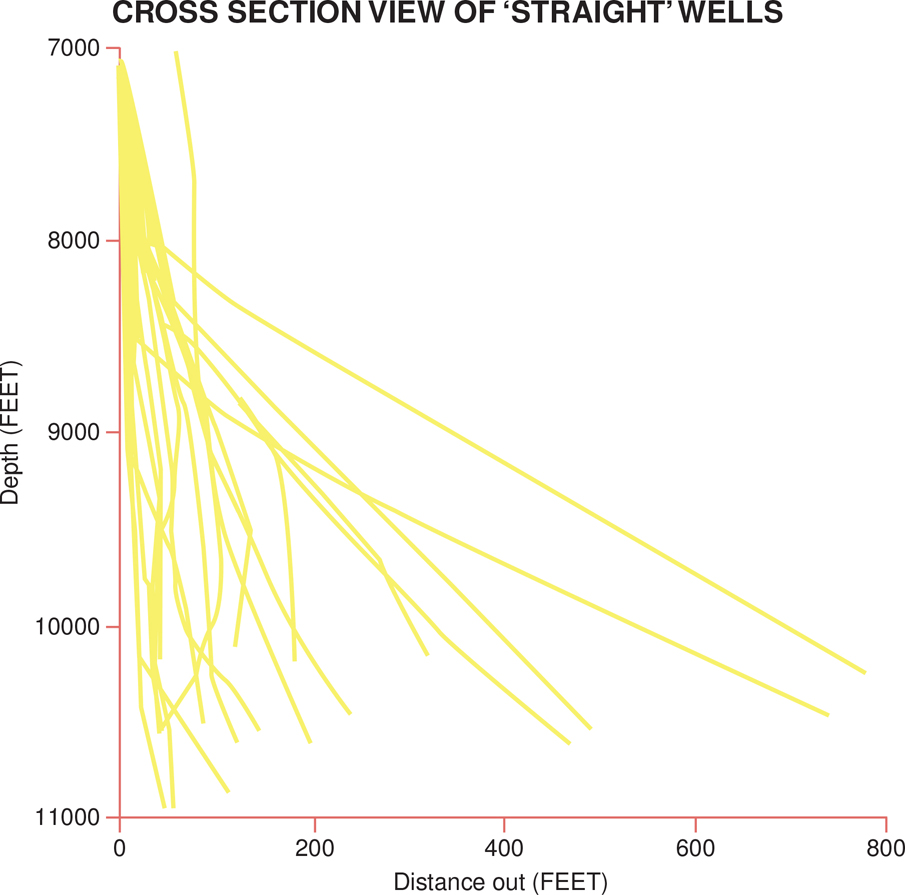
Figure 3-26 Cross sectional profile of a number of wells in West Texas that were thought to be vertical before directional surveys were run in them. (Modified after Stigant 2012. Used with permission of American Association of Petroleum Geologists [AAPG].)
Reservoir Pressures
In onshore or shallow water fields, where well costs are relatively low, there are frequently multiple wells that penetrate the hydrocarbon/water contact in a reservoir compartment. Figure 3-22 shows how directional survey uncertainties can result in different contact depths. In deep water and frontier fields, where well costs are much higher, there may be few if any penetrations of the hydrocarbon/water contact. In these areas, wells may rely on reservoir pressure data from repeat formation testers to identify hydrocarbon contacts and recognize separate reservoir compartments (e.g., Brown 2003; Chen 2014). Differences in depth measurement between LWD and wireline logs can result in pressure data that suggests reservoir compartmentalization where none may exist. Carefully corrected depth data can identify where the risk of compartmentalization may have been overestimated (Fig. 3-27).

Figure 3-27 Pressure data from three wells in a discovery. (a) One well’s pressure data lies 10 psi off the pressure trend from the other two wells, suggesting that the third well lies in a different fault block than the first two wells. (b) Post-job depth correction of the pressure data from the third well shifted the data down 42 ft, resulting in the pressure data being within 1 psi of the pressure trend from the other two wells, suggesting that the risk of the wells being in separate faults blocks is less. (From Cribbs 2020.)
Just as water contacts that differ due to directional survey uncertainties can be corrected, resulting in corrected formation tops, pressure data trends that differ due to directional survey issues or along hole depth measurement issues can be shifted to align, shifting formation tops as well. Before shifting the depth of tops, it is important to have convincing evidence that wells are in the same pressure compartment.
