
Getting Input from Sensors
6.0 Introduction
Getting and using input from sensors enables Arduino to respond to or report on the world around it. This is one of the most common tasks you will encounter. This chapter provides simple and practical recipes for how to use the most popular input devices and sensors. Wiring diagrams show how to connect and power the devices, and code examples demonstrate how to use data derived from the sensors.
Sensors respond to input from the physical world and convert this into an electrical signal that Arduino can read on an input pin. The nature of the electrical signal provided by a sensor depends on the kind of sensor and how much information it needs to transmit. Some sensors (such as photoresistors and Piezo knock sensors) are constructed from a substance that alters its electrical properties in response to physical change. Others are sophisticated electronic modules that use their own microcontroller to process information before passing a signal on for the Arduino.
Sensors use the following methods to provide information:
- Digital on/off
-
Some devices, such as the tilt sensor in Recipe 6.2 and the motion sensor in Recipe 6.4, simply switch a voltage on and off. These can be treated like the switch recipes shown in Chapter 5.
- Analog
-
Other sensors provide an analog signal (a voltage that is proportional to what is being sensed, such as temperature or light level). The recipes for detecting light (Recipe 6.3), temperature (Recipe 6.9), and sound (Recipe 6.8) demonstrate how analog sensors can be used. All of them use the
analogReadcommand that is discussed in Chapter 5. - Pulse width
-
Distance sensors, such as the PING))) in Recipe 6.5, provide data using pulse duration proportional to the distance value. Applications using these sensors measure the duration of a pulse using the
pulseIncommand. - Serial
-
Some sensors provide values using a serial protocol. For example, the GPS in Recipe 6.14 communicate through the Arduino serial port (see Chapter 4 for more on serial). Most Arduino boards only have one hardware serial port, so read Recipe 6.14 for an example of how you can add additional software serial ports if you have multiple serial sensors or the hardware serial port is occupied for some other task.
- Synchronous protocols: I2C and SPI
-
The I2C and SPI digital serial communications interfaces were created for processors and microcontrollers like Arduino to talk to external sensors and modules. For example, Recipe 6.15 shows how a gyroscope module is connected using I2C. These protocols are used extensively for sensors, actuators, and peripherals, and they are covered in detail in Chapter 13.
There is another generic class of sensing devices that you may make use of. These are consumer devices that contain sensors but are sold as devices in their own right, rather than as sensors. An example of this in this chapter is a PS/2 mouse . These devices can be very useful; they provide sensors already incorporated into robust and ergonomic devices. They are also inexpensive (often less expensive than buying the raw sensors that they contain), as they are mass-produced. You may have some of these lying around.
If you are using a device that is not specifically covered in a recipe, check the Arduino Library Manager to see if there is a library available for it (see Recipe 16.2). If not, you may be able to adapt a recipe for a device that produces a similar type of output. Information about a sensor’s output signal is usually available from the company from which you bought the device or from a datasheet for your device (which you can find through a Google search of the device part number or description).
Datasheets are aimed at engineers designing products to be manufactured, and they usually provide more detail than you need to just get the product up and running. If you can’t find a datasheet at the component vendor’s website, you can usually find it with a search engine by specifying the name of the component and the word “datasheet.” The information on output signal will usually be in a section referring to data format, interface, output signal, or something similar. Don’t forget to check the maximum voltage (usually in a section labeled “Absolute Maximum Ratings”) to ensure that you don’t damage the component.
Warning
Sensors designed for a maximum of 3.3 volts can be destroyed by connecting them to a voltage above that, such as an output pin on an Arduino board that operates at a 5 volt logic level. Check the absolute maximum rating for your device before connecting. If you need to connect a 5V output to a 3.3V-tolerant input, you can use a voltage divider in most cases. See Recipe 5.11 for more details on working with a voltage divider.
Reading sensors from the messy analog world is a mixture of science, art, and perseverance. You may need to use ingenuity and trial and error to get a successful result. A common problem is that the sensor just tells you a physical condition has occurred, not what caused it. Putting the sensor in the right context (location, range, orientation) and limiting its exposure to things that you don’t want to activate it are skills you will acquire with experience.
Another issue concerns separating the desired signal from background noise; Recipe 6.7 shows how you can use a threshold to detect when a signal is above a certain level, and Recipe 6.8 shows how you can take the average of a number of readings to smooth out noise spikes.
See Also
For information on working with an connecting electronic components, see Make: Electronics by Charles Platt (Make).
Making Things Talk by Tom Igoe (Make) addresses the intersection of science, art, and perseverance in designing and implementing sensor-based systems with Arduino.
See the introduction to Chapter 5 and Recipe 5.6 for more on reading analog values from sensors.
6.1 You Want an Arduino with Many Built-In Sensors
Problem
You want to use an Arduino with multiple sensors built in.
Solution
The Arduino Nano 33 BLE Sense is designed exactly for this type of situation. It is very small, inexpensive, fast, and includes eight sensor capabilities that are provided by a group of components built right into the board. Table 6-1 lists the components, their capabilities, and the name of the supporting library. Before you can use the Nano 33 BLE Sense, first open the Arduino Boards Manager and install the Arduino nRF528x Boards (Mbed OS) package (see Recipe 1.7). Next, install each of libraries listed in the Library Name column using the Library Manager (see Recipe 16.2).
| Component | Features | Library Name |
|---|---|---|
|
Broadcom APDS-9960 |
Gesture, Proximity, RGB Color |
Arduino_APDS9960 |
|
ST HTS221 |
Temperature, Relative Humidity |
Arduino_HTS221 |
|
ST LPS22HB |
Barometric Pressure |
Arduino_LPS22HB |
|
ST LSM9DS1 |
9DOF Inertial Measurement Unit (IMU): accelerometer, gyroscope, magnetometer |
Arduino_LSM9DS1 |
|
ST MP34DT05 |
Digital microphone |
(Installed by default with Nano 33 BLE board package) |
After you’ve installed support for the Nano 33 BLE Sense board and the supporting libraries, use the Tools menu to configure the Arduino IDE to use the Nano 33 BLE board and set the correct port. As of this writing, both the Nano 33 BLE and Nano 33 BLE Sense use the same Board setting in the IDE (the Nano 33 BLE is the same as the Nano 33 BLE Sense, just without all the cool sensors). Next, load the following sketch onto the board and open the serial monitor:
/*
 * Arduino Nano BLE Sense sensor demo
 */

#include <Arduino_APDS9960.h>
#include <Arduino_HTS221.h>
#include <Arduino_LPS22HB.h>
#include <Arduino_LSM9DS1.h>

void setup() {

  Serial.begin(9600);
  while (!Serial);

  if (!APDS.begin()) { // Initialize gesture/color/proximity sensor
    Serial.println("Could not initialize APDS9960.");
    while (1);
  }
  if (!HTS.begin()) {  // Initialize temperature/humidity sensor
    Serial.println("Could not initialize HTS221.");
    while (1);
  }
  if (!BARO.begin()) { // Initialize barometer
    Serial.println("Could not initialize LPS22HB.");
    while (1);
  }
  if (!IMU.begin()) {  // Initialize inertial measurement unit
    Serial.println("Could not initialize LSM9DS1.");
    while (1);
  }

  prompt(); // Tell users what they can do.
}

void loop() {

  // If there's a gesture, run the appropriate function.
  if (APDS.gestureAvailable()) {
    int gesture = APDS.readGesture();
    switch (gesture) {
      case GESTURE_UP:
        readTemperature();
        break;

      case GESTURE_DOWN:
        readHumidity();
        break;

      case GESTURE_LEFT:
        readPressure();
        break;

      case GESTURE_RIGHT:
        Serial.println("Spin the gyro!
x, y, z");
        for (int i = 0; i < 10; i++)
        {
          readGyro();
          delay(250);
        }
        break;

      default:
        break;
    }
    prompt(); // Show the prompt again
  }
}
void prompt() {
  Serial.println("
Swipe!");
  Serial.println("Up for temperature, down for humidity");
  Serial.println("Left for pressure, right for gyro fun.
");
}

void readTemperature()
{
  float temperature = HTS.readTemperature(FAHRENHEIT);
  Serial.print("Temperature: "); Serial.print(temperature);
  Serial.println(" °F");
}

void readHumidity()
{
  float humidity = HTS.readHumidity();
  Serial.print("Humidity: "); Serial.print(humidity);
  Serial.println(" %");
}

void readPressure()
{
  float pressure = BARO.readPressure(PSI);
  Serial.print("Pressure: "); Serial.print(pressure);
  Serial.println(" psi");
}

void readGyro()
{
  float x, y, z;
  if (IMU.gyroscopeAvailable()) {
    IMU.readGyroscope(x, y, z);
    Serial.print(x); Serial.print(", ");
    Serial.print(y); Serial.print(", ");
    Serial.println(z);
  }
}
The Serial Monitor will display a prompt that tells you how you can interact with the Arduino Nano 33 BLE Sense. To swipe in a given direction, hold your hand over the top of the board and make a wiping motion. To swipe up, wave your hand in a motion that moves from the board’s USB port up to the u-blox module on the opposite end.
Discussion
The code in this recipe uses several of the sensors built in to the Nano 33 BLE Sense: the gesture sensor (APDS-9960), the temperature/humidty sensor (HTS221), the barometer (LPS22HB), and the gyroscope (LSM9DS1). The setup function waits until the serial port is open, then it initializes each of these devices, and if it encounters an error, it will display an error message and hang by entering an endless loop with while(1);. At the end of setup, the sketch calls the prompt routine, which displays instructions on the Serial Monitor.
Within the loop, the sketch checks to see if the APDS-9960 has detected a gesture. If so, it dispatches execution to a function that corresponds to the desired sensor. Each of these functions reads the state of the sensor and displays it on the Serial Monitor. For the gyroscope, the sketch prompts you to spin the board around, and then enters a loop where it reads the gyro ten times with a slight delay so you can see how the values change with your motion.
See Also
The Arduino forum dedicated to the Nano 33 BLE Sense can be found here: https://forum.arduino.cc/index.php?board=139.0. You may also want to visit the forum for the Nano 33 BLE, which is a variant of the board without all the built-in sensors: https://forum.arduino.cc/index.php?board=138.0.
Recipe 6.15Recipe 6.15 has more on using a gyroscope with Arduino.
Recipe 6.17 has more on accelerometers.
6.2 Detecting Movement
Problem
You want to detect when something is moved, tilted, or shaken.
Solution
This sketch uses a switch that closes a circuit when tilted, called a tilt sensor. The switch recipes in Chapter 5 (Recipes 5.1 and 5.2) will work with a tilt sensor substituted for the switch.
The sketch below (circuit shown in Figure 6-1) will switch on the LED attached to pin 11 when the tilt sensor is tilted one way, and the LED connected to pin 12 when it is tilted the other way:
/*
 * tilt sketch
 *
 * a tilt sensor attached to pin 2 lights one of
 * the LEDs connected to pins 11 and 12 depending
 * on which way the sensor is tilted
 */

const int tiltSensorPin = 2;  // pin the tilt sensor is connected to
const int firstLEDPin  = 11;  // pin for one LED
const int secondLEDPin = 12;  // pin for the other

void setup()
{
  pinMode (tiltSensorPin, INPUT_PULLUP); // Tilt sensor connected to this pin

  pinMode (firstLEDPin, OUTPUT);   // first output LED
  pinMode (secondLEDPin, OUTPUT);  // and the second
}

void loop()
{
  if (digitalRead(tiltSensorPin) == LOW){ // The switch is on (upright)
    digitalWrite(firstLEDPin, HIGH);      // Turn on the first LED
    digitalWrite(secondLEDPin, LOW);      // and turn off the second.
  }
  else{                                   // The switch is off (tilted)
    digitalWrite(firstLEDPin, LOW);       // Turn the first LED off
    digitalWrite(secondLEDPin, HIGH);     // and turn on the second.
  }
}

Tilt sensor and LEDs
Discussion
The most common tilt sensor is a ball bearing in a tube with contacts at one end. When the tube is tilted the ball rolls away from the contacts and the connection is broken. When the tube is tilted to roll the other way the ball touches the contacts and completes a circuit. Markings, or pin configurations, may show which way the sensor should be oriented. Tilt sensors are sensitive to small movements of around 5 to 10 degrees when oriented with the ball just touching the contacts. If you position the sensor so that the ball bearing is directly above the contacts, the LED state will only change if it is turned right over. This can be used to tell if something is upright or upside down.
To determine if something is being shaken, you need to check how long it’s been since the state of the tilt sensor changed (this recipe’s Solution just checks if the switch was open or closed). If it hasn’t changed for a time you consider significant, the object is not shaking. Changing the orientation of the tilt sensor will change how vigorous the shaking needs to be to trigger it. The following code lights the built-in LED when the sensor is shaken:
/*
 * shaken sketch
 * tilt sensor connected to pin 2
 * using the built-in LED
 */

const int tiltSensorPin = 2;
const int ledPin = LED_BUILTIN;
int tiltSensorPreviousValue = 0;
int tiltSensorCurrentValue  = 0;
long lastTimeMoved = 0;
int shakeTime = 50;

void setup()
{
  pinMode (tiltSensorPin, INPUT_PULLUP);
  pinMode (ledPin, OUTPUT);
}

void loop()
{
  tiltSensorCurrentValue = digitalRead(tiltSensorPin);
  if (tiltSensorPreviousValue != tiltSensorCurrentValue)
  {
    lastTimeMoved = millis();
    tiltSensorPreviousValue = tiltSensorCurrentValue;
  }

  if (millis() - lastTimeMoved < shakeTime){
    digitalWrite(ledPin, HIGH);
  }
  else {
    digitalWrite(ledPin, LOW);
  }
}
Many mechanical switch sensors can be used in similar ways. A float switch can turn on when the water level in a container rises to a certain level (similar to the way a float valve works in a toilet cistern). A pressure pad such as the one used in shop entrances can be used to detect when someone stands on it. If your sensor turns a digital signal on and off, something similar to this recipe’s sketch will be suitable.
See Also
Chapter 5 contains background information on using switches with Arduino.
Recipe 12.1 has more on using the millis function to determine delay.
6.3 Detecting Light
Problem
You want to detect changes in light levels. You may want to detect a change when something passes in front of a light detector or to measure the light level—for example, detecting when a room is getting too dark.
Solution
The easiest way to detect light levels is to use a photoresistor, also known as a Light-Dependent Resistor (LDR). This changes resistance with changing light levels, and when connected in the circuit shown in Figure 6-2 it produces a change in voltage that the Arduino analog input pins can sense.
Note
Photoresistors contain a compound (cadmium sulfide) that is a hazardous substance. A phototransistor is a perfectly good alternative to a photoresistor. A phototransistor has a long lead and a short lead, much like an LED. You can wire it exactly as shown in the figure, but you must connect the long lead to 5V and the short lead to the resistor and pin 0. Be sure to buy a phototransistor such as Adafruit part number 2831 (https://www.adafruit.com/product/2831), that can sense visible light so you can test it with a common light source.

Connecting a light dependent resistor
The sketch for this recipe is simple:
/*
 * Light sensor sketch
 *
 * Varies the blink rate based on the measured brightness
 */
const int ledPin = LED_BUILTIN; // Built-in LED
const int sensorPin = A0;       // connect sensor to analog input 0

void setup()
{
  pinMode(ledPin, OUTPUT);  // enable output on the led pin
}

void loop()
{
  int rate = analogRead(sensorPin);    // read the analog input
  digitalWrite(ledPin, HIGH);   // set the LED on
  delay(rate);                  // wait duration dependent on light level
  digitalWrite(ledPin, LOW);    // set the LED off
  delay(rate);
}
Discussion
The circuit for this recipe is the standard way to use any sensor that changes its resistance based on some physical phenomenon (see Chapter 5 for background information on responding to analog signals). With the circuit in Figure 6-2, the voltage on analog pin 0 changes as the resistance of the photoresistor (or phototransistor) changes with varying light levels.
A circuit such as this will not give the full range of possible values from the analog input—0 to 1,023—as the voltage will not be swinging from 0 volts to 5 volts. This is because there will always be a voltage drop across each resistance, so the voltage where they meet will never reach the limits of the power supply. When using sensors such as these, it is important to check the actual values the device returns in the situation you will be using it. Then you have to determine how to convert them to the values you need to control whatever you are going to control. See Recipe 5.7 for more details on changing the range of values.
The photoresistor is a simple kind of sensor called a resistive sensor. A range of resistive sensors respond to changes in different physical characteristics.
Arduino cannot measure resistance directly, so the Solution uses a fixed-value resistor in combination with a resistive sensor to form a voltage divider like you saw back in Recipe 5.11. The analog pins read voltage, not resistance, so the only way for Arduino to measure resistance is if that resistance is somehow changing a voltage. A voltage divider uses a pair of resistors to produce an output voltage that is dependent on the relationship between the input voltage and two resistors. So, you can combine a fixed-value resistor with a component of variable resistance, such as an photoresistor, and Arduino’s analog pin will see a voltage that changes based on what the photoresistor is sensing.
Similar circuits will work for other kinds of simple resistive sensors, although you may need to adjust the resistor to suit the sensor. Choosing the best resistor value depends on the photoresistor you are using and the range of light levels you want to monitor. Engineers would use a light meter and consult the datasheet for the photoresistor, but if you have a multimeter, you can measure the resistance of the photoresistor at a light level that is approximately midway in the range of illumination you want to monitor. Note the reading and choose the nearest convenient resistor to this value. You can also read the values from Arduino, print it to the Serial port, and use the Serial Plotter to show the highs and lows (see Recipe 4.1).
Be aware of any artificial light sources in your environment that flicker on and off at an unusual rate, such as neon or some LED lights. Even though they turn off and on too quickly for a human to discern, these may register as low-light conditions to an Arduino. You can adjust for this by taking a moving average of the readings (you can see an example of this calculation in Recipe 6.8).
See Also
This sketch was introduced in Recipe 1.6; see that Recipe for more on this and variations on this sketch.
6.4 Detecting Motion of Living Things
Problem
You want to detect when people or animals are moving near a sensor.
Solution
Use a motion sensor such as a Passive Infrared (PIR) sensor to change values on a digital pin when a living creature (or an object that radiates warmth) moves nearby.
Sensors such as the Adafruit PIR (motion) Sensor (part number 189) and the Parallax PIR Sensor (555-28027) can be easily connected to Arduino pins, as shown in Figure 6-3. Some PIR sensors, such as the SparkFun PIR Motion Sensor (SEN-13285) require a pull-up resistor on the sensor’s output. If you use the pull-up resistor, you will need to use the INPUT_PULLUP mode and invert the logic in the sketch as described in the Discussion.

Connecting a PIR motion sensor
Check the datasheet for your sensor to identify the correct pins. For example, the Adafruit sensor has pins marked “OUT,” “-,” and “+” (for Output, Gnd, and +5V) and the Parallax sensor is labeled GND, VCC, and OUT.
The following sketch will light your board’s built-in LED when the sensor detects motion:
/*
   PIR sketch
   a Passive Infrared motion sensor connected to pin 2
   lights the LED on the built-in LED
*/

const int ledPin = LED_BUILTIN;  // choose the pin for the LED
const int inputPin = 2;          // choose the input pin (for the PIR sensor)

void setup() {
  pinMode(ledPin, OUTPUT);       // declare LED as output
  pinMode(inputPin, INPUT);      // declare pin as input
}

void loop(){
  int val = digitalRead(inputPin);  // read input value
  if (val == HIGH)                  // check if the input is HIGH
  {
    digitalWrite(ledPin, HIGH);     // turn LED on if motion detected
    delay(500);
    digitalWrite(ledPin, LOW);      // turn LED off
  }
}
Discussion
This code is similar to the pushbutton examples shown in Chapter 5. That’s because the sensor acts like a switch when motion is detected. Different kinds of PIR sensors are available, and you should check the information for the one you have connected.
Some sensors, such as the Parallax and Adafruit PIR sensors, have a jumper that determines how the output behaves when motion is detected. In one mode, the output remains HIGH while motion is detected, or it can be set so that the output goes HIGH briefly and then LOW when triggered. The example sketch in this recipe’s Solution will work in either mode.
Other sensors may go LOW on detecting motion. If your sensor’s output pin goes LOW when motion is detected, change the line that checks the input value so that the LED is turned on when LOW:
if (val == LOW) // motion detected when the input is LOW
If your sensor’s documentation indicates that it needs a pull-up resistor, you should change the code in setup that initializes inputPin:
pinMode(inputPin, INPUT_PULLUP); // declare pin as input with pull-up resistor
PIR sensors come in a variety of styles and are sensitive over different distances and angles. Careful choice and positioning can make them respond to movement in part of a room, rather than all of it. Some PIR sensors have a potentiometer that you can adjust with a screwdriver to change the PIR’s sensitivity.
6.5 Measuring Distance
Problem
You want to measure the distance to something, such as a wall or someone walking toward the Arduino.
Solution
This recipe uses the Parallax PING))) ultrasonic distance sensor to measure the distance of an object ranging from 2 centimeters to around 3 meters. It displays the distance on the Serial Monitor and flashes an LED faster as objects get closer (Figure 6-4 shows the connections):
/* Ping))) Sensor
 * prints distance and changes LED flash rate
 * depending on distance from the Ping))) sensor
 */

const int pingPin = 5;
const int ledPin = LED_BUILTIN; // LED pin

void setup()
{
  Serial.begin(9600);
  pinMode(ledPin, OUTPUT);
}

void loop()
{
  int cm = ping(pingPin);
  Serial.println(cm);

  digitalWrite(ledPin, HIGH);
  delay(cm * 10); // each centimeter adds 10 milliseconds delay
  digitalWrite(ledPin, LOW);
  delay(cm * 10);
}

// Measure distance and return the result in centimeters
int ping(int pingPin)
{
  long duration; // This will store the measured duration of the pulse

  // Set the pingPin to output.
  pinMode(pingPin, OUTPUT);
  digitalWrite(pingPin, LOW); // Stay low for 2μs to ensure a clean pulse
  delayMicroseconds(2);

  // Send a pulse of 5μs
  digitalWrite(pingPin, HIGH);
  delayMicroseconds(5);
  digitalWrite(pingPin, LOW);

  // Set the pingPin to input and read the duration of the pulse.
  pinMode(pingPin, INPUT);
  duration = pulseIn(pingPin, HIGH);

  // convert the time into a distance
  return duration / 29 / 2;
}

Ping))) sensor connections
Discussion
Ultrasonic sensors provide a measurement of the time it takes for sound to bounce off an object and return to the sensor.
The “ping” sound pulse is generated when the pingPin level goes HIGH for two microseconds. The sensor will then generate a pulse that terminates when the sound returns. The width of the pulse is proportional to the distance the sound traveled and the sketch then uses the pulseIn function to measure that duration. The speed of sound is about 340 meters per second, which is 29 microseconds per centimeter. The formula for the distance of the round trip is: duration in microseconds / 29.
So, the formula for the one-way distance in centimeters is: duration in microseconds / 29 / 2. The 340 meters per second figure is the approximate speed of sound at 20°C/68°F. If your ambient temperature is significantly different from, you can use a speed of sound calculator such as this one from the United States National Weather Service.
A lower cost alternative to the Parallax PING sensor is the HC-SR04, which is available from many suppliers and also on eBay. Although this has less accuracy and range, it can be suitable where the price is more important than performance. The HC-SR04 has separate pins to trigger the sound pulse and detect the echo. This variation on the previous sketch shows its use.
/* HC-SR04 Sensor
 * prints distance and changes LED flash rate
 * depending on distance from the HC-SR04 sensor
 */

const int trigPin = 5; // Pin to send the ping from
const int echoPin = 6; // Pin to read the response from
const int ledPin  = LED_BUILTIN; // LED pin

void setup()
{
  Serial.begin(9600);
  pinMode(ledPin, OUTPUT);
  pinMode(trigPin, OUTPUT);
  pinMode(echoPin, INPUT);
}

void loop()
{
  int cm = calculateDistance(trigPin);
  Serial.println(cm);

  digitalWrite(ledPin, HIGH);
  delay(cm * 10); // each centimeter adds 10 milliseconds delay
  digitalWrite(ledPin, LOW);
  delay(cm * 10);

  delay(60); // datasheet recommends waiting at least 60ms between measurements
}

int calculateDistance(int trigPin)
{
  long duration; // This will store the measured duration of the pulse

  digitalWrite(trigPin, LOW);
  delayMicroseconds(2);  // Stay low for 2μs to ensure a clean pulse
  digitalWrite(trigPin, HIGH);
  delayMicroseconds(10); // Send a pulse of 10μs to ensure a clean pulse
  digitalWrite(trigPin, LOW);

  // Read the duration of the response pulse
  duration = pulseIn(echoPin, HIGH);

  // convert time into distance
  return duration / 29 / 2;
}
The HC-SR04 datasheet recommends at least 60 milliseconds between measurements, but blinking the LED takes up some time, so the delay(60); adds more of a delay than is needed. But if you are writing code that does not add its own delay, you’ll want to keep that 60ms delay in there.
The HC-SR04 works best with 5 volts but can be used with a 3.3v boards that are 5 volt tolerant, such as the Teensy3.

HC-SR04 Connections
The MaxBotix EZ1 is another ultrasonic sensor that can be used to measure distance. It is easier to integrate than the Ping))) or the HC-SR04 because it does not need to be “pinged” and it can operate on 3.3 or 5 volts. It provides continuous distance information, either as an analog voltage or proportional to pulse width. Figure 6-6 shows the connections.

Connecting EZ1 PW output to a digital input pin
The sketch that follows uses the EZ1 pulse width (PW) output to produce output similar to that of the previous sketch:
/*
 * EZ1Rangefinder Distance Sensor
 * prints distance and changes LED flash rate
 * depending on distance from the sensor
 */

const int sensorPin = 5;
const int ledPin    = LED_BUILTIN;

void setup()
{
  Serial.begin(9600);
  pinMode(ledPin, OUTPUT);
}

void loop()
{
  long value = pulseIn(sensorPin, HIGH) ;
  int cm = value / 58;        // pulse width is 58 microseconds per cm
  Serial.println(cm);

  digitalWrite(ledPin, HIGH);
  delay(cm * 10 ); // each centimeter adds 10 milliseconds delay
  digitalWrite(ledPin, LOW);
  delay( cm * 10);

  delay(20);
}
The EZ1 is powered through +5V and ground pins and these are connected to the respective Arduino pins. Connect the EZ1 PW pin to Arduino digital pin 5. The sketch measures the width of the pulse with the pulseIn command. The width of the pulse is 58 microseconds per centimeter, or 147 microseconds per inch.
Note
You may need to add a capacitor across the +5V and Gnd lines to stabilize the power supply to the sensor if you are using long connecting leads. If you get erratic readings, connect a 10 uF capacitor at the sensor (see Appendix C for more on using decoupling capacitors).
You can also obtain a distance reading from the EZ1 through its analog output—connect the AN pin to an analog input and read the value with analogRead. The following code prints the analog input converted to cm:
int value = analogRead(A0);
float mv = (value / 1024.0) * 5000 ;
float inches  =  mv / 9.8; // 9.8mv per inch per datasheet
float cm = inches * 2.54;
Serial.print("in: "); Serial.println(inches);
Serial.print("cm: "); Serial.println(cm);
The value from analogRead is around 4.8mV per unit (see Recipe 5.6 for more on analogRead) and according to the datasheet, the EZ1 output is 9.8mV/inch when powered at 5V, and 6.4mV/inch at 3.3V. Multiply the result in inches by 2.54 to get the distance in centimeters.
See Also
Recipe 5.6 explains how to convert readings from analogInput into voltage values.
The Arduino reference for pulseIn: https://www.arduino.cc/reference/en/language/functions/advanced-io/pulsein/
6.6 Measuring Distance Precisely
Problem
You want to measure how far objects are from the Arduino with more precision than in Recipe 6.5.
Solution
Time of flight distance sensors use a tiny laser and sensor to measure how long it takes for a laser light signal to return to it. While it has a much more narrow field of view than the ultrasonic sensors you saw in Recipe 6.5, laser-based time of flight sensors can be more precise. However, time of flight sensors typically have a smaller range. For example, while the HC-SR04 has a range of 2cm to 4 meters, the VL6180X time of flight sensor can measure 5cm to 10cm. This sketch provides similar functionality to Recipe 6.5, but it uses the VL6180X Time of Flight Distance Ranging Sensor from Adafruit (product ID 3316). Figure 6-7 shows the connections. To use this sketch, you’ll need to install the Adafruit_VL6180X library (see Recipe 16.2).
/* tof-distance sketch
 * prints distance and changes LED flash rate based on distance from sensor
 */

#include <Wire.h>
#include "Adafruit_VL6180X.h"

Adafruit_VL6180X sensor = Adafruit_VL6180X();

const int ledPin  = LED_BUILTIN; // LED pin

void setup() {
  Serial.begin(9600);
  while (!Serial);

  if (! sensor.begin()) {
    Serial.println("Could not initialize VL6180X");
    while (1);
  }
}

void loop() {

  // Read the range and check the status for any errors
  byte cm     = sensor.readRange();
  byte status = sensor.readRangeStatus();

  if (status == VL6180X_ERROR_NONE)
  {
    Serial.println(cm);

    digitalWrite(ledPin, HIGH);
    delay(cm * 10); // each centimeter adds 10 milliseconds delay
    digitalWrite(ledPin, LOW);
    delay(cm * 10);

  }
  else
  {
    // Major errors are worth mentioning
    if  ((status >= VL6180X_ERROR_SYSERR_1) && (status <= VL6180X_ERROR_SYSERR_5)) {
      Serial.println("System error");
    }
  }
  delay(50);
}

Connecting the VL6180X time of flight distance sensor
Discussion
The VL6180X sensor uses the I2C protocol (see Chapter 13) to communicate, which requires a connection between the Arduino and the sensor’s SCL and SDA pins. The sketch includes the Wire library, which provides support for I2C, and also includes the Adafruit_VL6180X library to provide functions for working with the sensor. Before the setup function, the sketch defines an object (sensor) to represent the sensor, and later initializes it in setup.
The setup function initializes the Serial port and attempts to initialize the sensor. If that fails, it prints an error message to the serial port, and stops running the sketch by entering an infinite while loop.
On each run thought the loop, the sketch reads the range and also checks the sensor status to make sure it’s not in an error state. If it gets a good reading, it displays the distance to the serial port and blinks the LED at a rate determined by the distance it measured. The example included with the Adafruit_VL6180X library has a more exhaustive check of all the possible error states. With the exception of the system errors that this sketch checks for, most errors are transient and will be corrected on a subsequent reading.
See Also
Detailed comparisons of ultrasonic, LED, and laser-based distance sensors are available from both DIY Projects and SparkFun.
6.7 Detecting Vibration
Problem
You want to respond to vibration; for example, when a door is knocked on.
Solution
A Piezo sensor responds to vibration. It works best when connected to a larger surface that vibrates. Figure 6-8 shows the connections:
/* piezo sketch
 * lights an LED when the Piezo is tapped
 */

const int sensorPin = 0;  // the analog pin connected to the sensor
const int ledPin    = LED_BUILTIN;     // pin connected to LED
const int THRESHOLD = 100;

void setup()
{
   pinMode(ledPin, OUTPUT);
}

void loop()
{
  int val = analogRead(sensorPin);
  if (val >= THRESHOLD)
  {
    digitalWrite(ledPin, HIGH);
    delay(100);  // to make the LED visible
  }
  else
    digitalWrite(ledPin, LOW);
}
Discussion
A Piezo sensor, also known as a knock sensor, produces a voltage in response to physical stress. The more it is stressed, the higher the voltage. The Piezo is polarized and the positive side (usually a red wire or a wire marked with a “+”) is connected to the analog input; the negative wire (usually black or marked with a “–”) is connected to ground. A high-value resistor (1 megohm) is connected across the sensor. The resistor is included to protect the Arduino pins against excessive current or voltage.

Knock sensor connections
The voltage is detected by Arduino analogRead to turn on an LED (see Chapter 5 for more about the analogRead function). The THRESHOLD value determines the level from the sensor that will turn on the LED, and you can decrease or increase this value to make the sketch more or less sensitive.
Piezo sensors can be bought in plastic cases or as bare metal disks with two wires attached. The components are the same; use whichever fits your project best.
Some sensors, such as the Piezo, can be driven by the Arduino to produce the thing that they can sense. Chapter 9 has more about using a Piezo to generate sound.
6.8 Detecting Sound
Problem
You want to detect sounds such as clapping, talking, or shouting.
Solution
This recipe uses the BOB-12758 breakout board for the Electret Microphone (SparkFun). Connect the board as shown in Figure 6-9 and load the code to the board. If you are using a 3.3V board, you should connect the microphone’s VCC pin to 3.3V instead of 5V.

Microphone board connections
The built-in LED will turn on when you clap, shout, or play loud music near the microphone. You may need to adjust the threshold—use the Serial Monitor to view the high and low values, and change the threshold value so that it is between the high values you get when noise is present and the low values when there is little or no noise. Upload the changed code to the board and try again:
/* microphone sketch
 * SparkFun breakout board for Electret Microphone is connected to analog pin 0
 */

const int micPin = A0;            // Microphone connected to analog 0
const int ledPin = LED_BUILTIN;   // the code will flash the built-in LED
const int middleValue = 512;      // the middle of the range of analog values
const int numberOfSamples = 128;  // how many readings will be taken each time

int sample;                       // the value read from microphone each time
long signal;                      // the reading once you have removed DC offset
long newReading;                  // the average of that loop of readings

long runningAverage = 0;          // the running average of calculated values
const int averagedOver = 16;      // how quickly new values affect running average
                                  // bigger numbers mean slower

const int threshold = 400;        // at what level the light turns on

void setup()
{
  pinMode(ledPin, OUTPUT);
  Serial.begin(9600);
}

void loop()
{
  long sumOfSquares = 0;
  for (int i=0; i<numberOfSamples; i++) { // take many readings and average them
    sample = analogRead(micPin);          // take a reading
    signal = (sample - middleValue);      // work out its offset from the center
    signal *= signal;                     // square it to make all values positive
    sumOfSquares += signal;               // add to the total
  }

  newReading = sumOfSquares/numberOfSamples;

  // calculate running average
  runningAverage=(((averagedOver-1)*runningAverage)+newReading)/averagedOver;

  Serial.print("new:"); Serial.print(newReading);
  Serial.print(",");
  Serial.print("running:"); Serial.println(runningAverage);

  if (runningAverage > threshold){         // is average more than the threshold?
    digitalWrite(ledPin, HIGH);          // if it is turn on the LED
  } else {
    digitalWrite(ledPin, LOW);           // if it isn't turn the LED off
  }

}
Discussion
A microphone produces very small electrical signals. If you connected it straight to the pin of an Arduino, you would not get any detectable change. The signal needs to be amplified first to make it usable by Arduino. The SparkFun board has the microphone with an amplifier circuit built in to amplify the signal to a level readable by Arduino.
Because you are reading an audio signal in this recipe, you will need to do some additional calculations to get useful information. An audio signal is changing fairly quickly, and the value returned by analogRead will depend on what point in the undulating signal you take a reading. If you are unfamiliar with using analogRead, see Chapter 5 and Recipe 6.3. An example waveform for an audio tone is shown in Figure 6-10. As time changes from left to right, the voltage goes up and down in a regular pattern. If you take readings at the three different times marked on it, you will get three different values. If you used this to make decisions, you might incorrectly conclude that the signal got louder in the middle.
An accurate measurement requires multiple readings taken close together. The peaks and troughs increase as the signal gets bigger. The difference between the bottom of a trough and the top of a peak is called the amplitude of the signal, and this increases as the signal gets louder.

Audio signal measured in three places
To measure the size of the peaks and troughs, you measure the difference between the midpoint voltage and the levels of the peaks and troughs. You can visualize this midpoint value as a line running midway between the highest peak and the lowest trough, as shown in Figure 6-11. The line represents the DC offset of the signal (it’s the DC value when there are no peaks or troughs). If you subtract the DC offset value from your analogRead values, you get the correct reading for the signal amplitude.

Audio signal showing DC offset (signal midpoint)
As the signal gets louder, the average size of these values will increase, but as some of them are negative (where the signal has dropped below the DC offset), they will cancel each other out, and the average will tend to be zero. To fix that, we square each value (multiply it by itself). This will make all the values positive, and it will increase the difference between small changes, which helps you evaluate changes as well. The average value will now go up and down as the signal amplitude does.
To do the calculation, we need to know what value to use for the DC offset. To get a clean signal, the amplifier circuit for the microphone will have been designed to have a DC offset as close as possible to the middle of the possible range of voltage so that the signal can get as big as possible without distorting. The code assumes this and uses the value 512 (right in the middle of the analog input range of 0 to 1,023). Each time the sketch takes the average of the squared values to calculate a new reading, the sketch updates the running average. The running average is calculated by multiplying the current running average by averagedOver - 1. With averagedOver set to 16, this weights the current running average by 15. Next, the sketch adds the new reading in (a weighting of 1), and divides by averagedOver to get the weighted average, which yields the new running average: (currentAverage * 15 + newReading)/16
The sketch prints the values of the new reading and the running average in such a way that you can view them with the Serial Plotter (Tools→Serial Plotter). You can see the relationship between the new reading and the running average in Figure 6-12. The running average is less spikey, which means the LED will stay on long enough for someone to notice it, rather than just flickering briefly during a spike.

Readings and moving average displayed in the Serial Plotter
The values of variables at the top of the sketch can be varied if the sketch does not trigger well for the level of sound you want.
The numberOfSamples is set at 128—if it is set too small, the average may not adequately cover complete cycles of the waveform and you will get erratic readings. If the value is set too high, you will be averaging over too long a time, and a very short sound might be missed as it does not produce enough change once a large number of readings are averaged. It could also start to introduce a noticeable delay between a sound and the light going on. Constants used in calculations, such as numberOfSamples and averagedOver, are set to powers of 2 (128 and 16, respectively). Try to use values evenly divisible by two for these to give you the fastest performance (see Chapter 3 for more on math functions).
While the values as calculated work well for detecting sound levels, you can change the sketch so it lines up with standard methods for measuring sound levels (decibels). First, you’ll need to change the way newReading is calculated to take the square root of the average (this is called a Root Mean Square, or RMS). Next, you’ll want to take the common logarithm of both values and multiply it by 20 to get decibels. This is unlikely to yield an accurate measurement without calibration, but it is a starting point:
  newReading = sqrt(sumOfSquares/numberOfSamples);

  // calculate running average
  runningAverage=(((averagedOver-1)*runningAverage)+newReading)/averagedOver;

  Serial.print("new:"); Serial.print(20*log10(newReading));
  Serial.print(",");
  Serial.print("running:"); Serial.println(20*log10(runningAverage));
You will also need to modify the threshold to something much lower:
const int threshold = 30; // at what level the light turns on
6.9 Measuring Temperature
Problem
You want to display the temperature or use the value to control a device; for example, to switch something on when the temperature reaches a threshold.
Solution
This recipe displays the temperature in Fahrenheit and Celsius (Centigrade) using the popular TMP36 heat detection sensor. The sensor looks similar to a transistor and is connected as shown in Figure 6-13.
Note
If you are using a 3.3V board, you must connect the TMP36 power pin to 3.3V instead of 5V, and change float millivolts = (value / 1024.0) * 5000; to float millivolts = (value / 1024.0) * 3300; in the sketch.

Connecting the TMP36 temperature sensor
/*
 * tmp36 sketch
 * prints the temperature to the Serial Monitor
 * and turns on the LED when a threshold is reached
 */

const int inPin  = A0; // analog pin
const int ledPin = LED_BUILTIN;
const int threshold = 80; // Turn on the LED over 80F

void setup()
{
  Serial.begin(9600);
}

void loop()
{
  int value = analogRead(inPin);

  float millivolts = (value / 1024.0) * 5000; // Use 3300 instead of 5000 for 3.3V boards
  float celsius = (millivolts - 500) / 10;    // 10mV per degree Celsius with a 500mv offset
  float fahrenheit = (celsius * 9)/ 5 + 32;

  Serial.print("C:");
  Serial.print(celsius);
  Serial.print(",");
  Serial.print("F:");
  Serial.println( fahrenheit );  //  converts to fahrenheit

  if (fahrenheit > threshold){    // is the temperature over the threshold?
    digitalWrite(ledPin, HIGH);  // if it is turn on the LED
  } else {
    digitalWrite(ledPin, LOW);   // if it isn't turn the LED off
  }
  delay(1000); // wait for one second

}
Discussion
The TMP36 temperature sensor produces an analog voltage directly proportional to temperature with an output of 1 millivolt (mV) per 0.1°C (10mV per degree), but with a 500 mV offset.
The sketch converts the analogRead values into millivolts (see Chapter 5). It then subtracts 0.5V (500 mV), the offset voltage specified in the TMP36 datasheet, and then divides the result by 10 to get degrees C. If the temperature exceeds the threshold value, the sketch lights the onboard LED. You can easily get the sensor to go over 80F by holding the sensor between two fingers, but avoid touching your fingers to the sensor’s leads so as to not interfere with the electrical signaling.
There are many temperature sensors available, but an interesting alternative is the waterproof DS18B20 digital temperature sensor (Adafruit part 381, SparkFun part SEN-11050, available from other suppliers as well). It is wired and used differently than the TMP36.
The DS18B20 is based on the 1-Wire protocol pioneered by Dallas Semiconductor (now Maxim), and requires two libraries. The first is the OneWire library. There are several libraries available with OneWire in their name, so be sure to choose the OneWire library by Jim Studt, Tom Pollard, et al. You will also need the DallasTemperature library. You can install both using the library manager (see Recipe 16.2). To wire the DS18B20, connect the red wire to 5V (or 3.3V if on a 3.3V board), black to ground, and the signal wire (yellow, white, or some other color) to digital pin 2 with a 4.7K resistor between the signal and power (5V or 3.3V) pin, as shown in Figure 6-14.

Connecting the DS18B20 temperature sensor
/* DS18B20 temperature
 * Reads temperature from waterproof sensor probe
 */
#include <OneWire.h>
#include <DallasTemperature.h>

#define ONE_WIRE_BUS 2  // The pin that the sensor wire is connected to

const int ledPin = LED_BUILTIN;
const int threshold = 80; // Turn on the LED over 80F

OneWire oneWire(ONE_WIRE_BUS);       // Prepare the OneWire connection
DallasTemperature sensors(&oneWire); // Declare the temp sensor object

void setup(void)
{
  Serial.begin(9600);

  // Initialize the sensor
  sensors.begin();
}

void loop(void)
{

  sensors.requestTemperatures(); // Request a temperature reading

  // Retrieve the temperature reading in F and C
  float fahrenheit = sensors.getTempFByIndex(0);
  float celsius    = sensors.getTempCByIndex(0);

  // Display the temperature readings in a Serial Plotter-friendly format
  Serial.print("C:"); Serial.print(celsius);
  Serial.print(",");
  Serial.print("F:"); Serial.println(fahrenheit);

  if (fahrenheit > threshold){    // is the temperature over the threshold?
    digitalWrite(ledPin, HIGH);  // if it is turn on the LED
  } else {
    digitalWrite(ledPin, LOW);   // if it isn't turn the LED off
  }
  delay(1000);

}
The sketch pulls in the header files for each library, and initializes the data structures needed to work with the 1-Wire protocol and with the sensor. Inside the loop, the sketch requests a temperature reading, and then reads the temperature in Celsius, then Fahrenheit. Note that you do not need to perform any arithmetic conversion on the results you get from the sensor. Everything is handled by the library. Note also that you do not need to make any code changes (but make sure you wire the sensor’s power to 3.3V, not 5V) when you use a 3.3V board.
See Also
TMP36 datasheet: https://www.analog.com/media/en/technical-documentation/data-sheets/TMP35_36_37.pdf
DS18B20 datasheet: https://datasheets.maximintegrated.com/en/ds/DS18B20.pdf
6.10 Reading RFID (NFC) Tags
Problem
You want to read an RFID/NFC tag and respond to specific IDs.
Solution
Figure 6-15 shows an PN532 NFC reader connected to Arduino over serial pins (TX and RX). PN532 NFC readers are available from a number of suppliers. The Seeed Studio Grove NFC reader (part 113020006) is connected as shown in the diagram. You can also find a PN532 reader in a shield form factor (SeeedStudio part 113030001, Adafruit part 789). You will need to install the SeeedStudio Seeed_Arduino_NFC library from https://github.com/Seeed-Studio/Seeed_Arduino_NFC (see Recipe 16.2). The Seeed library includes a modified version of the NDEF library from https://github.com/don/NDEF so you do not need to install that library.
Note
PN532 readers work with 13.56 MHz MiFare Classic and Mifare Ultralight tags. If you are using a different reader, check the documentation for information on wiring the reader to Arduino and for example code.

NFC reader connected to Arduino
The sketch reads an NFC tag and displays its unique ID:
/* NFC Tag Scanner - Serial
 * Look for an NFC tag and display its unique identifier.
 */

#include <NfcAdapter.h>
#include <PN532/PN532/PN532.h>
#include <PN532/PN532_HSU/PN532_HSU.h>

PN532_HSU pn532hsu(Serial1);
NfcAdapter nfc(pn532hsu);

void setup()
{
  Serial.begin(9600);
  nfc.begin(); // Initialize the NFC reader
}

void loop()
{
  Serial.println("Waiting for a tag");
  if (nfc.tagPresent()) // If the reader sees an NFC tag
  {
    NfcTag tag = nfc.read(); // read the NFC tag
    Serial.println(tag.getUidString()); // Display its id
  }
  delay(500);
}
Discussion
NFC (Near-Field Communication) is a specialized variant of RFID (Radio Frequency Identification) technology that operates at a frequency of 13.56 MHz and supports a data format called NDEF (NFC Data Exchange Format). NDEF provides a variety of structured messages you can store on a tag, a small electronic device that can be embedded in cards, stickers, keychain fobs, and other objects. The tag consists of a relatively large antenna that receives signals from an RFID/NFC reader. The reader can be embedded in a computer or a mobile phone, or can be a module that you connect to your Arduino (as with the PN532 module). When the tag receives the signal, it harvests enough energy from it to energize the circuitry on the tag, which responds to the signal by transmitting the information contained in its memory. There are also tags that have their own power, such as a motor vehicle transponder used in automated toll payment systems. Such tags are known as active tags, while the energy-harvesting type is called a passive tag.
An NDEF tag transmits a collection of data when it is activated by a reader. This data includes information that identifies the tag, along with any information stored on the tag. The Solution uses Don Coleman’s NDEF library to simplify reading the tag data.
The code shown in the Solution will work with the SeeedStudio Grove NFC module connected over Serial1. It uses the USB serial connection to send information that you can view in the Serial Monitor. Serial1 is not present on the Arduino Uno (see “Serial Hardware”), which means you would need to use SoftwareSerial with this module because on the Uno (and compatible boards based on the ATmega328), USB Serial and the TX/RX pins are shared, so these boards cannot talk to a serial device and over the USB Serial connection at the same time. See Recipe 4.11 for information on SoftwareSerial. You can also reconfigure the Grove NFC module to use I2C (see http://wiki.seeedstudio.com/Grove_NFC/).
The SeeedStudio NFC shield communicates over SPI. If you want to use it with the SeeedStudio NFC shield, change the lines at the top of the sketch to:
#include <SPI.h>
#include <NfcAdapter.h>
#include <PN532/PN532/PN532.h>
#include <PN532/PN532_SPI/PN532_SPI.h>

PN532_SPI pn532spi(SPI, 10);
NfcAdapter nfc = NfcAdapter(pn532spi);
If you want to use it with the Adafruit shield or the Grove NFC module in I2C mode, change the lines at the top of the sketch to:
#include <Wire.h>
#include <NfcAdapter.h>
#include <PN532/PN532/PN532.h>
#include <PN532/PN532_I2C/PN532_I2C.h>

PN532_I2C pn532i2c(Wire);
NfcAdapter nfc = NfcAdapter(pn532i2c);
You can also read any message on that tag and write your own message (assuming the tag has not been locked) using the NDEF library. If you replace the loop function with the following, the sketch will read the tag, and then use the NfcTag object’s print function to display the tag id and any message on it. It will then display a countdown. If you leave the tag in place, it will write a URL to the tag. If you have an NFC-enabled mobile phone, you can hold the tag up to the phone and it should open the URL in a web browser.
void loop()
{
  Serial.println("Waiting for a tag");
  if (nfc.tagPresent()) // If the reader sees an NFC tag
  {
    NfcTag tag = nfc.read(); // read the NFC tag
    tag.print(); // print whatever is currently on it

    // Give the user time to avoid writing to the tag
    Serial.print("Countdown to writing the tag: 3");
    for (int i = 2; i >= 0; i--) {
      delay(1000);
      Serial.print("..."); Serial.print(i);
    }
    Serial.println();

    // Write a message to the tag
    NdefMessage message = NdefMessage();
    message.addUriRecord("http://oreilly.com");
    bool success = nfc.write(message);
    if (!success)
      Serial.println("Write failed.");
    else
      Serial.println("Success.");
  }
  delay(500);
}
6.11 Tracking Rotary Movement
Problem
You want to measure and display the rotation of something to track its speed and/or direction.
Solution
To sense rotary motion you can use a rotary encoder that is attached to the object you want to track. Connect the encoder as shown in Figure 6-16:
/*
 * Read a rotary encoder
 * This simple version polls the encoder pins
 * The position is displayed on the Serial Monitor
 */

const int encoderPinA = 3;
const int encoderPinB = 2;
const int encoderStepsPerRevolution=16;
int angle = 0;

int encoderPos = 0;
bool encoderALast = LOW;  // remembers the previous pin state

void setup()
{
  Serial.begin (9600);
  pinMode(encoderPinA, INPUT_PULLUP);
  pinMode(encoderPinB, INPUT_PULLUP);
}

void loop()
{
  bool encoderA = digitalRead(encoderPinA);

  if ((encoderALast == HIGH) && (encoderA == LOW))
  {
    if (digitalRead(encoderPinB) == LOW)
    {
      encoderPos--;
    }
    else
    {
      encoderPos++;
    }
    angle=(encoderPos % encoderStepsPerRevolution)*360/encoderStepsPerRevolution;
    Serial.print (encoderPos);
    Serial.print (" ");
    Serial.println (angle);
  }

  encoderALast = encoderA;
}

Rotary encoder
Discussion
A rotary encoder produces two signals as it is turned. Both signals alternate between HIGH and LOW as the shaft is turned, but the signals are slightly out of phase with each other. If you detect the point where one of the signals changes from HIGH to LOW, the state of the other pin (whether it is HIGH or LOW) will tell you which way the shaft is rotating.
So, the first line of code in the loop function reads one of the encoder pins:
int encoderA = digitalRead(encoderPinA);
Then it checks this value and the previous one to see if the value has just changed to LOW:
if ((encoderALast == HIGH) && (encoderA == LOW))
If it has not, the code doesn’t execute the following block; it goes to the bottom of loop, saves the value it has just read in encoderALast, and goes back around to take a fresh reading.
When the following expression is true:
if ((encoderALast == HIGH) && (encoderA == LOW))
the code reads the other encoder pin and increments or decrements encoderPos depending on the value returned. It calculates the angle of the shaft (taking 0 to be the point the shaft was at when the code started running). It then sends the values down the serial port so that you can see it in the Serial Monitor.
Encoders come in different resolutions, quoted as steps per revolution. This indicates how many times the signals alternate between HIGH and LOW for one revolution of the shaft. Values can vary from 16 to 1,000. The higher values can detect smaller movements, and these encoders cost much more money. The value for the encoder is hardcoded in the code in the following line:
const int encoderStepsPerRevolution=16;
If your encoder is different, you need to change that to get the correct angle values.
If you get values out that don’t go up and down, but increase regardless of the direction you turn the encoder, try changing the test to look for a rising edge rather than a falling one. Swap the LOW and HIGH values in the line that checks the values so that it looks like this:
if ((encoderALast == LOW) && (encoderA == HIGH))
Rotary encoders just produce an increment/decrement signal; they cannot directly tell you the shaft angle. The code calculates this, but it will be relative to the start position each time the code runs. The code monitors the pins by polling (continuously checking the value of) them. There is no guarantee that the pins have not changed a few times since the last time the code looked, so if the code does lots of other things as well, and the encoder is turned very quickly, it is possible that some of the steps will be missed. For high-resolution encoders this is more likely, as they will send signals much more often as they are turned.
To work out the speed, you need to count how many steps are registered in one direction in a set time.
6.12 Tracking Rotary Movement in a Busy Sketch with Interrupts
Problem
As you extend your code and it is doing other things in addition to reading the encoder, or if you want to read more than one encoder, you will find that your readings from the encoder start to get unreliable. This problem is particularly bad if the shaft rotates quickly.
Solution
The circuit is the same as the one for Recipe 6.11. We will use a library that is optimized for reading rotary encoders. It uses Arduino’s interrupt capabilities (Recipe 18.2) to respond quickly to changes in the pin states. Use the Library Manager to install the Encoder library by Paul Stoffregen (see Recipe 16.2), and run the following sketch:
/* Rotary Encoder library sketch
 * Read the rotary encoder with a library that uses interrupts
 * to process the encoder's activity
 */

#include <Encoder.h>

Encoder myEnc(2, 3); // On MKR boards, use pins 6, 7

void setup()
{
  Serial.begin(9600);
}

long lastPosition = -999;

void loop()
{
  long currentPosition = myEnc.read();
  if (currentPosition != lastPosition) { // If the position changed
    lastPosition = currentPosition;  // Save the last position
    Serial.println(currentPosition); // print it to the Serial monitor
  }
}
Discussion
With the Solution from Recipe 6.11, as your code has more things to do, the encoder pins will be checked less often. If the pins go through a whole step change before getting read, the Arduino will simply not detect that step. Moving the shaft quickly will cause more errors, as the steps will be happening more quickly.
To make sure the code responds every time a step happens, you need to use interrupts. When the interrupt condition happens (such as a pin changing state), the code jumps from wherever it is, handles the interrupt, and then returns to where it was and carries on. The Encoder library will perform best with pins that support hardware interrupts, but it will do its best with pins that do not.
On the Arduino Uno and other boards based on the ATmega328, only two pins can be used as interrupts: pins 2 and 3. See https://www.arduino.cc/reference/en/language/functions/external-interrupts/attachinterrupt/ for a list of which pins are supported on specific boards. You declare and initialize a rotary encoder with the following line of code:
Encoder myEnc(2, 3);
The parameters to the Encoder initialization are the two pins the encoder is attached to. If you find that the encoder value is decreasing when you expect it to increase, you can swap the arguments or swap your wiring. Once you’ve initialized an encoder, whenever you spin the encoder it will interrupt the sketch briefly to keep track of the movement. You can read the value at any time with myEnc.read().
You can create as many encoders as you have pins, but whenever possible, use pins that support interrupts. The following sketch will handle two encoders, and will work optimally on a board that can handle interrupts on the selected pins such as the SAMD21-based M0 boards (Adafruit Metro M0, SparkFun RedBoard Turbo, and Arduino Zero). If you are using a different board, you may need to use different pins. The Uno and other ATmega328-based boards only support interrupts on pins 2 and 3, so the quality of readings will be diminished on the second encoder no matter which pins you choose with one of those boards:
#include <Encoder.h>

Encoder myEncA(2, 3); // MKR boards use pins 4, 5
Encoder myEncB(6, 7); // Mega boards use pins 18, 19

void setup()
{
  Serial.begin(9600);
  while(!Serial);
}

long lastA  = -999;
long lastB  = -999;

void loop()
{
  long currentA = myEncA.read();
  long currentB = myEncB.read();
  if (currentA != lastA || currentB != lastB) { // If either position changed
    lastA = currentA; // Save both positions
    lastB = currentB;

    // Print the positions to the Serial Monitor (or Serial Plotter)
    Serial.print("A:"); Serial.print(currentA);
    Serial.print(" ");
    Serial.print("B:"); Serial.println(currentB);
  }
}
See Also
The Arduino MKR Vidor 4000 includes an FPGA that is capable of reading a rotary encoder with much more accuracy than with an Arduino alone. See https://www.arduino.cc/en/Tutorial/VidorEncoder.
6.13 Using a Mouse
Problem
You want to detect movements of a PS/2-compatible mouse and respond to changes in the x and y coordinates.
Solution
This solution uses LEDs to indicate mouse movement. The brightness of the LEDs changes in response to mouse movement in the x (left and right) and y (nearer and farther) directions. Clicking the mouse buttons sets the current position as the reference point (Figure 6-17 shows the connections).
To use this sketch, you will need to install the PS/2 library from http://www.arduino.cc/playground/ComponentLib/Ps2mouse. As of this writing, you will need to use a text editor to open the ps2.h file in the ps2 directory and change #include "WProgram.h" to #include "Arduino.h".
/*
   Mouse
   an arduino sketch using ps2 mouse library
   from http://www.arduino.cc/playground/ComponentLib/Ps2mouse
 */

#include <ps2.h>

const int dataPin =  5;
const int clockPin = 6;

const int xLedPin  = 9; // Use pin 8 on the MKR boards
const int yLedPin  = 10;

const int mouseRange = 255;  // the maximum range of x/y values

char x;                 // values read from the mouse
char y;
byte status;

int xPosition = 0;      // values incremented and decremented when mouse moves
int yPosition = 0;
int xBrightness = 128;  // values increased and decreased based on mouse position
int yBrightness = 128;

const byte REQUEST_DATA = 0xeb; // command to get data from the mouse

PS2 mouse(clockPin, dataPin); // Declare the mouse object

void setup()
{
  mouseBegin(); // Initialize the mouse
}

void loop()
{
  // get a reading from the mouse
  mouse.write(REQUEST_DATA); // ask the mouse for data
  mouse.read();      // ignore ack

  status = mouse.read(); // read the mouse buttons
  if(status & 1) // this bit is set if the left mouse btn pressed
    xPosition = 0; // center the mouse x position
  if(status & 2) // this bit is set if the right mouse btn pressed
    yPosition = 0; // center the mouse y position

  x = mouse.read();
  y = mouse.read();
  if( x != 0 || y != 0)
  {
    // here if there is mouse movement

    xPosition = xPosition + x; // accumulate the position
    xPosition = constrain(xPosition,-mouseRange,mouseRange);

    xBrightness = map(xPosition, -mouseRange, mouseRange, 0,255);
    analogWrite(xLedPin, xBrightness);

    yPosition = constrain(yPosition + y, -mouseRange,mouseRange);
    yBrightness = map(yPosition, -mouseRange, mouseRange, 0,255);
    analogWrite(yLedPin, yBrightness);
  }
}

void mouseBegin()
{
  // reset and initialize the mouse
  mouse.write(0xff);         // reset
  delayMicroseconds(100);
  mouse.read();              // ack byte
  mouse.read();              // blank
  mouse.read();              // blank
  mouse.write(0xf0);         // remote mode
  mouse.read();              // ack
  delayMicroseconds(100);
}

Connecting a mouse to indicate position and light LEDs
Warning
If you are using a 3.3V board, you will either need to add a voltage divider to both the clock and data pins, or you may try powering the mouse from 3.3V instead of 5V (which may or may not work, depending on your mouse). See Recipe 5.11 for a discussion of voltage dividers.
Figure 6-17 shows a female PS/2 connector (the socket you plug the mouse into) from the front. If you don’t have a female connector and don’t mind chopping the end off your mouse, you can note which wires connect to each of these pins and solder to pin headers that plug directly into the correct Arduino pins. A continuity test from a pin to a wire will let you quickly determine which wires go to which pins, but if you are testing the pins from the male plug end that you cut off of your mouse, you need to reverse the diagram left to right.
Discussion
Connect the mouse signal (clock and data) and power leads to Arduino, as shown in Figure 6-17. This solution only works with PS/2-compatible devices, so you will need to find an older mouse—most mice with the round PS/2 connector should work.
The mouseBegin function initializes the mouse to respond to requests for movement and button status. The PS/2 library handles the low-level communication. The mouse.write command is used to instruct the mouse that data will be requested. The first call to mouse.read gets an acknowledgment (which is ignored in this example). The next call to mouse.read gets the button status, and the last two mouse.read calls get the x and y movement that has taken place since the previous request.
The sketch tests to see which bits are HIGH in the status value to determine if the left or right mouse button was pressed. The two rightmost bits will be HIGH when the left and right buttons are pressed, and these are checked in the following lines:
  status = mouse.read(); // read the mouse buttons
  if(status & 1) // rightmost bit is set if the left mouse btn pressed
    xPosition = 0; // center the mouse x position
  if(status & 2) // this bit is set if the right mouse btn pressed
    yPosition = 0; // center the mouse y position
The x and y values read from the mouse represent the movement since the previous request, and these values are accumulated in the variables xPosition and yPosition.
The values of x and y will be positive if the mouse moves right or away from you, and negative if it moves left or toward you.
The sketch ensures that the accumulated value does not exceed the defined range (mouseRange) using the constrain function:
   xPosition = xPosition + x; // accumulate the position
   xPosition = constrain(xPosition,-mouseRange,mouseRange);
The yPosition calculation shows a shorthand way to do the same thing; here the calculation for the y value is done within the call to constrain:
yPosition = constrain(yPosition + y,-mouseRange,mouseRange);
The xPosition and yPosition variables are reset to zero if the left and right mouse buttons are pressed.
LEDs are illuminated to correspond to position using analogWrite—half brightness in the center, and increasing and decreasing in brightness as the mouse position increases and decreases. You must use a PWM-capable pin in order for this to work correctly. If your board does not support PWM on pins 9 and 10 (most do), you will see the lights turn on and off instead of dimming. On the MKR family of boards, pin 9 does not support PWM so you need to change the wiring and the code to use a pin that does.
The position can be graphed on the Serial Plotter by adding the following line just after the second call to analogWrite():
printValues(); // show button and x and y values on Serial Monitor/Plotter
You’ll also need to add this line to setup():
Serial.begin(9600);
Add the following function to the end of the sketch to print or plot the current position of the mouse:
void printValues()
{
  Serial.print("X:");
  Serial.print(xPosition);
  Serial.print(",Y:");
  Serial.print(yPosition);
  Serial.println();
}
See Also
For a suitable PS/2 connector with built-in wires, see https://www.adafruit.com/product/804.
6.14 Getting Location from a GPS
Problem
You want to determine location using a GPS module.
Solution
A number of Arduino-compatible GPS units are available today. Most use a familiar serial interface to communicate with their host microcontroller using a protocol known as NMEA 0183. This industry standard provides for GPS data to be delivered to listener devices such as Arduino as human-readable ASCII sentences. For example, the following NMEA sentence:
$GPGLL,4916.45,N,12311.12,W,225444,A,*1D
describes, among other things, a location on the globe at 49 16.45’ north latitude by 123 11.12’ west longitude.
To establish location, your Arduino sketch must parse these strings and convert the relevant text to numeric form. Writing code to manually extract data from NMEA sentences can be tricky and cumbersome in the Arduino’s limited address space, but fortunately there is a useful library that does this work for you: Mikal Hart’s TinyGPS++. Download it from https://github.com/mikalhart/TinyGPSPlus/releases and install it. (For instructions on installing third-party libraries, see Recipe 16.2.)
The general strategy for using a GPS is as follows:
-
Physically connect the GPS device to the Arduino.
-
Read serial NMEA data from the GPS device.
-
Process the data to determine location.
Using TinyGPSPlus, you do the following:
-
Physically connect the GPS device to the Arduino.
-
Create a TinyGPSPlus object.
-
Read serial NMEA data from the GPS device.
-
Process each byte with TinyGPSPlus’s
encode()method. -
Periodically query TinyGPSPlus’s
get_position()method to determine location.
The following sketch illustrates how you can acquire data from a GPS attached to Arduino’s serial port. Every 5 seconds, it blinks the built-in LED once if the device is in the Southern Hemisphere and twice if it is in the Northern hemisphere. If your Arduino’s TX and RX pins are associated with another serial device such as Serial1, change the definition of GPS_SERIAL (see Table 4-1.
/* GPS sketch
 * Indicate which hemisphere your GPS is in with the built-in LED.
 */

#include "TinyGPS++.h"

// Change this to the serial port your GPS uses (Serial, Serial1, etc.)
#define GPS_SERIAL Serial

TinyGPSPlus gps; // create a TinyGPS++ object

#define HEMISPHERE_PIN LED_BUILTIN

void setup()
{
  GPS_SERIAL.begin(9600); // GPS devices frequently operate at 9600 baud
  pinMode(HEMISPHERE_PIN, OUTPUT);
  digitalWrite(HEMISPHERE_PIN, LOW); // turn off LED to start
}

void loop()
{
  while (GPS_SERIAL.available())
  {
    // encode() each byte; if encode() returns "true",
    // check for new position.
    if (gps.encode(GPS_SERIAL.read()))
    {
      if (gps.location.isValid())
      {
        if (gps.location.lat() < 0) // Southern Hemisphere?
          blink(HEMISPHERE_PIN, 1);
        else
          blink(HEMISPHERE_PIN, 2);
      } else // panic
        blink(HEMISPHERE_PIN, 5);
      delay(5000); // Wait 5 seconds
    }
  }
}

void blink(int pin, int count)
{
  for (int i = 0; i < count; i++)
  {
    digitalWrite(pin, HIGH);
    delay(250);
    digitalWrite(pin, LOW);
    delay(250);
  }
}
Start serial communications using the rate required by your GPS. See Chapter 4 if you need more information on using Arduino serial communications.
A 9,600 baud connection is established with the GPS. Once bytes begin flowing, they are processed by encode(), which parses the NMEA data. A true return from encode() indicates that TinyGPSPlus has successfully parsed a complete sentence and that fresh position data may be available. This is a good time to check the whether the position is valid with a call to gps.location.isValid().
TinyGPSPlus’s gps.location.lat() returns the most recently observed latitude, which this sketch examines; if it is less than zero, that is, south of the equator, the LED blinks once. If it is greater than zero (at or north of the equator), it blinks twice. If the GPS is unable to get a valid fix, it blinks five times.
Discussion
Attaching a GPS unit to an Arduino is usually as simple as connecting two or three data lines from the GPS to input pins on the Arduino as shown in Table 6-2. If you are using a 5V board such as the Uno, you can use either a 3.3V or 5V GPS module. If you are using a board that is not 5V-tolerant, such as a SAMD-based board like the Arduino Zero, Adafruit Metro M0/M4, or SparkFun Redboard Turbo), you must use a 3.3V GPS module.
| GPS line | Arduino pin |
|---|---|
|
GND |
GND |
|
5V or 3.3V |
5V or 3.3V |
|
RX |
TX (pin 1) |
|
TX |
RX (pin 0) |
Warning
Some GPS modules use RS-232 voltage levels, which are incompatible with Arduino’s TTL logic and will permanently damage the board. If your GPS uses RS-232 levels then you need some kind of intermediate logic conversion device like the MAX232 integrated circuit.
The code in the Solution assumes that the GPS is connected directly to Arduino’s built-in serial pins. On an ATmega328-based board like the Arduino Uno, this is not usually the most convenient design because RX and TX (pins 0 and 1) are shared with the USB serial connection. In many projects, you’ll use the hardware serial port to communicate with a host PC or other peripheral which means that port cannot be used by the GPS. In cases like this, select another pair of digital pins and use a serial port emulation (“soft serial”) library to talk to the GPS instead.
With the Arduino and GPS powered down, move the GPS’s TX line to Arduino pin 2 and RX line to pin 3 to free up the hardware serial port for debugging (see Figure 4-8). With the USB cable connected to the host PC, try the following sketch to get a detailed glimpse of TinyGPS in action through the Arduino’s Serial Monitor:
/* GPS sketch with logging
 */

#include "TinyGPS++.h"

// Delete the next four lines if your board has a separate hardware serial port
#include "SoftwareSerial.h"
#define GPS_RX_PIN 2
#define GPS_TX_PIN 3
SoftwareSerial softserial(GPS_RX_PIN, GPS_TX_PIN); // create soft serial object

// If your board has a separate hardware serial port, change "softserial" to that port
#define GPS_SERIAL softserial

TinyGPSPlus gps; // create a TinyGPSPlus object

void setup()
{
  Serial.begin(9600); // for debugging
  GPS_SERIAL.begin(9600); // Use Soft Serial object to talk to GPS
}
void loop()
{
  while (GPS_SERIAL.available())
  {
    int c = GPS_SERIAL.read();
    Serial.write(c); // display NMEA data for debug

    // Send each byte to encode()
    // Check for new position if encode() returns "True"
    if (gps.encode(c))
    {
      Serial.println();
      float lat = gps.location.lat();
      float lng = gps.location.lng();
      unsigned long fix_age = gps.date.age();

      if (!gps.location.isValid())
        Serial.println("Invalid fix");
      else if (fix_age > 2000)
        Serial.println("Stale fix");
      else
        Serial.println("Valid fix");

      Serial.print("Lat: ");
      Serial.print(lat);
      Serial.print(" Lon: ");
      Serial.println(lng);
    }
  }
}
For a more detailed discussion on software serial, see Recipes 4.11 and 4.12.
Note that you can use a different baud rate for connection to the Serial Monitor and the GPS.
This new sketch behaves the same as the earlier example (but for brevity, omits the LED blinking code) but is much easier to debug. At any time, you can connect a serial LCD (see Recipe 4.11) to the built-in serial port to watch the NMEA sentences and TinyGPSPlus data scrolling by. You could also connect to the serial port using Arduino’s Serial Monitor.
When power is turned on, a GPS unit begins transmitting NMEA sentences. However, the sentences containing valid location data are only transmitted after the GPS establishes a fix, which requires the GPS antenna to have visibility of the sky and can take up to two minutes or more. Stormy weather or the presence of buildings or other obstacles may also interfere with the GPS’s ability to pinpoint location. So, how does the sketch know whether TinyGPSPlus is delivering valid position data? The answer lies in the return value from the gps.location.isValid() function. A false value means TinyGPS has not yet parsed any valid sentences containing position data. In this case, you’ll know that the returned latitude and longitude are invalid as well.
You can also check how old the fix is. The gps.date.age() function returns the number of milliseconds since the last fix. The sketch stores its value in fix_age. Under normal operation, you can expect to see quite low values for fix_age. Modern GPS devices are capable of reporting position data as frequently as one to five times per second or more, so a fix_age in excess of 2,000 ms or so suggests that there may be a problem. Perhaps the GPS is traveling through a tunnel or a wiring flaw is corrupting the NMEA data stream, invalidating the checksum (a calculation to check that the data is not corrupted). In any case, a large fix_age indicates that the coordinates returned by get_position() are stale.
See Also
For a deeper understanding of the NMEA protocol, read the Wikipedia article at http://en.wikipedia.org/wiki/NMEA.
Several shops sell GPS modules that interface well with TinyGPS and Arduino. These differ mostly in power consumption, voltage, accuracy, physical interface, and whether they support serial NMEA. Adafruit sells a variety of modules (see https://www.adafruit.com/category/58) as does SparkFun (https://www.sparkfun.com/categories/4).
GPS technology has inspired lots of creative Arduino projects. A very popular example is the GPS data logger, in which a moving device records location data at regular intervals to the Arduino EEPROM or other on-board storage. See the breadcrumbs project at http://code.google.com/p/breadcrumbs/wiki/UserDocument for an example. Adafruit makes a popular GPS data logging shield; see https://www.adafruit.com/product/1272.
Other interesting GPS projects include hobby airplanes and helicopters that maneuver themselves to preprogrammed destinations under Arduino software control. Mikal Hart built a GPS-enabled “treasure chest” with an internal latch that cannot be opened until the box is physically moved to a certain location. See http://arduiniana.org.
6.15 Detecting Rotation Using a Gyroscope
Problem
You want to respond to the rate of rotation. This can be used to keep a vehicle or robot moving in a straight line or turning at a desired rate.
Solution
Gyroscopes provide an output related to rotation rate (as opposed to an accelerometer, which indicates rate of change of velocity). In the early days Of Arduino, most low-cost gyroscopes used an analog voltage proportional to rotation rate. Now, with the ubiquitous use of gyroscopes and accelerometers in smart phones, it is cheaper and easier to find gyroscopes and accelerometers combined using I2C protocol. See Chapter 13 for more on using I2C.
Note
The Arduino Nano 33 BLE Sense board has a gyroscope and accelerometer built onto the board. See Recipe 6.1 for more information.
The MPU-9250 inertial measurement unit is a relatively inexpensive 9 degrees of freedom (9DOF) sensor that works well with Arduino. It is available on a breakout board from many suppliers, including SparkFun (part number SEN-13762). Bolder Flight Systems makes a version that also includes the BME-280 environmental sensor and is specifically designed to connect to Teensy boards (https://bolderflight.com/products/teensy/motion/). There are several libraries available that support the MPU-9250. The following sketch uses the Bolder Flight Systems MPU9250 library that you can install using the Arduino Library Manager. (For instructions on installing third-party libraries, see Recipe 16.2.) Connect the sensor as shown in Figure 6-18.
/* Gyro sketch
 * Read a gyro and display rotation in degrees/sec
 */

#include "MPU9250.h"

//  I2C address of IMU. If this doesn't work, try 0x69.
#define IMU_ADDRESS 0x68

MPU9250 IMU(Wire, IMU_ADDRESS); // Declare the IMU object

void setup() {

  Serial.begin(9600);
  while(!Serial);

  // Initialize the IMU
  int status = IMU.begin();
  if (status < 0) {
    Serial.println("Could not initialize the IMU.");
    Serial.print("Error value: "); Serial.println(status);
    while(1); // halt the sketch
  }

  // Set the full range of the gyro to +/- 500 degrees/sec
  status = IMU.setGyroRange(MPU9250::GYRO_RANGE_500DPS);
  if (status < 0) {
    Serial.println("Could not change gyro range.");
    Serial.print("Error value: "); Serial.println(status);
  }
}

void loop() {

  IMU.readSensor();

  // Obtain the rotational velocity in rads/second
  float gx = IMU.getGyroX_rads();
  float gy = IMU.getGyroY_rads();
  float gz = IMU.getGyroZ_rads();

  // Display velocity in degrees/sec
  Serial.print("gx:");
  Serial.print(gx * RAD_TO_DEG, 4);
  Serial.print(",gy:");
  Serial.print(gy * RAD_TO_DEG, 4);
  Serial.print(",gz:");
  Serial.print(gz * RAD_TO_DEG, 4);
  Serial.println();
  delay(100);
}
Warning
The MPU-9250 is a 3.3V I2C device, so if you are not using a 3.3V Arduino board you will need a logic-level converter to protect the gyro’s SCL and SDA pins. See the introduction to Chapter 13 for more on I2C and using 3.3V devices.
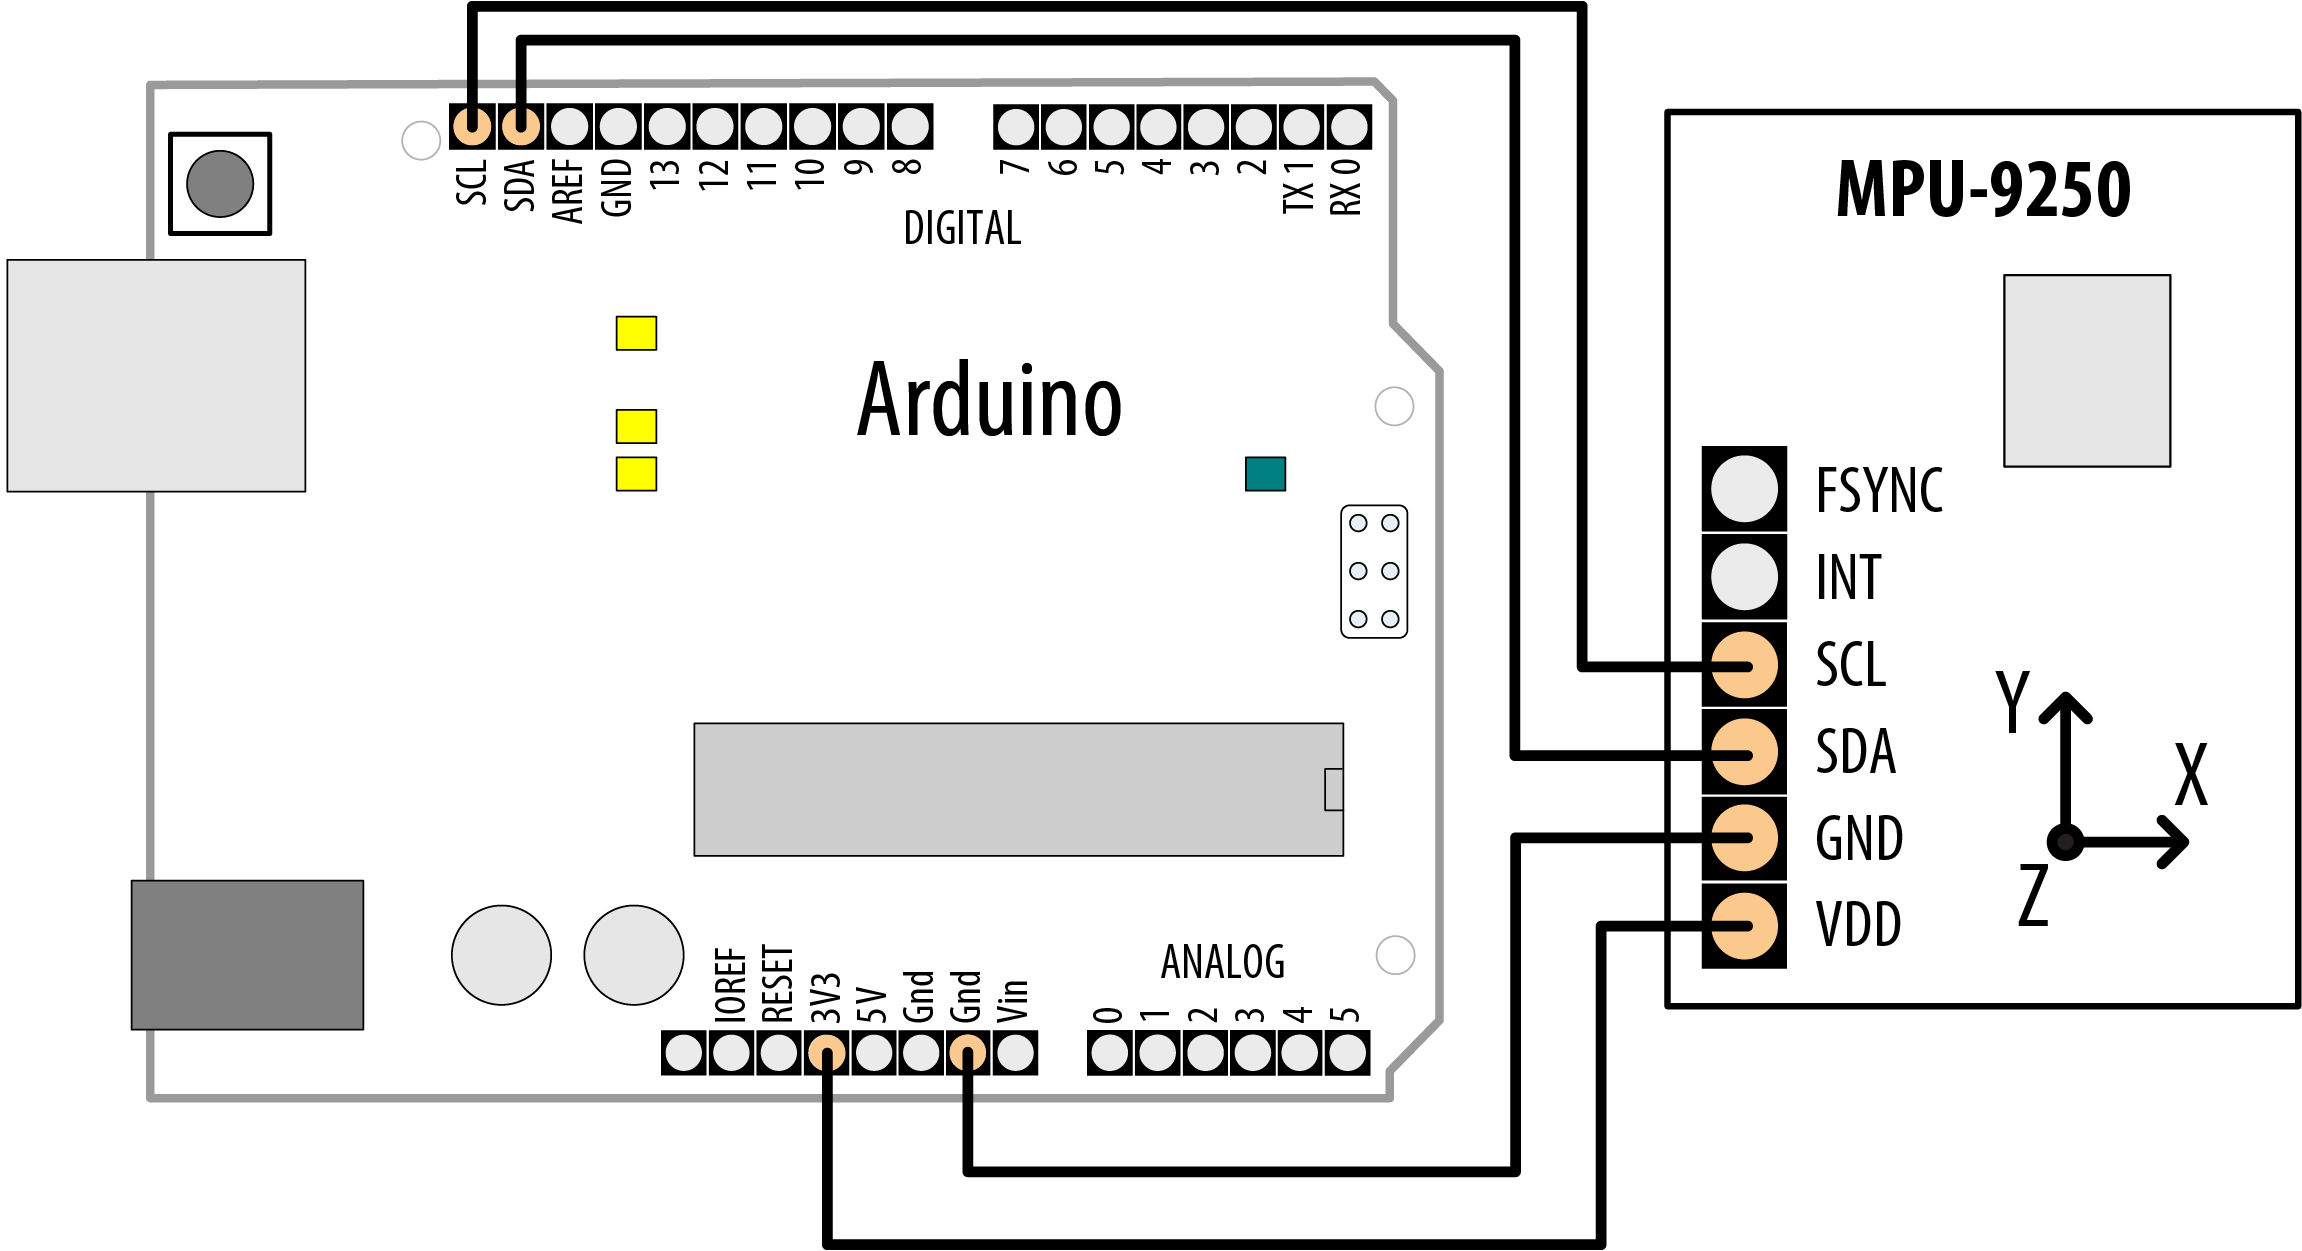
MPU-9250 IMU connected using I2C
Discussion
The sketch starts out by including the MPU9250 library, and declaring an object to represent the IMU. Within setup(), it attempts to initialize the IMU. If this fails, you may need to change the IMU_ADDRESS definition to 0x69 or check your wiring. After the IMU is initialized, the sketch changes the gyro’s full range to +/- 500 degrees per second.
Within loop, the sketch reads the sensor and obtains the rotational velocity in radians per second. It then uses the RAD_TO_DEG Arduino constant to convert this to degrees per second. The output of the sketch is readable in either the Serial Monitor or Serial Plotter.
See Also
See Chapter 13 for more about I2C.
See “Using 3.3 Volt Devices with 5 Volt Boards” for more about connecting 3.3V devices to 5V boards.
You can find a SparkFun tutorial for the MPU-9250 https://learn.sparkfun.com/tutorials/mpu-9250-hookup-guide/all. That tutorial uses a different library, but the concepts are the same.
6.16 Detecting Direction
Problem
You want your sketch to determine direction from an electronic compass.
Solution
This recipe uses the magnetometer in the MPU-9250 nine degrees of freedom (9 DOF)) inertial measurement unit (IMU) from Recipe 6.15. Connect the sensor as shown in Figure 6-18. Each of the MPU-9250’s three primary sensors (gyro, magnetometer, and accelerometer) read values in three dimensions (x, y, z), which is where the 9 degrees of freedom come from.
Note
Before you use the magnetometer, you must calibrate it. You can find a calibration sketch in this GitHub issue: https://github.com/bolderflight/MPU9250/issues/33. That sketch will store the calibration values in your microcontroller board’s non-volatile EEPROM memory. You will need to load the calibration values any time you want to work with the magnetometer, as shown in the next sketch. If you use the sensor with a different microcontroller board, you’ll need to run the calibration sketch again. Also, if you store anything else in the EEPROM, you’ll need to make sure you don’t store it in the same location as the calibration values.
/* Magnetometer sketch
   Read a magnetometer and display magnetic field strengths
*/

#include "MPU9250.h"
#include <math.h>
#include "EEPROM.h"

//  I2C address of IMU. If this doesn't work, try 0x69.
#define IMU_ADDRESS 0x68

// Change this to the declination for your location. See https://www.ngdc.noaa.gov/geomag/calculators/magcalc.shtml
#define DECLINATION (-14)

MPU9250 IMU(Wire, IMU_ADDRESS); // Declare the IMU object

void setup() {

  int status;

  Serial.begin(9600);
  while (!Serial);

  // Initialize the IMU
  status = IMU.begin();
  if (status < 0)
  {
    Serial.println("Could not initialize the IMU.");
    Serial.print("Error value: "); Serial.println(status);
    while (1); // halt the sketch
  }

  load_calibration();
}

void loop() {

  IMU.readSensor();

  // Obtain the magnetometer values across each axis in units of microTesla
  float mx = IMU.getMagX_uT();
  float my = IMU.getMagY_uT();
  float mz = IMU.getMagZ_uT();

  // From https://github.com/bolderflight/MPU9250/issues/33
  // Normalize the magnetometer data.
  float m = sqrtf(mx * mx + my * my + mz * mz);
  mx /= m;
  my /= m;
  mz /= m;

  // Display the magnetometer values
  Serial.print("mx:");
  Serial.print(mx, 4);
  Serial.print(",my:");
  Serial.print(my, 4);
  Serial.print(",mz:");
  Serial.print(mz, 4);
  Serial.println();

  float constrained = constrainAngle360(atan2f(-my, mx) + (DECLINATION * DEG_TO_RAD));
  float calcAngle = constrained * RAD_TO_DEG;
  Serial.print(calcAngle);
  Serial.println(" degrees");
  delay(100);
}

// From https://github.com/bolderflight/MPU9250/issues/33
float constrainAngle360(float dta) {
  dta = fmod(dta, 2.0 * PI);
  if (dta < 0.0)
    dta += 2.0 * PI;
  return dta;
}

// Load the calibration from the eeprom
// From https://github.com/bolderflight/MPU9250/issues/33
void load_calibration() {
  float hxb, hxs, hyb, hys, hzb, hzs;

  uint8_t eeprom_buffer[24];
  for (unsigned int i = 0; i < sizeof(eeprom_buffer); i++ ) {
    eeprom_buffer[i] = EEPROM.read(i);
  }
  memcpy(&hxb, eeprom_buffer, sizeof(hxb));
  memcpy(&hyb, eeprom_buffer + 4, sizeof(hyb));
  memcpy(&hzb, eeprom_buffer + 8, sizeof(hzb));
  memcpy(&hxs, eeprom_buffer + 12, sizeof(hxs));
  memcpy(&hys, eeprom_buffer + 16, sizeof(hys));
  memcpy(&hzs, eeprom_buffer + 20, sizeof(hzs));
  IMU.setMagCalX(hxb, hxs);
  IMU.setMagCalY(hyb, hys);
  IMU.setMagCalZ(hzb, hzs);
}
Warning
If you want to use the IMU with a 5 volt Arduino board, see “Using 3.3 Volt Devices with 5 Volt Boards” for details on how to use a logic level converter.
Discussion
The compass module provides magnetic field intensities on three axes (x, y, and z). These values vary as the compass orientation is changed with respect to the Earth’s magnetic field (magnetic north).
As with the sketch shown in Recipe 6.15, this sketch configures and initializes the IMU, but instead of showing gyro data, it reads magnetometer readings in units of microTesla and converts them to a compass bearing. (Another big difference is that it loads the calibration data from the EEPROM). For this sketch to work properly, the IMU must be on a level surface. You must also set the declination for your geographic location by changing the value of DECLINATION at the top of the sketch (use a negative number for a west declination, positive for east). See https://www.ngdc.noaa.gov/geomag/calculators/magcalc.shtml for a declination lookup tool.
The magnetometer readings are normalized by dividing each reading by the square root of the sum of the squares (RSS) of all the readings. The angle to magnetic north is calculated by adding the declination (in radians) to the following formula: radians = arctan2(–my, mx), constrained to 360 degrees (2 * PI radians) by the constrainAngle360 function. That result is converted to degrees by multiplying it by the RAD_TO_DEG constant. Zero degrees indicates magnetic north.
To make a servo follow the compass direction over the first 180 degrees, use the techniques shown in “Servos”, but use calcAngle to move the servo as shown:
angle = constrain(calcAngle, 0, 180);
myservo.write(calcAngle);
6.17 Reading Acceleration
Problem
You want to respond to acceleration; for example, to detect when something starts or stops moving. Or you want to detect how something is oriented with respect to the Earth’s surface (measure acceleration due to gravity).
Solution
This recipe uses the accelerometer in the MPU-9250 nine degrees of freedom (9 DOF)) inertial measurement unit (IMU) from Recipe 6.15. Connect the sensor as shown in Figure 6-18.
Warning
If you want to use the IMU with a 5 volt Arduino board, see “Using 3.3 Volt Devices with 5 Volt Boards” for details on how to use a logic level converter.
The simple sketch here uses the MPU-9250 to display the acceleration in the x, y, and z axes:
/* Accelerometer sketch
 * Read a accelerometer and display acceleration in m/s/s
 */

#include "MPU9250.h"

//  I2C address of IMU. If this doesn't work, try 0x69.
#define IMU_ADDRESS 0x68

MPU9250 IMU(Wire, IMU_ADDRESS); // Declare the IMU object

void setup() {

  Serial.begin(9600);
  while(!Serial);

  // Initialize the IMU
  int status = IMU.begin();
  if (status < 0) {
    Serial.println("Could not initialize the IMU.");
    Serial.print("Error value: "); Serial.println(status);
    while(1); // halt the sketch
  }

}

void loop() {

  IMU.readSensor();

  // Obtain the rotational velocity in rads/second
  float ax = IMU.getAccelX_mss();
  float ay = IMU.getAccelY_mss();
  float az = IMU.getAccelZ_mss();

  // Display velocity in degrees/sec
  Serial.print("ax:");  Serial.print(ax, 4);
  Serial.print(",ay:"); Serial.print(ay, 4);
  Serial.print(",az:"); Serial.print(az, 4);
  Serial.println();
  delay(100);
}
Discussion
This sketch is similar to the gyro sketch from Recipe 6.15, except that it displays acceleration along each axis in meters per second squared (m/s/s). Even when stationary, you’ll notice that the Z acceleration hovers around -9.8 m/s/s. At least that’s what you’ll see if you’re running this sketch on Earth, where gravity is roughly 9.8 m/s/s. If you see a value of 0 along the Z axis, then the sensor is in free-fall. The force that causes the 9.8 m/s/s acceleration is the mechanical force of whatever is keeping the sensor from falling (your hand, a table, the floor). Although the object appears to have no acceleration from your viewpoint, it is accelerating relative to free-fall, which is the condition that would apply if there was nothing (no floor, no table, no hand) between your sensor and the center of the Earth. If there was nothing between your sensor and the center of the Earth, that would a be somewhat unusual and certainly undesirable configuration of Earth’s mass, at least from the viewpoint of Earth’s life forms.
You can use techniques from the previous recipes to extract information from the accelerometer readings. You might need to check for a threshold to work out movement (see Recipe 6.7 for an example of threshold detection). You may find it useful to apply a moving average formula to the incoming data.
If the accelerometer is reading horizontally, you can use the values directly to work out movement. If it is reading vertically, you will need to take into account the effects of gravity on the values. This is similar to the DC offset in Recipe 6.8, but it can be complicated, as the accelerometer may be changing orientation so that the effect of gravity is not a constant value for each reading.
The data produced by accelerometers can be difficult to work with, particularly trying to make decisions about movement over time - detecting gestures, not just positions. Machine learning techniques are starting to be used to process live sensor data and recognise how they relate to example sets of data produced before. These approaches currently need to run on a computer, and are still quite fiddly to set up, but can produce very useful results.
See Also
An excellent example that is integrated with Arduino boards is the Example-based Sensor Prediction system by David Mellis, built on top of the Gesture Recognition Toolkit: https://create.arduino.cc/projecthub/mellis/gesture-recognition-using-accelerometer-and-esp-71faa1.
Also worth looking at is Wekinator: http://www.wekinator.org/instructions/
SparkFun’s advanced library for the MPU-9250, which includes pedometer, tap, and orientation direction. It requires a SAMD-based Arduino or Arduino-compatible: https://github.com/sparkfun/SparkFun_MPU-9250-DMP_Arduino_Library