
We are now going to see how to access the data stored on dweet.io and display it graphically. For that, we are going to use a website called freeboard.io. You can go there with the following URL http://freeboard.io/.
This is the main welcome screen where you need to create an account:
Once you have an account, you can create a new board:

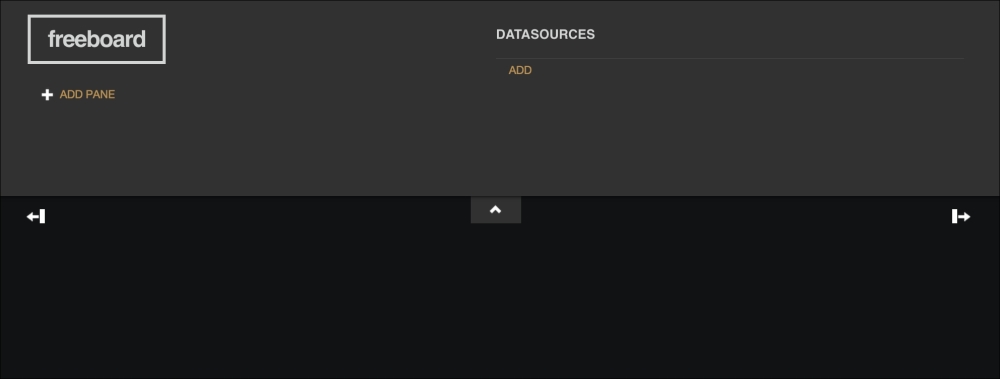
Once this is done, you should be redirected to a similar page showing an empty board:
First, we need to set a datasource, meaning that we need to tell Freeboard to get data from the dweet thing we are storing the data in. Add a new datasource and fill out the fields as shown in the following screenshot, with the name of the thing that stores your data of course:

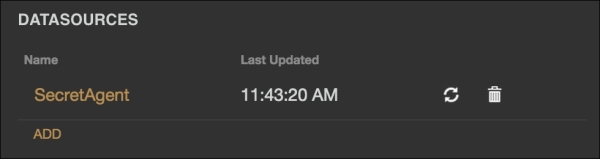
After that, you will see the datasource appearing at top of your board, with the last update date:
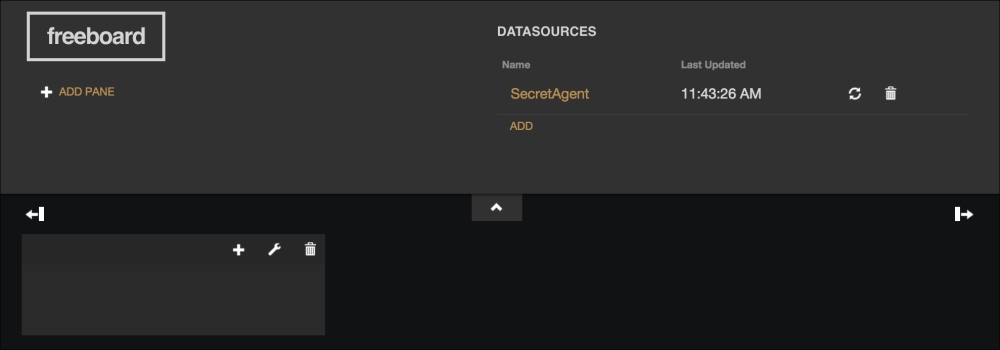
It's now time to add some graphical elements to our dashboard. We'll first add one for the temperature. Click on a new pane, which will create a new block inside the dashboard:
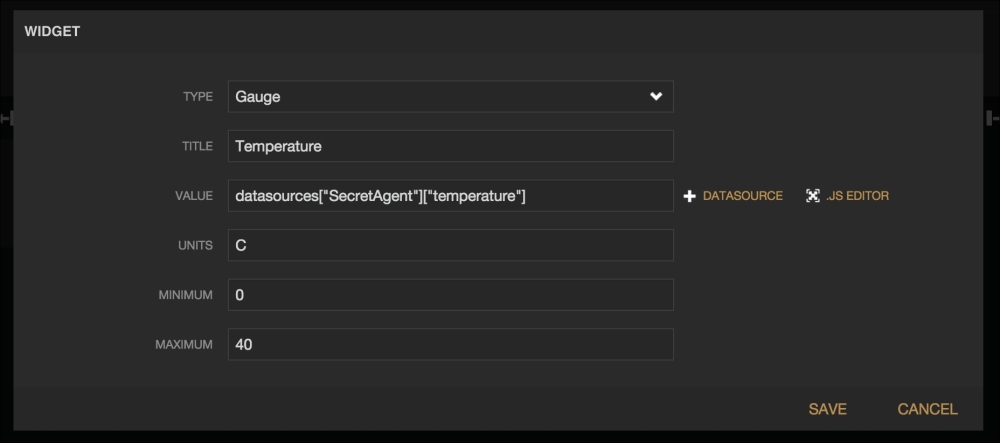
Then, click on the little + sign to create a new widget. Here, we are going to use a gauge widget for the temperature. Fill out the widget creation form as in the following screenshot:
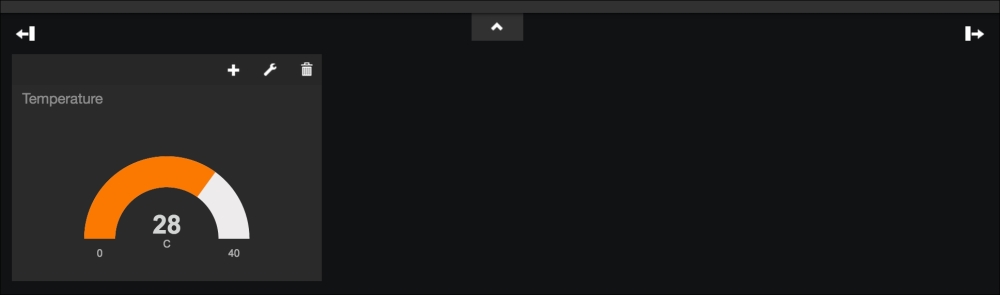
You should immediately see the gauge for the temperature on your board:
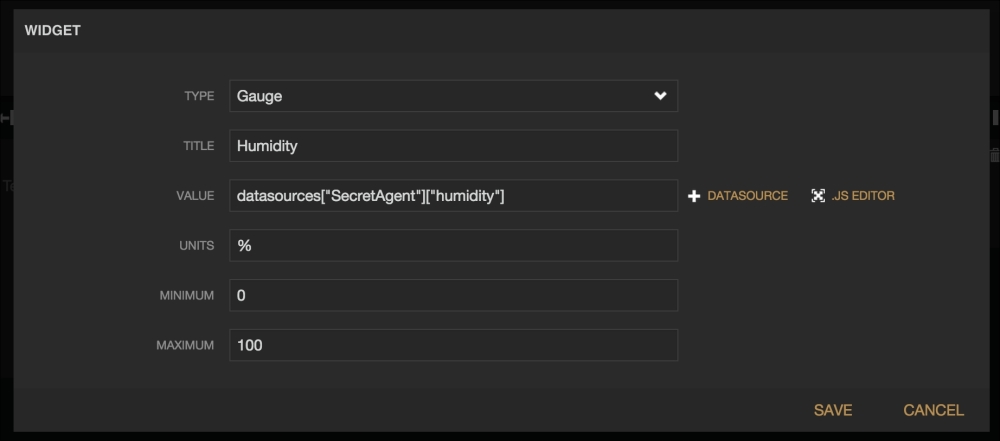
Now, let's do the same for humidity:
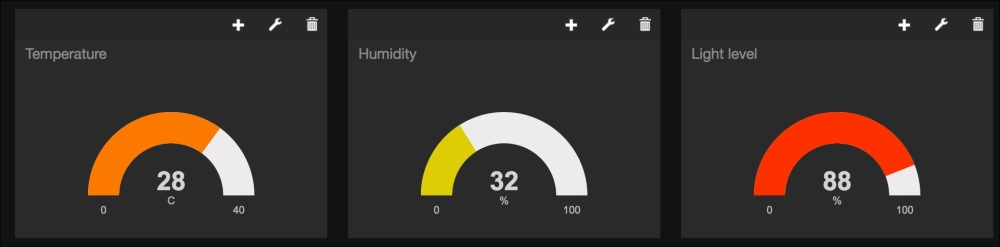
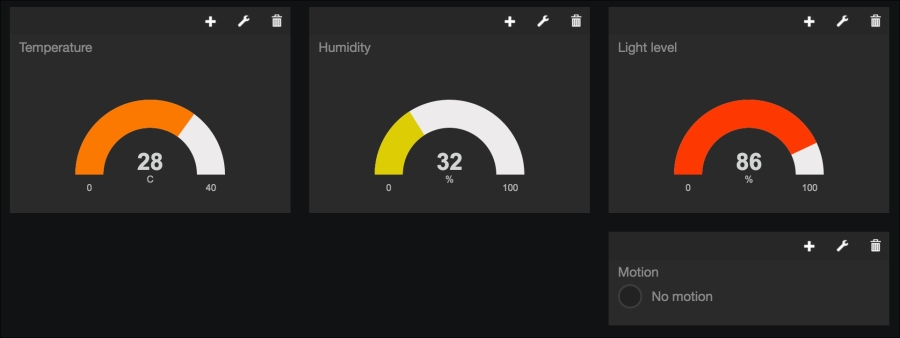
You can also do the same for the ambient light level. You now have all the data from these sensors refreshed in near real-time on your board:
The last thing we need to put in is the motion sensor. As it's an on/off sensor, I used an indicator widget for this:
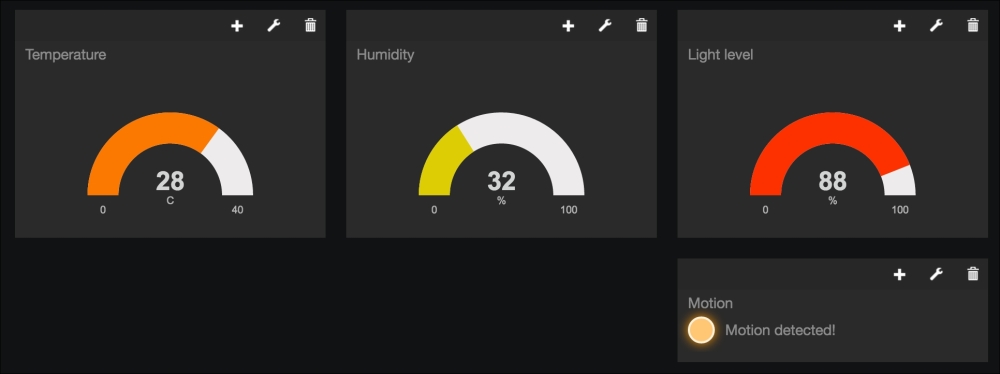
Now try to pass your hand in front of the sensor. You should immediately see that the indicator changes its color:
Congratulations, you now have a dashboard that you can access at any time to spy on this data!