
Using Mapbox Studio, we can add large datasets to our maps as new layers. In this chapter, we will build on top of the custom map style we created in Chapter 12. Once we load in the dataset, we can view it in the map view without changing anything. We’ll also see how to retrieve the underlying data features when a user interacts with the map.
This chapter uses the project we created in Chapter 12 with Mapbox Studio as a base. If you have not created the custom map style, and displayed in the map view, go ahead and follow those directions.
Earthquake map

Earthquake data points in the app
Let’s get started with the first step and collect the data we need to show on our map.
Downloading the earthquake data
The earthquakes’ dataset we are using for visualization comes from the United States Geological Survey (USGS) . If you are curious and want to learn more about earthquake monitoring and research, visit their website at www.usgs.gov/natural-hazards/earthquake-hazards.
You can also visit https://earthquake.usgs.gov/earthquakes/map/ to find a map of earthquakes, refreshed frequently from the server. We will be creating something similar, but with historical earthquake data.
The Earthquake Catalog, which can be accessed at https://earthquake.usgs.gov/fdsnws/event/1/, lists all of the different APIs supported by the Earthquake Hazards Program. For our purposes, we are interested in querying historic earthquake information and then returning the results as GeoJSON. GeoJSON is a data encoding format for geographic features, including points, lines, and polygons, along with any associated properties.
Sample of GeoJSON response for earthquake API query
Make the API call, and then download the results to a GeoJSON file – try using a web browser or the curl command. The GeoJSON file is also included in the downloadable source code for the book, in Chapter 13 folder. Feel free to try other date ranges with the API, if you like. For this particular project, we will be using the mag property (the magnitude of the earthquake), so other GeoJSON sources may not be an exact match for the process. The concepts used here would translate well to other projects, however.
We will take the list of earthquakes that we just downloaded and then upload them to Mapbox Studio next.
Creating a dataset on Mapbox Studio
Mapbox Studio lets you save and edit collections of GeoJSON features in the cloud, such as the earthquake data we just downloaded. These datasets can be turned into tilesets, which then may be edited in the Mapbox Studio style editor we used in Chapter 12. We will go through this entire process, from uploading a dataset to styling the features in the editor.
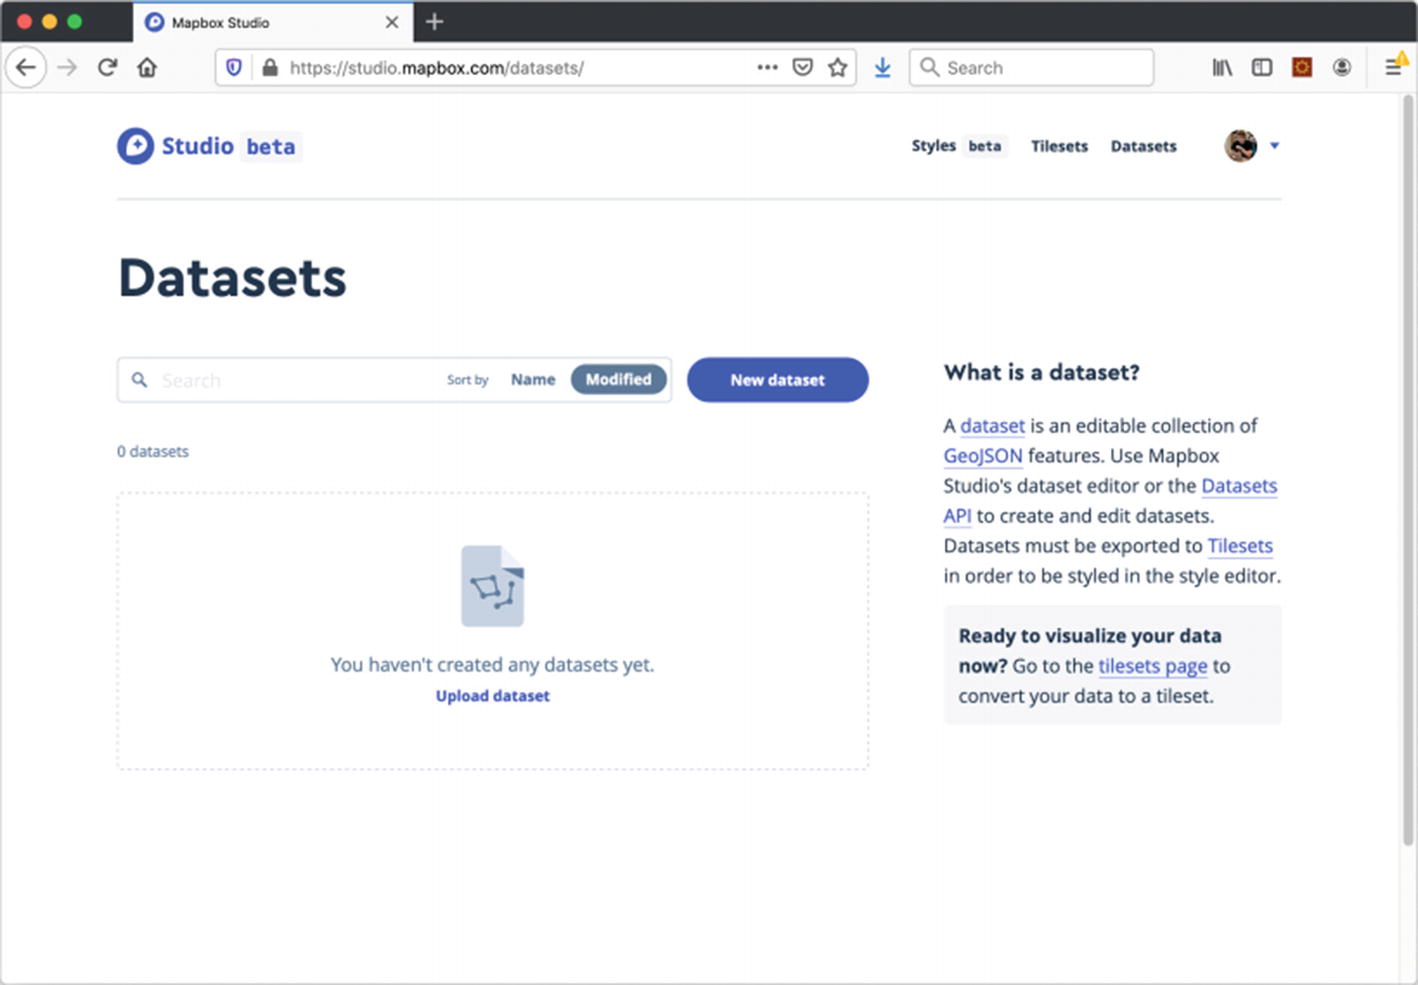
Mapbox Studio Datasets web page
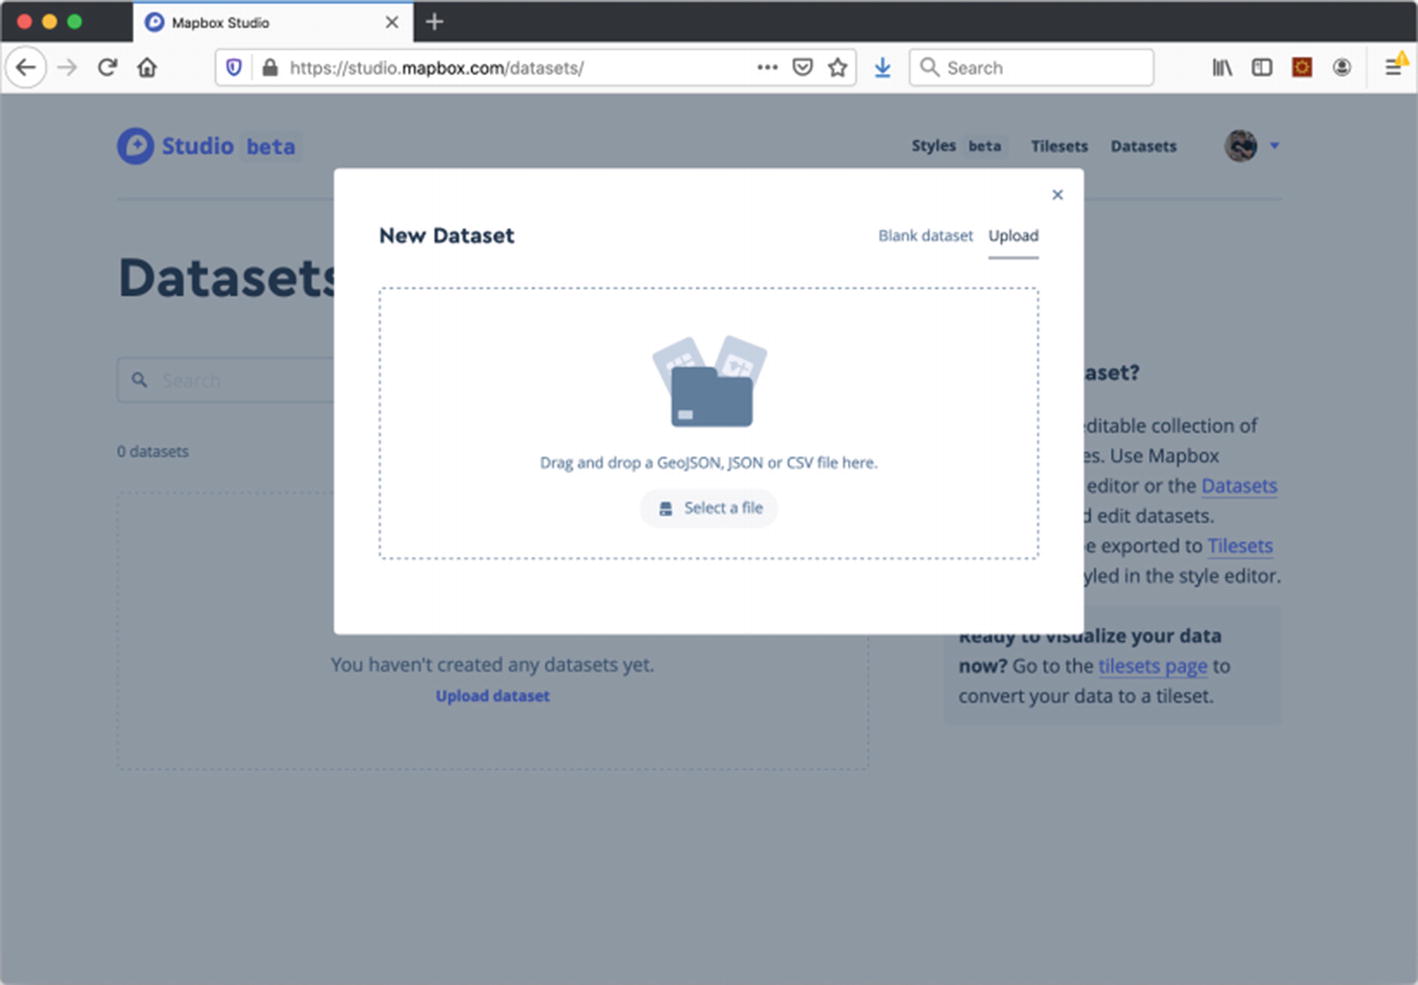
Upload a new dataset to Mapbox Studio

Confirm dataset upload to Mapbox Studio
If the number of features Mapbox found matches the number of features you would expect to see in your GeoJSON file, click the Confirm button. You may name your dataset to be whatever you like, but the default will be the name of the file you uploaded. In our case, that would be Earthquake2020-01-01. If that name works, click the Create button.
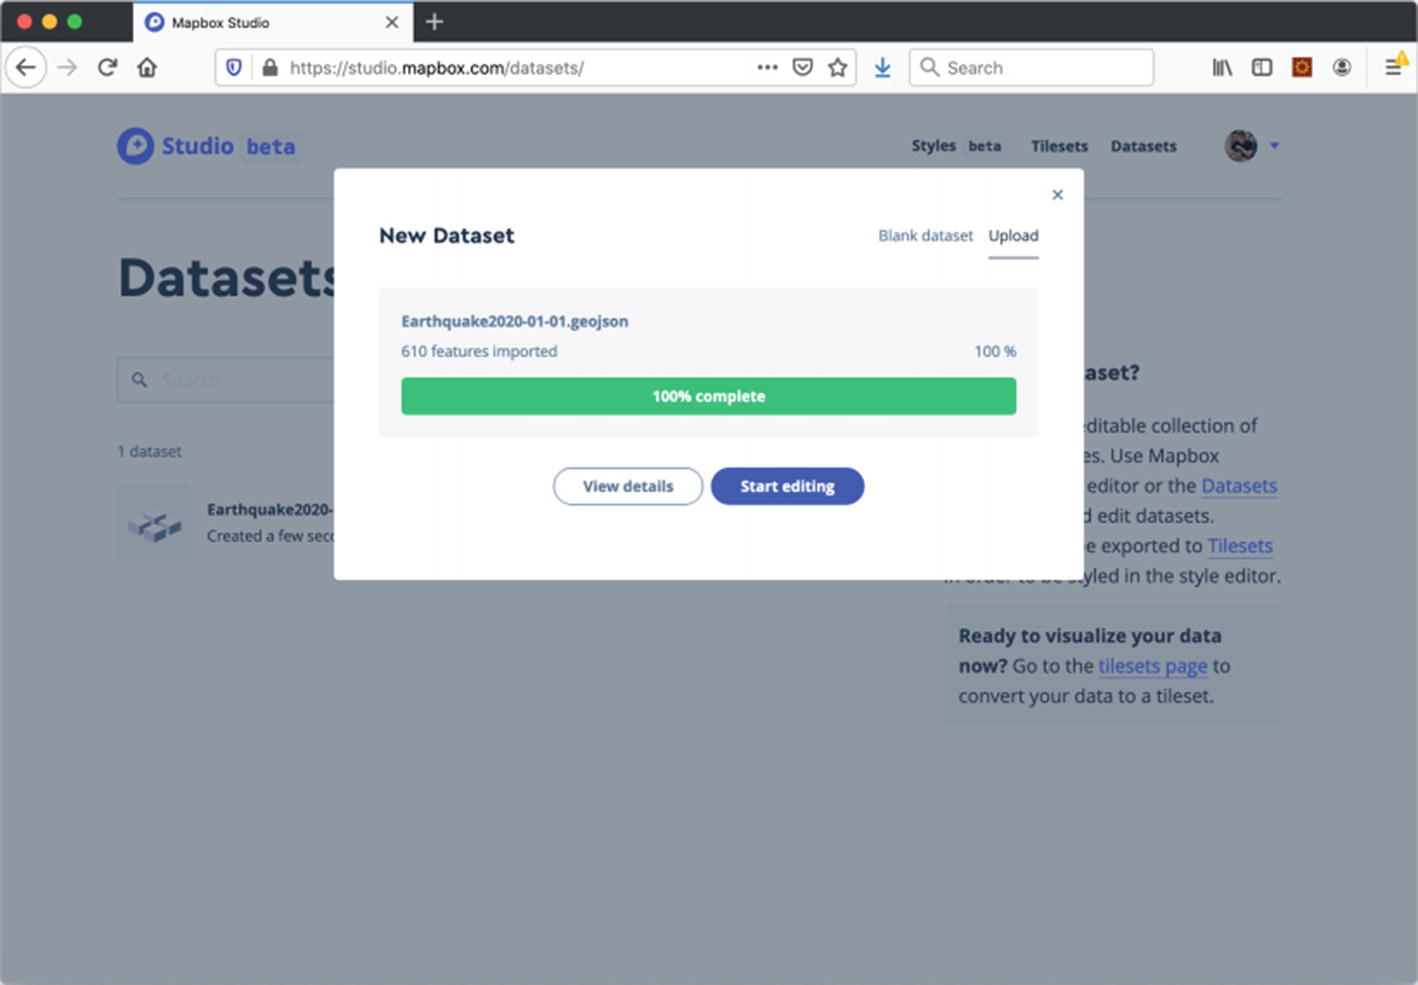
Dataset upload confirmation dialog box

Dataset editor showing an earthquake point
In our case, we are using clean data from the API, so we do not need to inspect the data for anomalies or to clear up missing values. We can also take a quick glance at the data and see if the dataset we just imported makes sense and matches where we would expect to see data points.
This dataset imported correctly, and we can create a tileset from this dataset. The difference between a dataset and a tileset is that we will be able to modify how the data appears in the map in a tileset, instead of editing the data values in the the dataset.
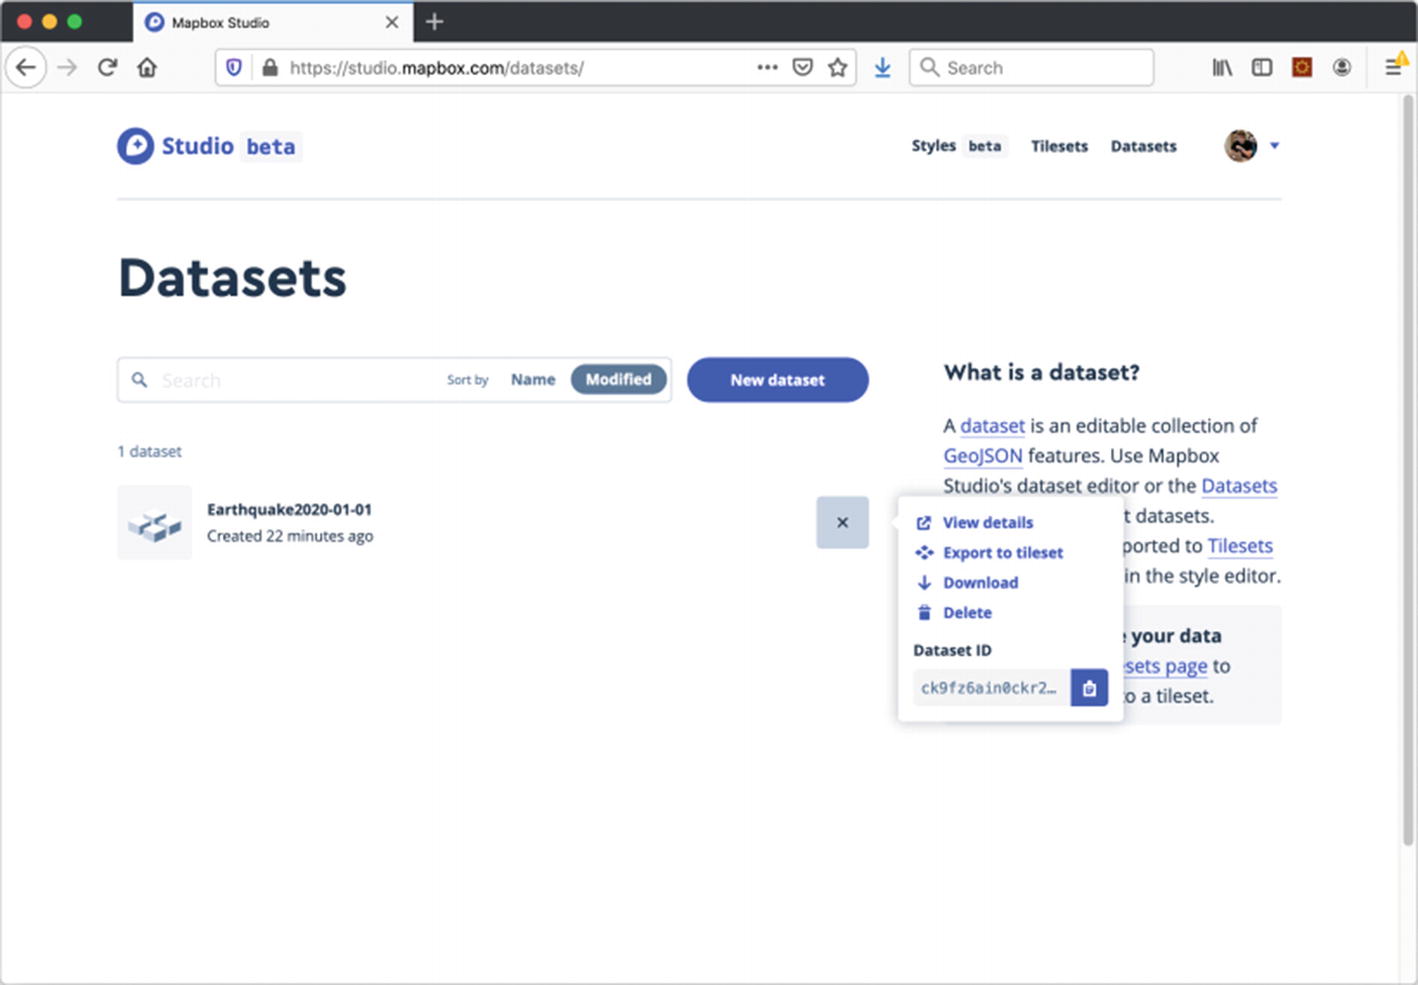
Pop-up menu to view details for a dataset
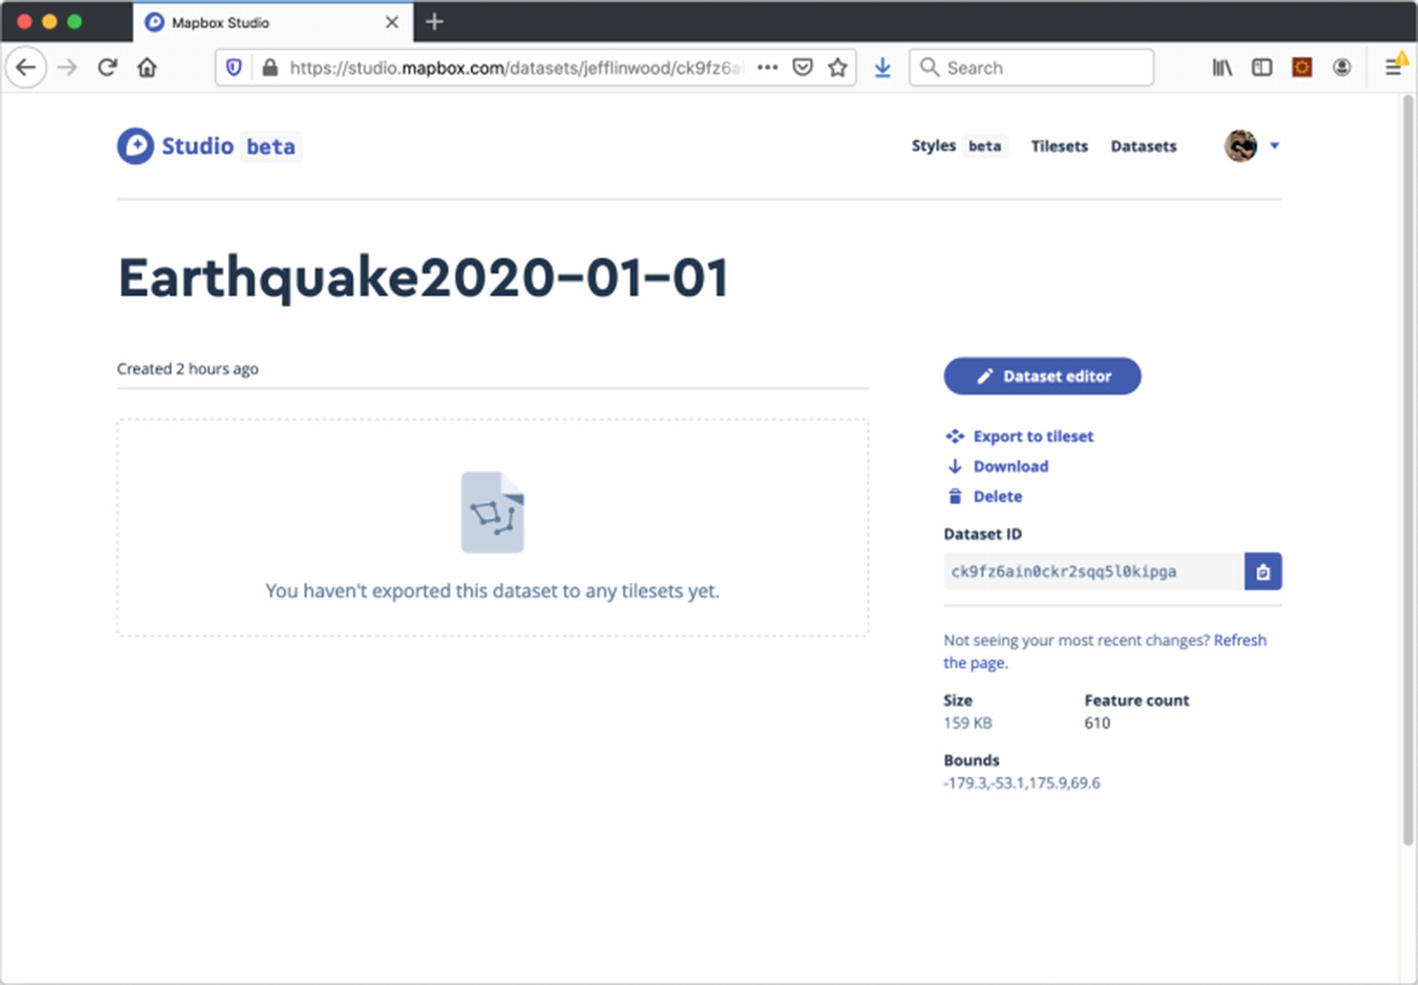
Dataset details screen
In the next section, we will create a tileset. This tileset is what we use in the Mapbox Studio style editor to change the appearance of the data in the map.
Creating a tileset

Export to tileset dialog box
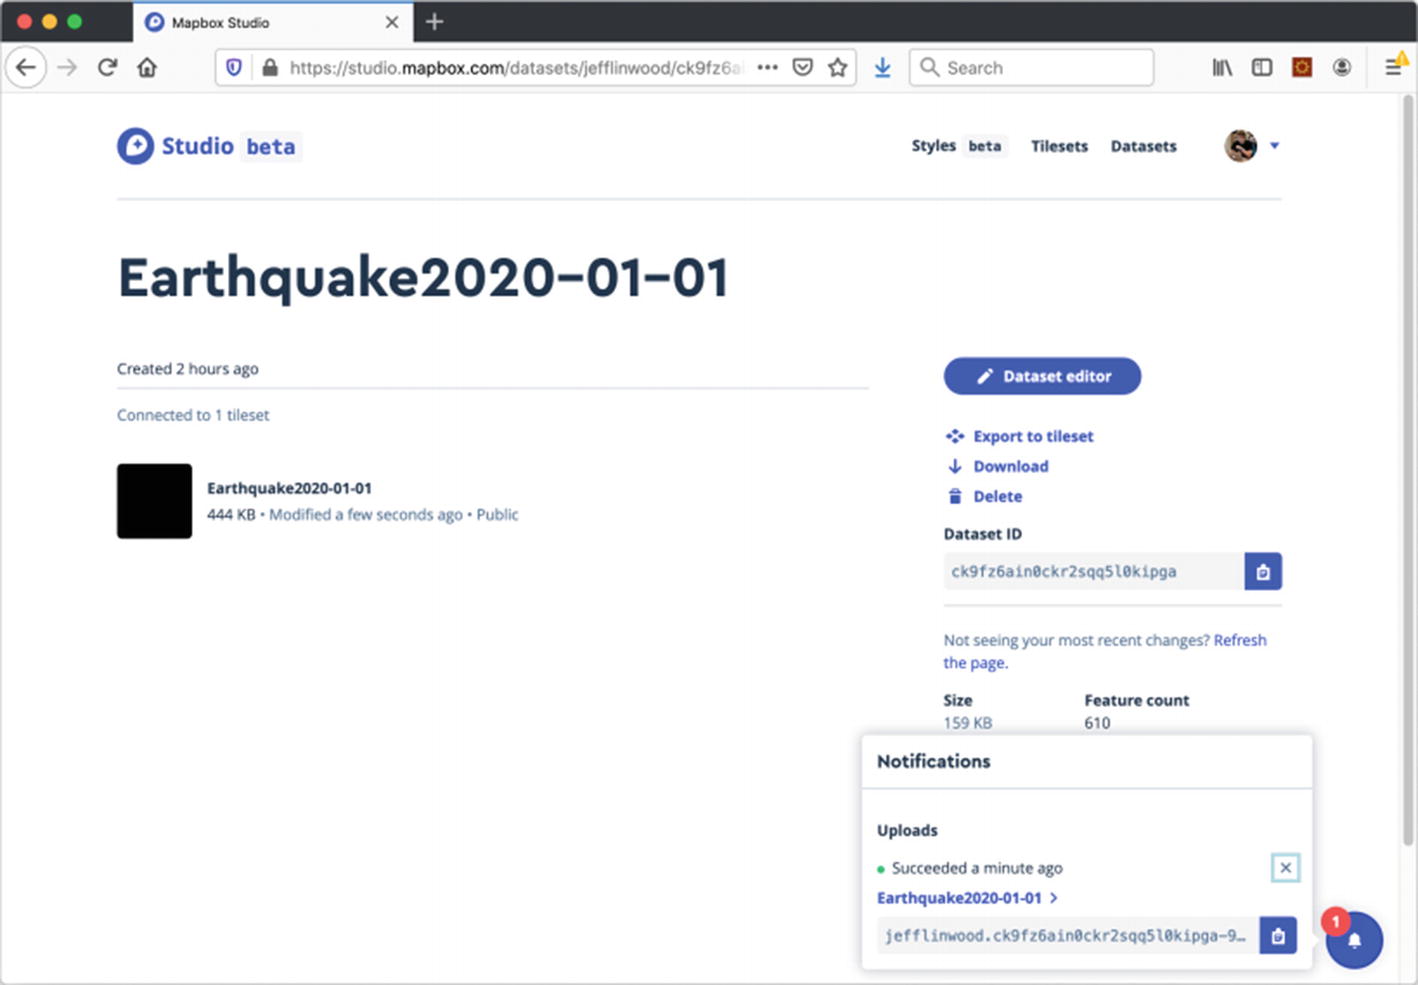
Connected tileset along with processing notification on dataset details screen
If you click the tileset, you will get a preview of the data in the tileset, as it would be laid out on a map. This can be useful to make sure the dataset export processed correctly.
Our next step will be to add this tileset to the map style we created in Chapter 12. If you have not created a map style yet, go ahead and follow the directions in Chapter 12.
Adding the tileset to a style
We now need to open up our map style to add the tileset as a layer. Click the Styles tab in the upper right-hand corner of the web page or navigate to https://studio.mapbox.com/ to see the list of your styles. Choose the map style you created in the last chapter, and click it to enter the style editor.
In the style editor, choose the Layers tab in the left-hand sidebar. We need to add a new layer, so click the plus button in the upper right-hand side of the Layers tab. When the New layer window appears, a list of data sources will appear, including historical election results.
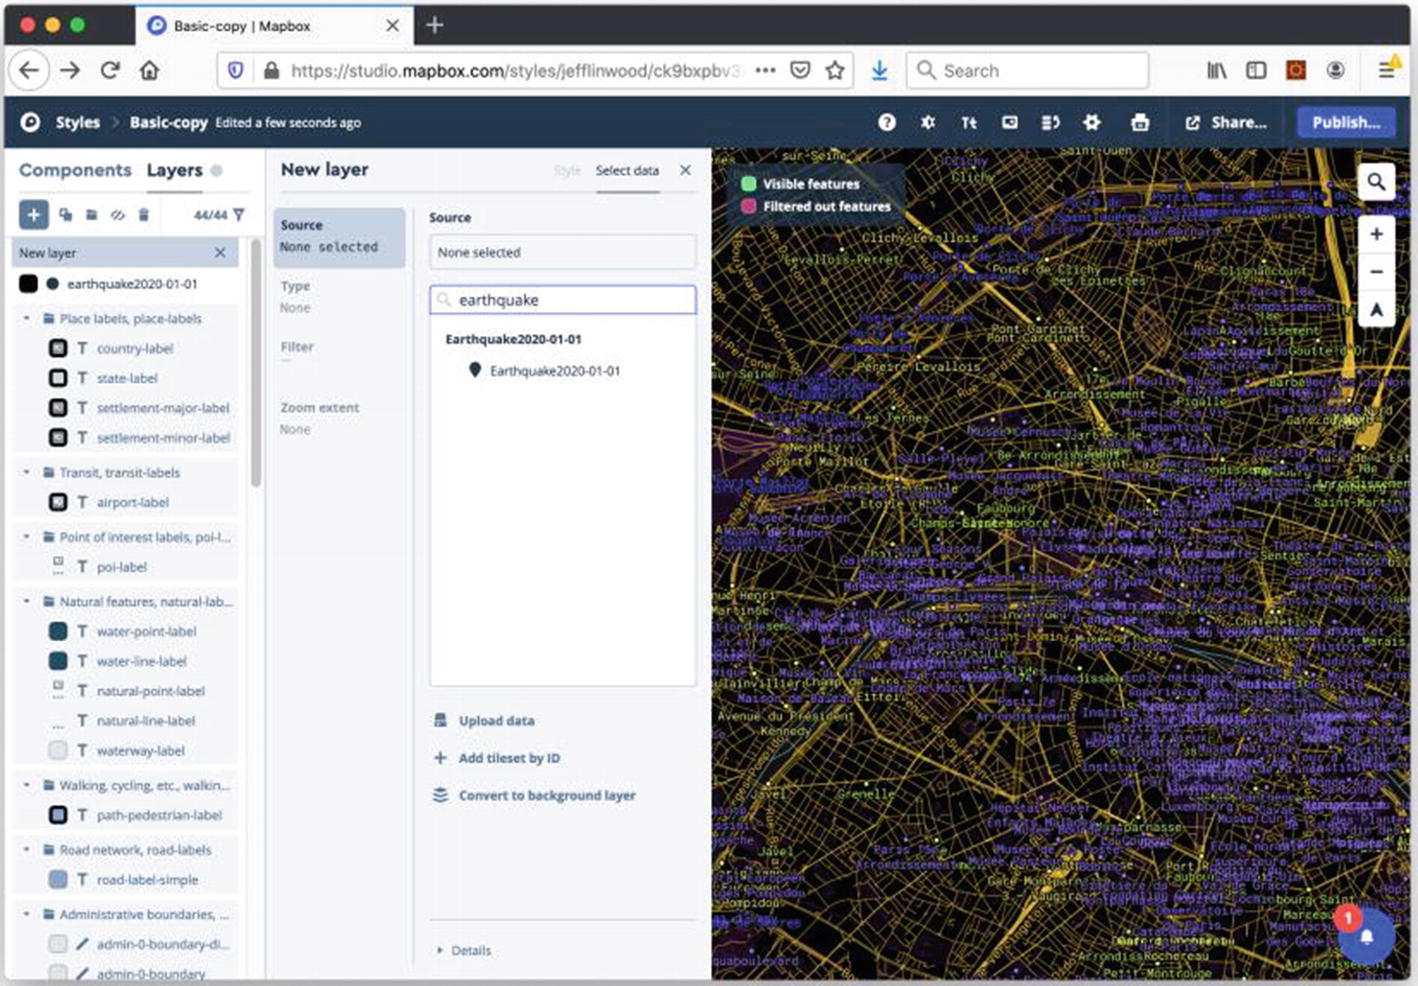
Adding a tileset to the map style
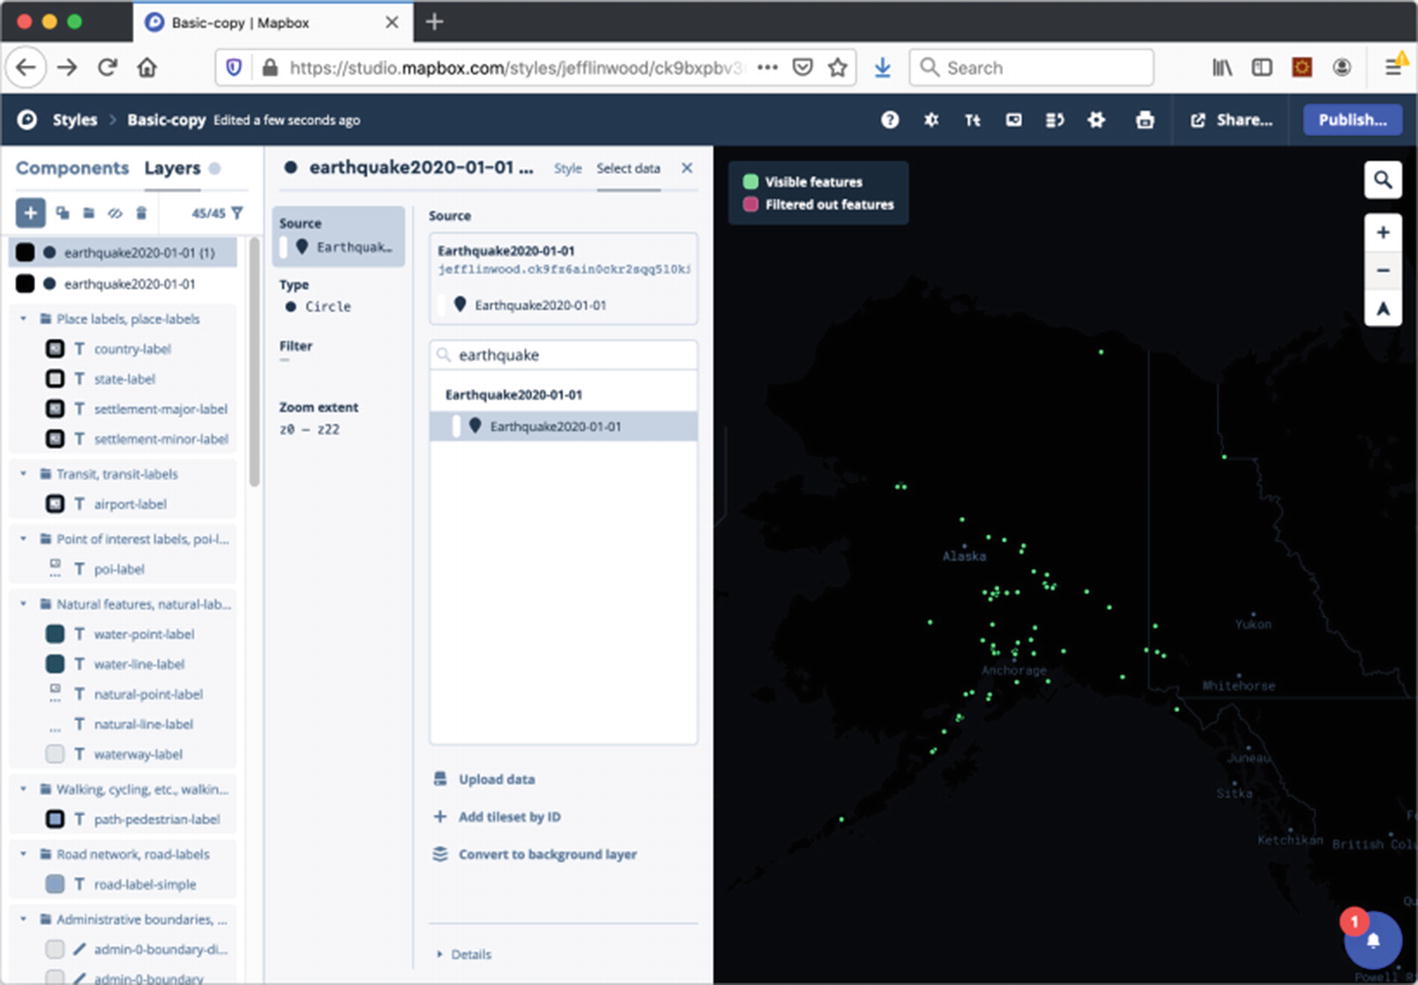
Added a tileset to the map studio, showing features as green dots
Now that we have added the tileset, we can change the way it displays in any map that uses this style.
Styling the features with Mapbox Studio

Default tiles for the earthquake layer

Data points with a red fill color
You can also change the stroke color and the stroke outline to give the data points even more contrast. Try setting the stroke color to the hexadecimal color value ece9e9 and adjusting the stroke width to 1 pixel. You can also choose your own colors here too, if you like; it won’t affect the project.
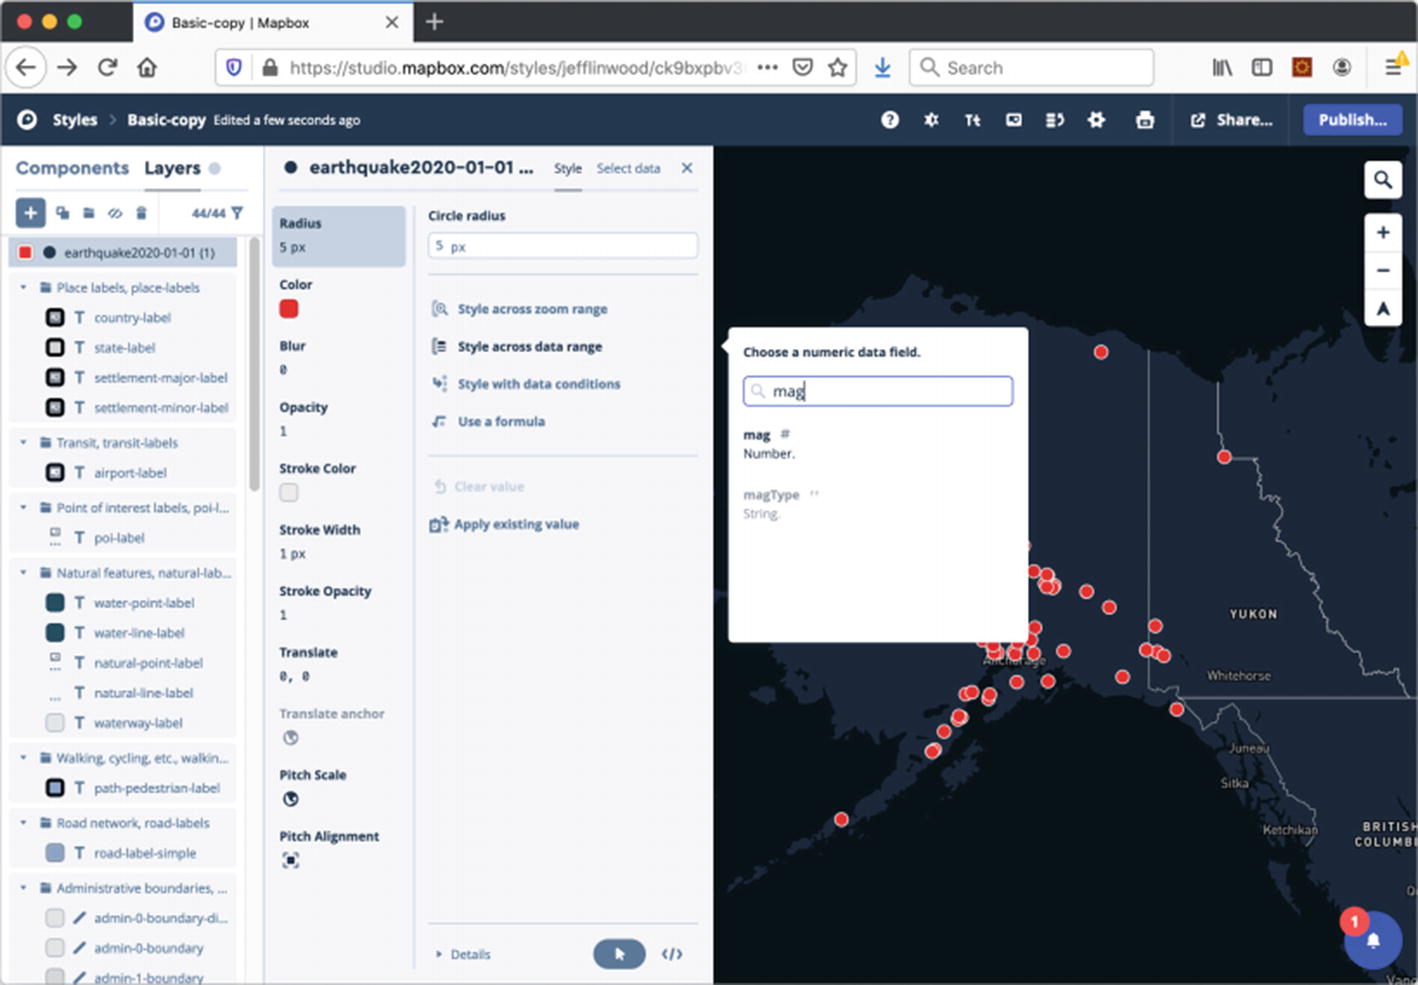
Choosing the magnitude data field to vary the radius field
After choosing the magnitude field, you will have several options appear to vary the radius. We are going to do a simple linear interpolation between the lowest magnitude, with 5 pixels, and the largest magnitude with 15 pixels.

Editing the radius data settings for the earthquake data
This settings view can be somewhat confusing. There are two stops for a linear interpolation of the magnitude data point – the lowest value, at –0.5, and the highest value, at 5.4. Both have a circle radius of 5 pixels, so there is no variation.

Adjusting the radius to vary with the magnitude linearly
Be sure to click Done to save the changes to the radius. You could add more stops here, in case you want to set the radius for an intermediate value.
You could also change the other values, such as color or stroke size to vary with magnitude, or one of the other properties in your dataset. Feel free to experiment with this.
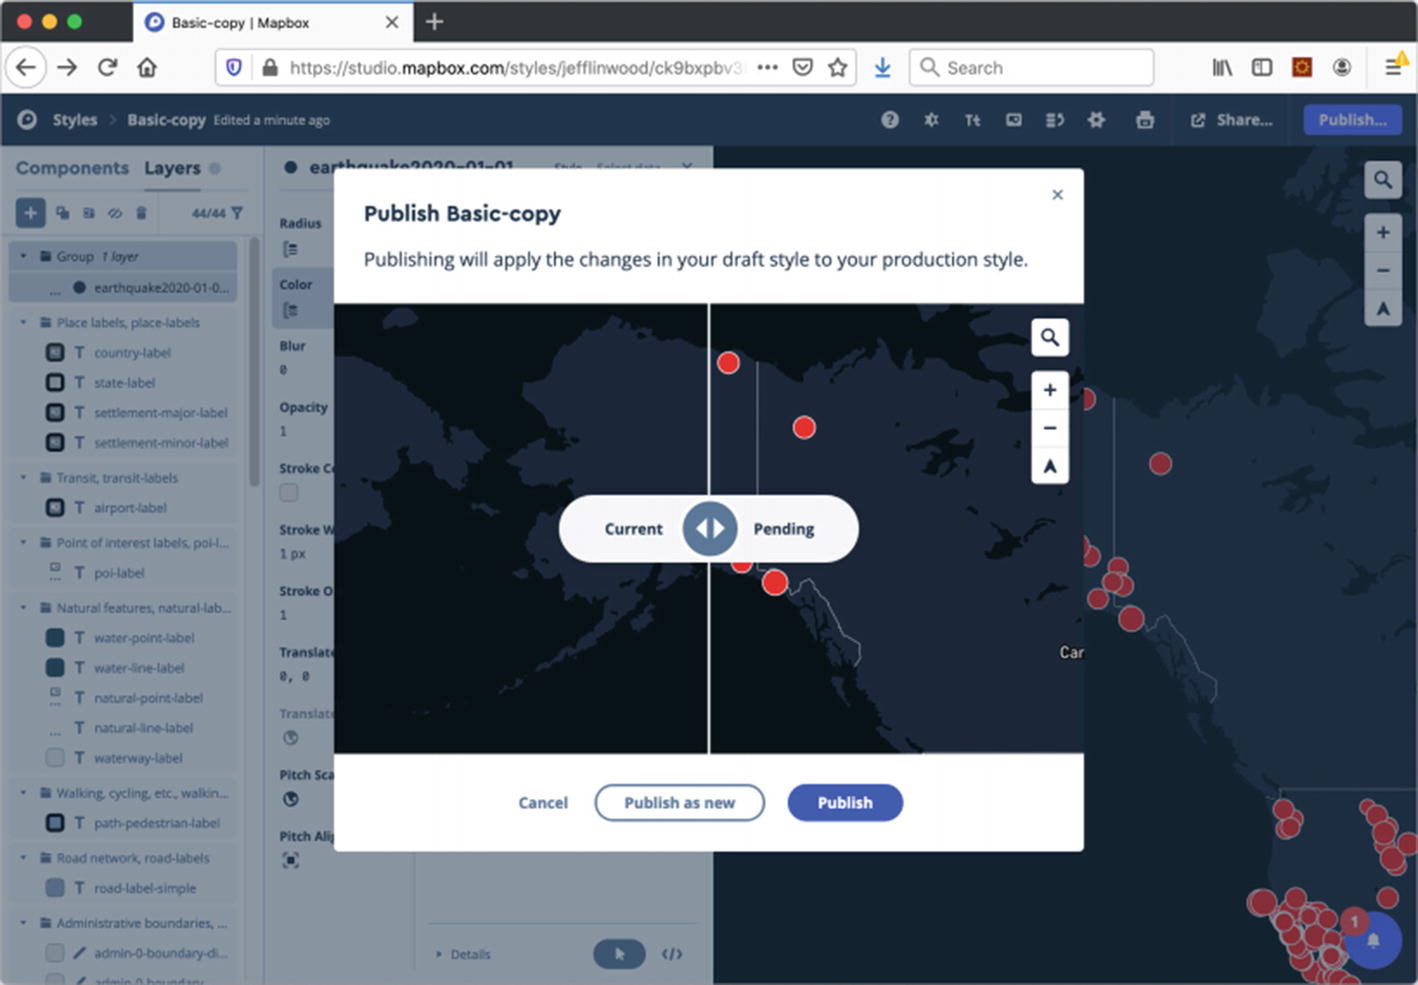
Publishing changes to the map style
You can see your data additions in this dialog box, with the new map styles you applied. If everything looks good, click Publish, and your changes will be live for any websites or mobile apps that use this map style. If you would like to publish a new version of this map style, for instance, to avoid changing the look and feel for existing users, you can do that as well through this dialog box.

Publish confirmation message for map styles
We can now leave Mapbox Studio and open up Xcode to see our changes in the app.
Displaying the dataset in the app
Running the app from Chapter 12 should display the map style you just edited, with the earthquake data points. No code changes should be needed. If you do not see the earthquake data, make sure you published the map styles in Mapbox Studio, and you are viewing a part of the world that has earthquakes.

Earthquake data points in the app
While these data points are not map markers like we used in Chapter 11, they are features we can detect when a user taps on the map. For the final part of this project, let’s print some information on the console when a user taps on a data point.
Detecting a tap on the features
To do something when a user taps on the map, we need to add a standard UIKit tap gesture recognizer to the map view. The MGLMapView class already has several tap recognizers that it uses to detect user input for map operations like scrolling and zooming. We need to add a tap gesture recognizer, and only have it do something if the built-in tap gesture recognizers do not handle the tap. This is a common pattern for Mapbox map views and not limited to the use case of detecting taps for data features.
Adding a tap gesture recognizer to the map view
The tap gesture recognizer will call a method named mapTapped(sender:)) that we also need to implement. When the map is tapped, we will ask the map view to identify any features at that point, and then we will list them to the console. You can also ask the map view to only show you features in a certain layer or layers, if you want.
Looking up visible map features when a user taps the app
Add the preceding method to the app, and then run the app. Be sure to add a call to addGestureRecognizer() in your viewDidLoad() method as well. When you tap on one of the earthquake circles, you will see the properties of the feature output on the console in Xcode.
Conclusion
This is the simplest possible implementation here – we could easily extend this out to update labels in an in-app UI (such as a bottom toolbar) with information about the data point, for instance. The earthquake data features returned by the map would be MGLPointFeature objects. If we had uploaded GeoJSON data with polylines or polygons, those would have been other classes that implement the MGLFeature protocol, such as MGLPolylineFeature or MGLPolygonFeature.
This was a fairly involved project, but I hope you enjoyed working with some real data and building out a visualization using the Mapbox Studio.
In our next chapter, we step away from Mapbox Studio and turn our attention to providing driving directions with Mapbox. We will create an app that provides a turn-by-turn directions user experience with the Mapbox Navigation framework.