
Chapter 5
Applying Wireless Design Requirements
This chapter covers the following topics:
Defining AP Coverage: This section explains an AP cell and the parameters that define usable wireless coverage inside the cell.
Expanding Coverage with Additional APs: This section explains the design process of using multiple AP cells to provide wireless coverage and service over a larger area.
Designing a Wireless Network for Data: This section explains the strategy behind developing an AP deployment to support generic data applications.
Designing a Wireless Network for High Density: This section covers design strategies to provide effective wireless coverage in areas with a high density of users.
Designing a Wireless Network for Voice and Video: This section explains design guidelines and special considerations for AP deployments that must support real-time applications.
Designing a Wireless Network for Location: This section covers design goals for AP deployments that support wireless device location in near real time.
This chapter covers the following ENWLSD exam topics:
2.4 Apply design requirements for these types of wireless networks
2.4.a Data
2.4.b Voice and video
2.4.c Location
2.4.d Hyperlocation
2.5 Design high-density wireless networks and their associated components (campus, lecture halls, conference rooms)
Wireless networks in the enterprise should be carefully designed so that they effectively support their target user communities. To build such a network, you must first understand how to control and tune a single AP’s coverage cell. You can then apply the same principles to more APs to expand the wireless coverage over a greater area. The APs must operate their cells independently yet coexist and not interfere with each other. In this chapter, you will learn more about these design concepts as well as tailoring designs to support high client density and the unique characteristics of wireless applications.
“Do I Know This Already?” Quiz
The “Do I Know This Already?” quiz allows you to assess whether you should read this entire chapter thoroughly or jump to the “Exam Preparation Tasks” section. If you are in doubt about your answers to these questions or your own assessment of your knowledge of the topics, read the entire chapter. Table 5-1 lists the major headings in this chapter and their corresponding “Do I Know This Already?” quiz questions. You can find the answers in Appendix D, “Answers to the ‘Do I Know This Already?’ Quizzes and Review Questions.”
Table 5-1 “Do I Know This Already?” Section-to-Question Mapping
Foundation Topics Section |
Questions |
|---|---|
Defining AP Coverage |
1–5 |
Expanding Coverage with Additional APs |
6 |
Designing a Wireless Network for Data |
7 |
Designing a Wireless Network for High Density |
8 |
Designing a Wireless Network for Voice and Video |
9 |
Designing a Wireless Network for Location |
10 |
1. To successfully receive a signal and interpret data from it, which of the following statements must be true about the receiver’s sensitivity level?
The received signal strength must be greater than the sensitivity level.
The sensitivity level must be greater than the received signal strength.
The sensitivity level must be less than the noise floor.
The sensitivity level must be greater than the SNR.
2. Which one of the following parameters is measured as the main criteria to determine the boundary of an AP’s coverage cell?
Receiver sensitivity level
Noise floor
RSSI
SNR
3. Which one of the following is a commonly used signal strength that defines the boundary of an AP cell?
20 dBm
67 dBm
0 dBm
−20 dBm
−67 dBm
4. The SNR is correctly measured according to which one of the following statements?
The AP’s transmit power level minus the noise floor
The receiver’s sensitivity level minus the noise floor
The noise floor minus the AP’s transmit power level
The RSSI minus the noise floor
5. Regarding a wireless client in relation to an AP, which one of the following statements is not true?
As the client moves away from the AP, the AP’s signal strength decreases.
As the client moves away from the AP, the usable data rate decreases.
As the client moves toward the AP, the SNR increases (assuming the noise floor stays constant).
As the client moves toward the AP, the usable data rate decreases.
6. When multiple APs are located with overlapping cells to cover a large area, some of them will likely be configured to use the same channel. At the cell boundary of an AP, the RSSI of that AP should be separated from the RSSI of neighboring APs using the same channel. Which one of the following identifies the correct amount?
At least 19 dB higher than the neighbors.
At least 19 dB lower than the neighbors.
At least −82 dBm greater than the neighbors.
It does not matter; neighboring APs can use the same channel without impact.
7. Suppose you want to design an AP deployment to support generic applications and their data. Which one of the following correctly describes a best practice design goal at AP cell boundaries?
The RSSI of the AP should be −67 dBm at the highest mandatory or supported data rate.
The RSSI of the AP should be −67 dBm at the lowest mandatory or supported data rate.
The SNR of the AP should be −67 dBm at any data rate.
The RSSI of the AP should equal the noise floor.
8. Suppose you are working on a wireless design that will support a high density of clients in a large classroom. You begin by adjusting an AP’s transmit power level down to its lowest setting, but you find that the AP’s cell is still too large for your design. What is the next logical step to take with the AP?
Use an external omnidirectional antenna.
Use an external patch antenna.
Install a second AP next to the first one and use the same channel on each.
Enable the lowest data rate to reduce the cell size.
9. Which of the following statements are valid design goals for an AP deployment that will support voice over Wi-Fi calls? (Choose all that apply.)
Make 12Mbps the lowest mandatory data rate.
Design for call capacity per AP.
Use every possible 5GHz non-overlapping channel.
Consider avoiding 5GHz DFS channels.
10. Suppose you need to design a wireless network to support location-based applications. Which one of the following is a correct strategy?
Tracked devices must be associated to the APs on the same floor.
Make sure at least one AP can receive a tracked device’s signal at any location.
Make sure the tracked device can be received at a minimum signal strength of −72 dBm.
Make sure the tracked device can receive at least one AP’s signal above −72 dBm.
Foundation Topics
Defining AP Coverage
The main goal of designing a wireless network is to bring the network to the users over the air or free space. That may sound like an easy task until you begin to think about all of the variables that might be involved. A wired network removes many variables by keeping data transmission bounded inside cables of a known construction and length. If a device connects to one end of a cable with an active network device at the other end, the connection is likely to be usable. Even the data transmission rate or bandwidth is predictable by design. In contrast, wireless data is unbounded because it is transmitted over the air using radio frequency (RF) signals, with very little to keep the signals contained or unaffected by their surroundings.
A wireless network design begins with using an access point (AP) to offer a usable signal to potential client devices. What constitutes a usable signal? The signal must be present where the clients are located so that it can be received intelligibly. Also, the clients must be able to send a usable signal back to the AP so that data can flow in both directions. There are other factors, too, that will be discussed as this section progresses.
Figure 5-1 illustrates how a single AP can be used to provide wireless service over a given area. This is usually known as the AP’s cell. In 802.11 standard terms, an AP’s wireless service is known as a basic service set (BSS) and its cell as a basic service area (BSA). If a client is located inside the cell boundary, such as at location A, the client has a usable signal from the AP. If the client is outside the boundary, the signal is probably not going to be usable and the service will not be acceptable. This concept is easy to see in a drawing, but what defines the cell boundary in the first place?
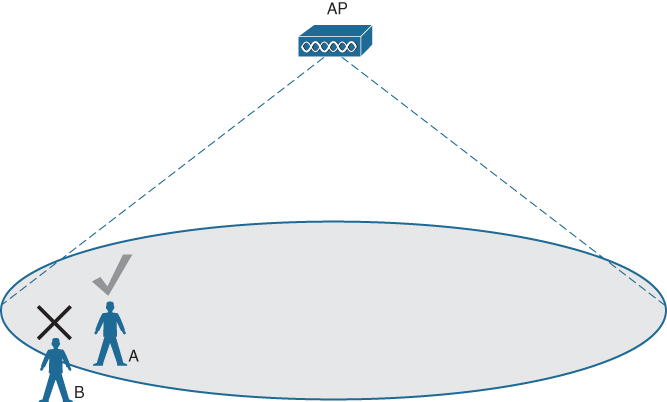
Figure 5-1 The Effective Cell Area of a Wireless AP
Tip
The cell area shown in Figure 5-1 is based on an AP with an omnidirectional antenna, which produces a more or less circular pattern at floor level. The AP cells illustrated in this chapter are perfect circles for the sake of simplicity. Actual cell patterns in the real world are rarely that uniform and vary in shape, depending on the surrounding physical objects.
Considering Receive Sensitivity
The AP’s transmit power level is a major factor in determining the usable range of its signal, defining the boundary of its cell area. Every client device has a receiver that has a sensitivity level or a threshold that divides intelligible, useful signals from unintelligible ones. As long as a signal is received with a power level that is greater than the sensitivity level, chances are that the data from the signal can be understood correctly. You might have experienced a similar scenario when you tried to hear a friend say something from a long distance away. As long as the friend spoke loudly enough, you were likely to understand every word the friend said. If you couldn’t understand everything, you were probably too far away.
Figure 5-2 shows an example of how the signal strength at a receiver might change over time, in relation to the receiver’s sensitivity level of −82 dBm. When the received signal strength indicator (RSSI) of the AP’s signal falls below −82 dBm at the client’s receiver, the AP’s signal is no longer usable.

Figure 5-2 An Example of Receiver Sensitivity Level
Therefore, an AP’s cell boundary, as shown in Figure 5-1, is actually formed by connecting all of the points around the AP where the RSSI of the AP’s signal falls to some arbitrary threshold. Even though it might seem logical to use the receiver sensitivity as the threshold, that is seldom done in practice. Instead, wireless designers usually want a more graceful transition as client devices move away from an AP and approach the cell boundary. The threshold is usually chosen with some amount of cushion or margin above the receiver sensitivity level. In addition, you might have a difficult time selecting a threshold that represents one common sensitivity level of all client devices. That is because wireless clients can be produced by a variety of manufacturers with a variety of electronic components and antennas. Even among identical devices, sensitivity levels can vary. A commonly used cell boundary is −67 dBm.
Even though wireless design concepts involve AP cell boundaries, remember that RF signals do not just stop abruptly at a certain point. The RF signal keeps propagating further and further away from the AP, while its signal strength diminishes exponentially due to free space path loss. That means the cell boundary simply marks the point where the received signal strength equals an arbitrary threshold. If you measured the RSSI at a point further away from the AP, the signal would still exist but at a lower level.
This concept is shown in Figure 5-3, where concentric circles represent the RSSI of the AP’s signal. As an example, the wireless user is standing near a point at which the AP’s signal has fallen off to around −67 dBm. Once the signal extends further, it eventually diminishes to −90 dBm and below. At that point, the signal strength is so low that it begins to blend in with the ambient noise present in the environment on the same frequency. This is known as the noise floor, where Wi-Fi client receivers can no longer discriminate between legitimate signals and signals from random noise.
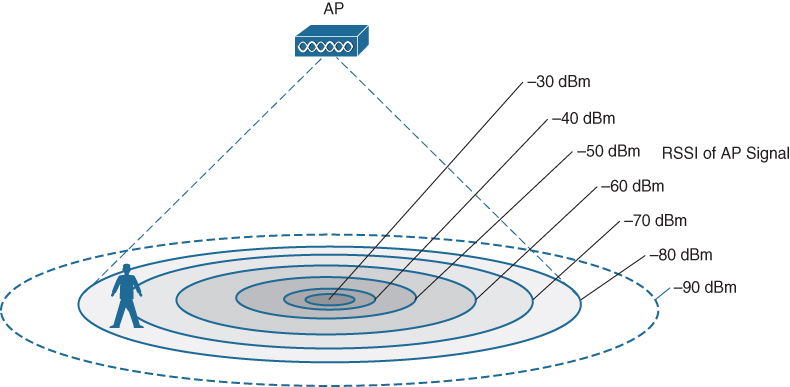
Figure 5-3 Signal Attenuation Through Free Space
It is easy to ignore noise as long as the noise floor is well below what you are trying to hear. For example, two people can whisper in a library effectively because there is very little competing noise. Those same two people would become very frustrated if they tried to whisper to each other in a crowded sports arena.
Considering the Signal-to-Noise Ratio
Receiving an RF signal is no different; its signal strength must be greater than the noise floor by a decent amount so that it can be received and understood correctly. The difference between the signal and the noise is called the signal-to-noise ratio (SNR), measured in dB. A higher SNR value is preferred.
Figure 5-4 shows the RSSI of an example signal compared with the noise floor that is received. The RSSI averages around −54 dBm. On the left side of the graph, the noise floor is −90 dBm. The resulting SNR is the difference between −54 dBm and −90 dBm, or 36 dB. Toward the right side of the graph, the noise floor gradually increases to −65 dBm, reducing the SNR to 11 dB. The signal is so close to the noise that it might not be usable for data transmission.

Figure 5-4 An Example of a Changing Noise Floor and SNR
Therefore, the SNR is also a factor that determines the usable cell boundary. Even though effective communication might be possible with a received signal that is stronger than the receiver’s sensitivity threshold, the signal strength must also be stronger than the noise by some amount. Otherwise, even a strong signal could be corrupted by the noise. The acceptable SNR ultimately determines the maximum data rate that a transmitter and a receiver can successfully use.
As a general rule, low data rates require a low minimum SNR because their modulation and coding schemes (MCS) are relatively simple and are made to tolerate noisy and error-prone environments. Higher data rates are possible with more complex MCS methods, but progressively higher SNR conditions are required. More complex MCS techniques carry data more efficiently by varying the transmitted RF signal’s amplitude and phase with higher granularity. The only way a receiver can successfully recognize and interpret the small signal variations is if the noise level is relatively low.
To get a feel for the relationship between minimum data rate and SNR, refer to the example wireless client specifications listed in Table 5-2. For simplicity, the table covers the nine MCS techniques that a transmitter and receiver can use with 802.11ac over a 20MHz channel. Because the receive sensitivity and minimum SNR values are measured at the client device, the values can vary depending on the specific device hardware capabilities. Notice that the lowest data rate (6.5Mbps) also has the lowest receive sensitivity and the lowest SNR requirements. That means a wireless client could maintain the lowest data rate as it travels far away from an AP. The highest data rate requires a much higher minimum signal strength and SNR, so a client would be limited to a closer range to the AP.
Table 5-2 Example Client Device Receive Sensitivity and SNR Specifications
Minimum Data Rate 802.11ac VHT 20MHz Channel |
Modulation and Coding Scheme |
Receive Sensitivity |
Minimum SNR |
|---|---|---|---|
6.5Mbps |
MCS0 |
−93 dBm |
7 dB |
13Mbps |
MCS1 |
−90 dBm |
10 dB |
19.5Mbps |
MCS2 |
−87 dBm |
13 dB |
26Mbps |
MCS3 |
−84 dBm |
16 dB |
39Mbps |
MCS4 |
−81 dBm |
19 dB |
52Mbps |
MCS5 |
−76 dBm |
24 dB |
58.5Mbps |
MCS6 |
−75 dBm |
25 dB |
65Mbps |
MCS7 |
−74 dBm |
26 dB |
78Mbps |
MCS8 |
−70 dBm |
30 dB |
You might be surprised to learn that the minimum SNR also increases substantially as the channel width increases. Table 5-3 lists the receive sensitivity and minimum SNR for the same example device used in Table 5-2 by increasing channel width. Notice that when the channel width doubles from 20MHz to 40MHz, the minimum SNR increases from 7 to 10 dB. Assuming the transmit power level remains constant, the noise floor must be increasing for some reason. The increase of 3 dB means that the acceptable noise floor has doubled. The same thing happens when the channel width is doubled from 40MHz to 80MHz—the noise floor doubles again.
Table 5-3 Example Client Device Receiver Sensitivity and SNR Affected by Channel Width
Channel Width 802.11ac MCS 0 |
Minimum Data Rate |
Receive Sensitivity |
Minimum SNR |
|---|---|---|---|
VHT 20MHz |
6.5Mbps |
−93 dBm |
7 dB |
VHT 40MHz |
13Mbps |
−90 dBm |
10 dB |
VHT 80MHz |
30Mbps |
−87 dBm |
13 dB |
Why would the noise floor raise just because the channel width increases? After all, the noise floor is generally ambient noise that should exist across all channels in a band. The main reason is something called thermal noise that is produced by the movement of electrons in the Wi-Fi receiver electronics. Thermal noise is proportional to temperature and bandwidth, and it is cumulative across all frequencies in the channel. In fact, the thermal noise energy doubles with each doubling of the channel width. The increase in thermal noise also causes an equal rise in receive sensitivity, as any received signal must overcome the noise to be intelligible.
As you design AP cells in a Wi-Fi network, you should design for a specific minimum data rate, which will then determine the minimum RSSI and SNR required. Consider channel width as part of the design, too. Wider channels may support more throughput, but remember that they also introduce RSSI and SNR adjustments that you must compensate for.
Further AP Cell Considerations
The data rate (and MCS method) used by a transmitting and a receiving device can vary over time. The goal is to always try to use the highest data rate possible, depending on the RF conditions between the devices. To complicate things, the transmitter, the receiver, or both might be mobile. As they move around, the SNR and RSSI conditions will likely change from one moment to the next. If the devices are located in a noisy environment, where a low SNR or a low RSSI might result, a lower data rate might be preferable. If not, a higher data rate is better.
Suppose a client device begins by using a very high data rate to communicate with an AP. If the client notices that the AP stops acknowledging some of the data sent, because the data was not received or was corrupted, it can then decide to try a lower data rate instead. The same is true of the AP as it transmits data to a client device. Each one can dynamically shift the rate up or down as needed—hence, the term dynamic rate shifting (DRS). Because the data rate can change, you should only be concerned with designing an AP cell that can support a minimum required data rate. If the conditions allow, any higher data rate can be used as a bonus.
To properly design a wireless network, you should be concerned with determining the usable area of an access point’s coverage cell. You can control the AP’s transmit power level to expand or reduce the cell size, as long as the end result produces RF coverage that supports all client devices you expect to find within that area, and any data rates above a minimum. That means you must identify the potential client device types and determine their receiver sensitivity specifications, as well as their maximum transmit power levels. As an example, the specifications for a wireless phone device state the following:
To ensure acceptable voice quality, the device should always have a signal of −67 dBm or higher when using 5GHz or 2.4GHz, while the device meets the access point’s receiver sensitivity required signal level for the transmitted data rate. A minimum SNR of 25 dB (−92 dBm noise level with −67 dBm signal level) should be maintained.
Notice that the requirements also included a statement about the client device’s signal being sufficiently strong to meet the AP’s receiver sensitivity at the desired data rate. Wireless communication is always two-way, so you must consider the AP’s signal at the client device location, as well as the client’s signal at the AP’s location. As long as both are satisfied, the two can communicate effectively.
APs and clients often have very different transmit power level capabilities, simply because APs are designed to have more powerful transmitters, better antennas, and better receivers than typical client devices. As a result, the two can end up using transmit power levels that are not identical or symmetrical in each direction. The most noticeable result is an asymmetry in the data rates used, as shown in Figure 5-5. For example, if the AP can reach a client with a strong signal and a high SNR, then the AP can use a high data rate successfully toward the client. The client, on the other hand, might reach the AP with a weaker signal and a lower SNR, resulting in a lower successful data rate.
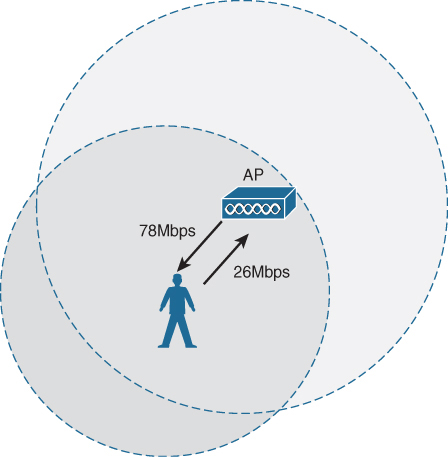
Figure 5-5 Asymmetric Transmit Power Levels and Data Rates
Sometimes a client might use a transmit power level that is higher than that of the AP. This can cause the client’s signal to extend into neighboring cells on the same channel and contribute to co-channel interference. It can also be inefficient because the client will use more of its battery power than is necessary.
Figure 5-6 illustrates an extreme and disruptive case of asymmetric transmit power levels. The transmit power level of the AP is much greater than that of the client; the client can receive and interpret the AP’s signal, but the AP cannot receive and interpret the client’s much weaker signal above the required receive sensitivity and SNR. Because the client’s transmit power level is too low, it becomes isolated from the AP.

Figure 5-6 Asymmetric Transmit Power Levels Isolating a Client
Dynamic Transmit Power Control (DTPC) is a Cisco proprietary method that APs can use to advertise their own transmit power levels so that compatible clients can adjust their transmit power levels accordingly, up to the maximum available. AP advertisements are sent in beacon and probe response frames, inside a Cisco vendor-specific information element. Clients must support Cisco Compatible Extensions (CCX) to participate in the dynamic power adjustments. DTPC is enabled by default on Cisco wireless LAN controllers (WLCs), and Cisco recommends that it always be enabled.
Tip
Be aware that DTPC is different from Transmit Power Control (TPC). DPTC is used to adjust client transmit power levels to match that of an AP. TPC is part of the 802.11h standard and is used by APs to instruct clients to lower their power levels if a radar signal is detected on a DFS channel.
The best-practice guidelines for designing any AP cell recommend setting the cell boundary at −67 dBm, as shown in Figure 5-7. That threshold will suit most client devices and will support most reasonably high data rates, provided the SNR is 25 dB or above. That also means that the noise floor is expected to be 25 dB below −67 dBm, or −92 dBm. The noise floor in most common environments meets that expectation.

Figure 5-7 Best-Practice AP Cell Boundary Conditions
Note
You should be aware that RF signals propagate differently based on their frequency. As a signal travels through free space, its signal strength will be attenuated exponentially over the distance traveled. In addition, higher frequencies are attenuated more than lower ones, through free space and through walls and objects. This difference ultimately affects AP cell sizes. Most APs have dual radios that will create two independent RF cells—one on a channel in the 2.4GHz band and another on a channel in the 5GHz band. If both radios are configured to transmit at the same power level, the effective or usable 2.4GHz cell area will be somewhat larger than the 5GHz cell.
Expanding Coverage with Additional APs
Traditionally, wireless designers have focused on simply providing RF coverage to a given area so that data can be communicated. This goal usually results in a design that has a minimal number of APs covering a maximum amount of area. It is also a goal that emphasizes connectivity to clients in all locations, rather than acceptable performance to each client.
Coverage-based designs begin by placing an AP in a location where it can cover the most area, as shown in Figure 5-8. Ideally, the AP’s transmit power level should be set to provide an appropriate coverage cell based on the guidelines presented in the previous sections. The AP must also be assigned a channel to use. It might be tempting to configure the AP to run at the highest possible transmit power level to maximize the RF cell area, but first consider the results of such a decision. Your goal should be to design the cell size based on the receive sensitivity and SNR for a desired minimum data rate, as well as the number of wireless clients to be served by the AP. If the transmit power level is set at the maximum, the −67 dBm cell boundary will likely be pushed out far away from the AP. That will maximize the area covered, which might also maximize the number of clients, if many are present within the cell area. That, in turn, may act to minimize performance for the users who are contending for airtime on the AP’s channel.
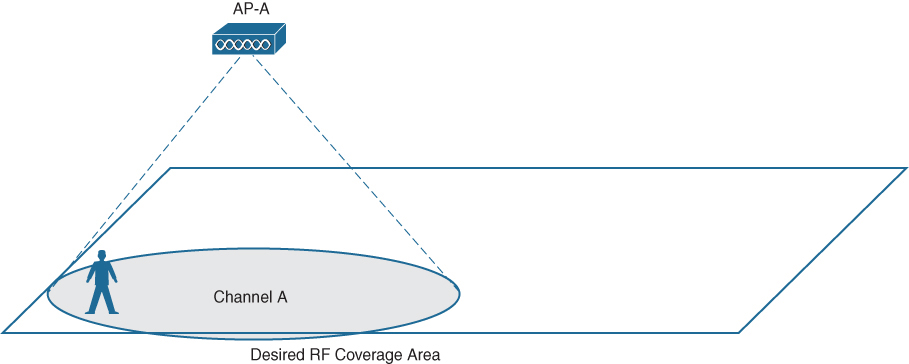
Figure 5-8 RF Coverage Design Begins with a Single AP
Running at maximum transmit power also constrains the design itself. Sometimes you may need some flexibility to raise or lower the transmit power to tune the cell size. You will not be able to raise the power level further because it is already at the maximum. Clients using DTPC to adjust their own transmit power levels may always use a high level to try and match that of the AP. That may unnecessarily lower the client runtimes on their batteries.
If one AP at the desired transmit power level does not cover the entire desired area, more APs can be added to the design as needed until the area is sufficiently covered. In Figure 5-9, a total of four APs has been used to cover the rectangular area. Notice how the AP coverage cells are slightly overlapped. As a best practice, you should always position each AP such that its cell overlaps the cells of the nearest neighboring APs by about 10 to 20 percent. The overlap is necessary to provide continuous RF coverage for wireless client devices as they roam from one AP’s cell into another, without experiencing a loss of an acceptable signal.

Figure 5-9 Additional APs Complete the RF Coverage Design
Should you worry about the cell overlap causing interference between adjacent APs? Absolutely! In a best-practice design, adjacent APs should not be configured to use the same channel. Instead, as client devices move, they should roam from one AP to another and from one channel to another. As long as you carefully select the channel numbers for each AP and try to keep identical channel numbers from touching or overlapping, you will minimize the chance for co-channel interference.
The channel layout process can become quite a difficult puzzle if your design includes many APs. The puzzle is most difficult in the 2.4GHz band because there are not many non-overlapping channels available for use. The general guideline is to stick with only channels 1, 6, and 11 and to stagger them in more or less a diamond-shaped pattern. For example, APs A through D in Figure 5-9 could be configured to use channels 1, 6, 11, and 1, respectively. Although 802.11n introduced 40MHz channel aggregation to bond two 20MHz channels together in the 2.4GHz band, it simply is not possible to have multiple 40MHz channels to assign to multiple APs without overlap. For that reason, you should always stick with the default 20MHz channel width for all 2.4GHz AP radios.
The 5GHz band is much less restrictive because all of its many 20MHz channels are considered to be non-overlapping. After all, each channel is 20MHz wide, and channels that are four channel numbers apart (the common case in most countries) are spaced 20MHz apart. For example, channels 36, 40, 44, and 48 have the proper 20MHz spacing.
Even so, a best practice is to avoid assigning adjacent channels to neighboring APs. The strongest portion of a signal on a specific 20MHz channel is designed to operate within the 20MHz bandwidth but is allowed to have a much weaker portion that extends into additional bandwidth on each side. The 802.11 standard defines a spectral mask that constrains every Wi-Fi signal, as shown in Figure 5-10. Notice how the sideband portions of signals on adjacent 20MHz channels actually do overlap each other, although at a very low signal strength. For this reason, it is best to keep neighboring APs on nonadjacent channels, where the channel numbers are at least eight apart.

Figure 5-10 802.11 Spectral Mask and Adjacent Channel Overlap
You can also aggregate 5GHz channels together to form channels that are 40, 80, and even 160MHz wide. Be aware that your choice of channel width does affect the overall number of channels that will be available for use. For example, there are up to 24 available 20MHz channels in the United States. Aggregating those into 40MHz channels leaves you with only 11 channels to assign to APs in an area. Aggregating further into 80MHz leaves only five; aggregating into 160MHz leaves only two channels in the whole band.
Of the many 20MHz channels available, do not forget that many of them are located in the U-NII-2 and U-NII-2 Extended bands, which are subject to DFS constraints. If a radar signal is detected on a DFS channel, the AP and its clients must stop using it and move to a different channel. Abandoning a channel like that can be very disruptive to wireless applications, so you should verify that no radar signals are present on any DFS channels you plan to use.
As you assign channel numbers to each AP in a design, you should also pay attention to the way channel numbers repeat or are reused throughout an area. APs using the same channel not only can interfere with each other if their cells are adjacent and touch, but they can still interfere if they are not spaced far enough apart from each other. Consider the simple example shown in Figure 5-11, where channel 40 (20MHz wide) has been assigned to AP-A and reused some distance away by AP-C. The −67 dBm cell boundaries of each are shown by dashed outlines. At their boundaries, the cells of AP-A and AP-C do not touch or overlap.
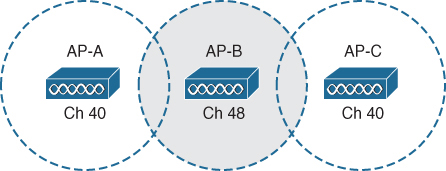
Figure 5-11 An Example of Repeating Channel Layout
It is entirely possible for AP-C’s signal to extend into the cell of AP-A, simply because the signal continues to propagate past the −67 dBm boundary, losing signal strength along the way. If the signal is still above some level inside AP-A’s cell, it could interfere with AP-A and its clients being able to use the channel. To prevent that from happening, you should follow the best-practice guideline to maintain a level of channel separation between APs sharing the same channel.
Figure 5-12 shows the scenario from Figure 5-11 with AP-B and its cell removed for clarity, as it does not impact either AP-A or AP-C on channel 40. At the −67 dBm boundary of AP-A, the signal strength from AP-C should be at least 19 dB below that of AP-A. By keeping a 19 dB level of separation, the neighboring AP’s signal strength is pushed below −67 dBm minus 19 dB, or −86 dBm. The 802.11 standard requires every device to test its channel with the clear channel assessment (CCA) mechanism to make sure the channel is clear before transmitting. CCA uses a threshold of −82 dBm; as long as signals from neighboring APs are below it, those APs will not interfere with or contend for airtime on the channel inside the −67 dBm cell boundary.

Figure 5-12 Best Practice for Channel Separation
Tip
It is often difficult to maintain the 19 dB channel separation between APs in the 2.4GHz band, simply because there are too few channels to distribute across APs. No matter how you assign channels 1, 6, and 11 to APs, you will have to reuse a channel closer to itself than desired. The 5GHz band is much less restrictive due to the large number of channels that are available.
With 23 available channels, the number of non-overlapping aggregated channels gets smaller as the channel width gets larger. For example, there are only eleven 40MHz channels, five 80MHz channels, and two 160MHz channels available.
Designing a Wireless Network for Data
In Chapter 1, “Wireless Design Requirements,” you learned about a few different AP deployment models and how to determine when to apply each model to a network design. Beginning with this section, you will learn how to apply the deployment model and specific design criteria to ensure that your wireless design meets best-practice guidelines.
Suppose you need to work up a design in an area where there are only ordinary data applications in use. In other words, there are no voice, video, or location-based applications. Also, there is no pressing need to support large user populations in the coverage areas. Your goal should be to design for wireless coverage and acceptable performance.
First, consider the data rates that the APs will offer, with an eye toward disabling lower, less efficient data rates that can starve the available airtime on a channel. Determine if the network will need to support any legacy 802.11b-only client devices. If so, disable the lowest rates of 1, 2, 5, 6, and 9Mbps, while enabling 11Mbps and all rates above it. If no legacy devices are required, a common practice is to keep 12Mbps as the minimum (and only) basic data rate, with all higher rates supported. Clients and APs will try to use higher rates if the RF conditions support it.
Note
Does disabling low data rates change an AP’s cell size? After all, lower data rates tend to be intelligible farther away from an AP than higher data rates. An AP’s signal strength stays constant, regardless of the data rates offered. A proper design should tune data rates first, and then the survey is based on the minimum required data rate. Fortunately, a threshold of −67 dBm is high enough to support most any data rate. Even though disabling lower data rates does reduce the effective or usable cell size of an AP, the cell boundary will not move enough to interfere with the design constraints.
As you perform a survey, try to keep the AP power reduced to half that of the maximum transmit power you expect to find in any client. This will provide a margin or buffer that you can leverage if you need to adjust any AP transmit power levels, while staying within the capabilities of most client devices. This is also helpful if you plan to use Cisco Radio Resource Manager (RRM) to automatically and dynamically make AP power level adjustments.
Make sure your survey considers both signal strength and SNR throughout the coverage area. Be aware that RSSI is a relative measurement that can vary from one device to another. This is especially important if your survey device is not identical to any of the expected client devices. You should compare the RSSI reported by the survey device with values reported by actual client devices at the same location. Then you can adjust your survey measurements to reflect client devices accordingly.
Strive to have AP cell coverage extend to −67 dBm at the lowest data rate enabled. As a frame of reference, a signal strength of −85 dBm or below is considered poor and unlikely to sustain a client association; anything −55 dBm or greater is exceptional. The usable data rate is always determined by the device’s receiver sensitivity, which is a function of RSSI and SNR.
You should also consider padding the minimum receive sensitivity threshold by 10 dB and the SNR by 10 dB to compensate for variations between devices and normal changes in the RF environment. A 10 percent packet loss is acceptable for a data-only design.
Designing a Wireless Network for High Density
A design based on RF coverage focuses on defining and maximizing the effective AP cell size for an area, based on any one client device. In other words, the main criteria is if a wireless client can see coverage and join the wireless network wherever it might be located within the coverage area, as shown in the left portion of Figure 5-13. What might happen if more and more users arrive and gather in a relatively small area, perhaps within the cell area of a single AP? They will all have to compete for the available airtime because they all share the same channel that is hosted by the basic service set (BSS) of the AP. In addition, they will all have to share the available bandwidth through the AP and its wired connection to the network infrastructure, as shown in the right portion of Figure 5-13.
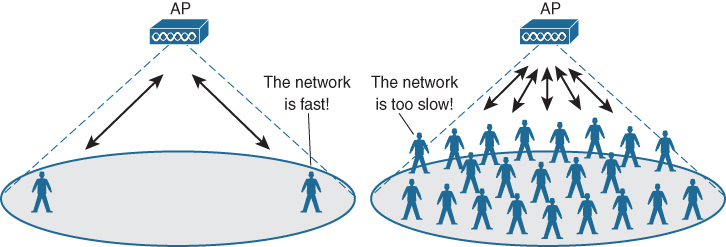
Figure 5-13 Coverage Design as Planned (left) and with a High Density of Users (right)
The best way to provide better wireless performance to a high density of users is to distribute those users across multiple APs and channels. That approach requires careful planning and a design that utilizes additional APs to cover the area. However, rather than adding APs that each cover a large area, each AP’s cell size must be reduced to include only a desired number of users or a very small area.
This is straightforward to visualize in an area with dense, fixed seating. Figure 5-14 shows an example of a large auditorium-style classroom. A traditional RF coverage design has placed only two APs in the room, as shown. If the classroom is full, each AP might have 150 or more users associated and competing for airtime on the channel.

Figure 5-14 A High Density of Users in an RF Design Based on Coverage
Figure 5-15 illustrates a better approach that considers the high client density in the room. Notice how much smaller each AP cell is in comparison with the cells from Figure 5-14. This time if the room is full of people, each AP might carry around 25 associated clients. With the client load greatly reduced, each AP’s channel will be much less utilized, giving users a greater chance to access the medium and have a better network experience.
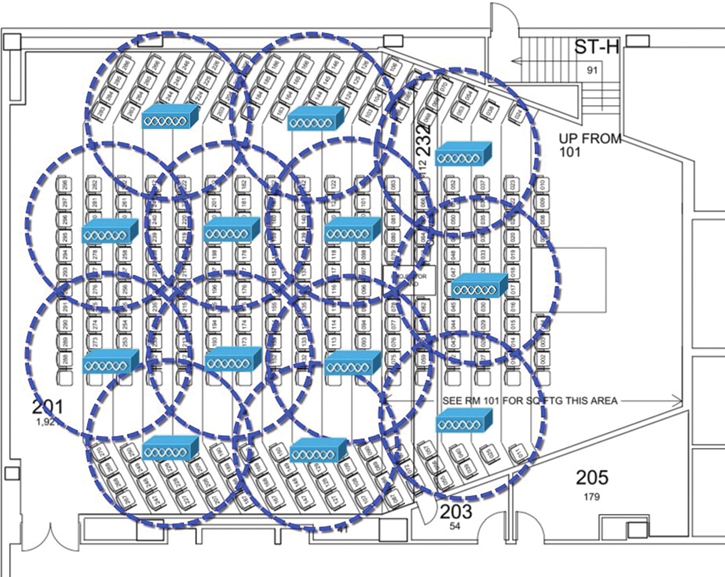
Figure 5-15 A High Density of Users in a High-Density RF Design
Areas with high user densities, such as theaters, auditoriums, and classrooms, are easy to predict because of their high-density seating. Buildings with fixed or modular office space usually have a lower user density because of their layout and seating arrangements. Open areas such as lobbies, retail space, and airport terminals have less obvious seating and standing arrangements, so you might have to observe them at different times to gauge the user density. Beyond user density, you should also consider that the average user carries several different wireless devices. Though users might not be actively using all of their devices at the same time, all of them may stay associated to the wireless network but have little traffic demands.
Drawing smaller circles on a floor plan is an easy task because it does not involve live APs and a real physical environment. How can you reduce the cell size of an AP that is actually mounted in one of the locations you designate? You can take the following two actions to tune the cell size appropriately:
Limit the AP’s transmit power level.
Select an appropriate antenna for the AP.
Each of these actions is described further in the sections that follow. As you read through the remainder of the chapter, think about the overall strategy of setting and adjusting AP parameters to support a dynamic user population. These are processes you can work through manually during a wireless design, which are effective only when you use the data provided by the site surveys described in Chapter 2, “Conducting an Offsite Site Survey,” and Chapter 3, “Conducting an Onsite Site Survey.” Controlling transmit power and assigning channels are complex puzzles to solve during a wireless design. Chapter 6, “Designing Radio Management,” goes even further by explaining how the puzzle can be refined and tuned automatically.
Once you have identified areas where a high density of clients is expected, your design goal should be to tailor the wireless coverage to support client capacity. Size up the bandwidth requirements for each user and then multiply by the number of users you want to support on each AP. That will give you an estimate of the total bandwidth requirements expected through each AP.
Locate each AP and adhere to the guidelines from the previous section to size each cell such that it will limit the number of users appropriately. You will also need to focus on making the small AP cells as efficient as possible. Keep 12Mbps as the only mandatory data rate, while disabling every data rate below it. Every data rate above 12Mbps should be configured as a supported rate. The higher data rates will improve channel contention and overall efficiency to support more clients and their applications.
You should focus on leveraging the 5GHz band in high-density areas, making sure that AP channels are non-overlapping. You will need to take advantage of using more channels within a small dense area. AP cells should have 10–15 percent overlap. Leverage DTPC to automatically influence the transmit power levels of compatible clients.
Limiting the Transmit Power Level
Recall that an AP’s signal strength gets exponentially lower as the signal travels away from the AP. If the transmit power level is configured to a lower value, that lower signal strength will get even lower away from the AP. Therefore, you can control the AP’s cell size to a certain extent by lowering the transmit power level. Figure 5-16 illustrates this concept by showing the relative cell size bounded by an RSSI of −67 dBm at decreasing transmit power levels of 20, 14, 8, and 2 dBm.

Figure 5-16 Lowering an AP’s Transmit Power Level Decreases Its Cell Size
Cisco access points have at most eight transmit power level values, beginning with the maximum power allowed for the band in use, with each successive value decreasing the power level by about 3 dB or half. Even at the lowest power level setting, the cell size still might not be small enough to match your design goal—especially if you are using an AP model with integrated omnidirectional antennas. Recall that an omnidirectional antenna emits the RF energy more or less equally in all directions. Because the energy is not focused in any particular direction, coverage over a wide area is by design. When such an AP is mounted on the ceiling, most of the RF energy propagates out away from the AP to form a shape similar to a donut or torus.
Leveraging APs and Antennas
You can tailor the cell size even further by using an AP model that is connected to an external antenna. Patch antennas are directional in nature and focus the RF energy toward a single direction. This means you can cover a small area by mounting a patch antenna on the ceiling above that area. The antenna’s directional focus gives it a higher gain and the AP a smaller cell size. Patch antennas are available in various gain values and beam widths. Figure 5-17 illustrates a comparison between an AP with integrated omnidirectional antennas and 5 dBi gain, an AP connected to an external patch antenna with 7 dBi gain, and an AP with an external patch antenna with 11 dBi gain. Assume that each AP is transmitting at the same power level and then notice that as the gain increases, the angle of the antennas’ beam decreases and the AP cell size also decreases.

Figure 5-17 The Effects of Antenna Gain on AP Cell Size
Therefore, you could leverage APs with patch antennas in a crowded classroom or auditorium to produce a matrix of very small cells. This approach would reduce the number of users in each AP’s cell, lower contention for opportunities to transmit over the AP’s channel, and maximize the users’ experience over the network.
Cisco also offers some AP models that support an extra radio that can be used to complement the RF coverage of the traditional dual-band radios. This feature is called Flexible Radio Architecture (FRA) and includes one dedicated 5GHz radio and one flexible radio that can operate on either 2.4 or 5GHz, but not both. The dedicated 5GHz radio has internal omnidirectional antennas and forms a normal “macro” cell with a broad coverage pattern. When the flexible radio is operating on the 2.4GHz band, it also produces a macro cell.
When the flexible radio is operating on 5GHz instead, its internal antennas have a narrow beam width and form a relatively smaller “micro” cell, as shown in the left portion of Figure 5-18. This is known as macro/micro mode, with the flexible radio micro cell operating at the lowest transmit power level. The end result is two 5GHz cells, in a “cell within a cell” pattern, with each radio operating on a different channel. With one access point, you can address normal RF coverage over an area and overlay a smaller cell to distribute the user load in an area that has a high density of users. Alternatively, the flexible radio can be connected to an external antenna, as in the right portion of Figure 5-18, such that both 5GHz radios provide independent macro-sized cells in roughly the same area. This is known as macro/macro mode. Again, with one AP and one external antenna, you can distribute a high density of users across two cells and two different channels.

Figure 5-18 Leveraging Flexible Radio Assignment to Offer High-Density Coverage
Note
In the macro/micro FRA mode, both the fixed macro radio and the flexible micro radio operate on 5GHz channels. This means that the AP has no active radio operating on 2.4GHz. How then can you provide 2.4GHz coverage if you need it? Usually you do not need every AP to provide a 2.4GHz channel in a high-density capacity design, simply because the APs will be spaced closely together. You have only three non-overlapping channels to work with in the 2.4GHz band; if the APs are close together, their signals might extend far enough to overlap other APs using the same channels, causing co-channel interference. Instead, you can usually disable the 2.4GHz radios in most of the APs and get useful coverage from a few nearby APs that can offer 2.4GHz channels.
You should also be aware that the ceiling height where an AP or a patch antenna is mounted affects the resulting cell size toward the floor where users are located. Figure 5-19 shows a comparison between an antenna that is mounted 8 feet above the floor with the same antenna model that is mounted 10 feet above the floor. Assume that the antenna gain and the transmit power levels stay the same in both scenarios. The higher an antenna is mounted, the larger its footprint will be projected onto the floor. This concept becomes important in high-density areas with very high ceiling height. In those cases, you might need higher gain antennas to maintain a small AP cell area.

Figure 5-19 The Effects of Antenna Mounting Height on AP Cell Size
Designing a Wireless Network for Voice and Video
At this point in the chapter, it should be obvious that a good wireless design hinges on providing RF coverage in the locations where it is needed or expected. By clever placement and careful tuning, you can make the network even more usable for greater numbers of users. In addition to considering the physical environment, you should also look at the applications and the traffic types that will be used over the wireless network.
Most devices will make use of “normal” data that has no special requirements or expectations other than what the users consider to be decent responsive throughput. If the application must send and receive data in a timely manner, it is known as a real-time application. Examples include voice over IP (VoIP), videoconferencing, and collaboration. You might have noticed a pattern—real-time applications involve voice and video; non-real-time applications include ordinary data. Real-time applications require special consideration as you design, configure, and operate a wireless network. The following effects need to be minimized so that voice and video sessions can be heard and seen consistently, without interruption or corruption:
Latency: The amount of time required to deliver a packet or frame from a transmitter to a receiver
Jitter: The variance of the end-to-end latency experienced as consecutive packets arrive at a receiver
Packet loss: The percentage of packets sent that do not arrive at the receiver
To keep these factors minimized, the adverse conditions in a wireless environment must be controlled. For example, a source of interference can cause packet errors that interrupt a voice or video stream. As packets are lost, they can be retransmitted and delayed, increasing latency and jitter. Other factors like poor radio frequency (RF) coverage, high channel utilization, and excessive collisions can also impede good data throughput and integrity.
When you need an AP deployment that supports voice and video, your goal should be to design for wireless coverage and call capacity. AP cells should be overlapped by about 20 percent to streamline client roaming and handoff from one AP to another. Any delay or interruption will be very noticeable to users on an active call, so devices should be able to find candidate APs well ahead of time as the users move around. As the previous sections recommended, the RSSI of each AP should be −67 dBm or higher at the boundary of its cell, and the SNR should be 25 dB or greater. When you perform an active site survey to validate the network’s performance, packet loss or the packet error rate (PER) should be no greater than about 1 percent.
As you plan the band and channel assignment for each AP, try to leverage the 5GHz band as much as possible. There are more non-overlapping channels there and much less chance of interference from non-Wi-Fi devices. A common practice is to use the U-NII-1 and U-NII-3 channels, while avoiding U-NII-2 and U-NII-2 Extended channels because of DFS requirements. If a radar signal is detected by an AP using a DFS channel, the AP and its clients must abandon the channel and move elsewhere. Such an event is very disruptive to voice and video sessions. You should consider using the DFS channels only if there is no detectable radar activity.
Dynamic rate shifting (DRS) and roaming events can also affect real-time applications. For example, when a mobile client or AP decides that it is time to shift to a lower data rate, it must have detected some problems with the higher data rate. Those problems usually include retransmissions due to a low RSSI or low SNR. This means that many wireless frames during the voice or video connection were likely lost before the condition can be improved with a rate shift. Careful AP layout, cell overlap, and data rate tuning can help mitigate DRS disruptions.
Likewise, when a wireless client decides that it is time to roam from one AP to another, it must take time to find a viable AP to roam toward. The client might also need to exchange credentials with the new AP, taking more time away from the voice or video data stream. To minimize those disruptive events, you should look to leverage 802.11 features such as 802.11r, k, and v that streamline roaming and authentication.
Your design should address efficiency within AP cells. Lower data rates require more time to transmit a frame, so the channel stays busy longer. A better approach is to limit transmissions to use higher data rates so that stations transmit a frame and get off the air sooner, allowing other stations an opportunity to use the channel. That ultimately affects latency and jitter—parameters that are critical for acceptable voice and video performance. You should configure 12Mbps as the lowest and only mandatory data rate, while disabling all rates below that. All data rates greater than 12Mbps should be configured as supported so that they can be used by any device and application as RF conditions permit.
An effective design should take call capacity into account. For example, voice calls use bidirectional RTP streams to transport audio. Each call uses two separate streams, but they cannot be transmitted simultaneously because of channel contention. At a 24Mbps data rate, up to 27 simultaneous bidirectional RTP streams can exist, or up to 13 calls. A 6Mbps data rate can support only 13 streams or 6 calls. Therefore, the maximum number of calls depends on the data rate used, as well as the channel utilization.
Designing a Wireless Network for Location
Sometimes real-time location services (RTLS) are needed to automatically determine the location of wireless devices. RTLS can be used to track assets like healthcare equipment, to track rogue devices that might be causing problems on the network, to locate sources of wireless interference, and to track the locations of wireless clients within a building or campus. A device is located by triangulating the RSSI from several APs that can receive its signal.
If location-based services are required, your design goal should be to provide good RF coverage and an effective AP layout. APs should be positioned such that multiple APs can receive a signal from a device to be located. A minimum of three APs should be able to receive a client’s signal, while four or more APs are preferred. You should think of every possible client location having at least one AP in each surrounding quadrant.
To derive a fairly accurate location, multiple APs must receive the client device or tag at an RSSI above a minimum signal level of −75 dBm. When you perform a site survey, you should use a threshold of −72 dBm, which will give a 3 dB buffer over the absolute minimum.
To minimize location computation errors, all of the receiving APs should not be located too close to the target client device. However, at least one AP should be within 70 feet of the client location. AP antennas should not be mounted too high above client locations. Otherwise, the client signals may be weak at the receiving AP, causing the client to appear to be located much farther away than it actually is. Ideally, omnidirectional antennas should be mounted around 10 feet high, while directional antennas can be mounted somewhat higher.
Keep in mind that the traffic necessary to locate devices essentially moves in one direction— from the device to any APs that are within range. When a wireless device is probing or already associated to an AP, it is obvious that the device must be near that AP. However, that does not give an accurate assessment of its location. Instead, any APs that receive management frames such as probe requests from the device measure its RSSI and report this information upstream to a wireless management platform, where the device’s location is computed. Some normal wireless devices will be quite active on the network, while others like location tags will sleep most of the time and periodically wake up to send a probe request and announce their location.
Location-based applications do not add any requirements for wireless efficiency. Instead, the emphasis is on placing APs to maximize the accuracy of the location algorithms. To do that, you should locate the APs in a staggered fashion within a floor of a building, separating the APs in two directions rather than locating them along straight lines. The main idea is to have a minimum of three APs pick up the device’s signal in any arbitrary location. The outermost APs should be placed near the perimeter of the building to improve the computed results when devices are located near the outer walls.
Summary
This chapter described the main considerations needed to apply design requirements to specific wireless network environments. More precisely, you have learned the following:
How AP coverage can be determined and planned
How wireless coverage can be scaled by adding and configuring more APs appropriately
How scenarios requiring generic data transport can be addressed
How environments with a high density of wireless clients can be effectively supported
How voice and video applications require special treatment in a wireless network
How a wireless network can support real-time location services
Exam Preparation Tasks
As mentioned in the section “How to Use This Book” in the Introduction, you have a few choices for exam preparation: the exercises here, Chapter 18, “Final Preparation,” and the exam simulation questions in the Pearson Test Prep Software Online.
Review All Key Topics
Review the most important topics in this chapter, noted with the Key Topic icon in the outer margin of the page. Table 5-4 lists these key topics and the page numbers on which each is found.
Table 5-4 Key Topics for Chapter 5
Key Topic Element |
Description |
Page Number |
|---|---|---|
Receiver sensitivity level |
88 |
|
Noise floor and SNR |
90 |
|
Best-practice AP cell boundary conditions |
94 |
|
Best practice for channel separation between neighboring APs |
98 |
|
Coverage design |
100 |
|
An example of high-density RF design |
101 |
|
List |
Actions for tuning AP cell size |
101 |
Adjusting AP cell size with antenna gain |
103 |
|
Flexible radio assignment |
104 |
|
List |
Parameters affecting real-time applications |
106 |
Define Key Terms
Define the following key terms from this chapter and check your answers in the glossary:
asymmetric transmit power levels