
Chapter 16
Monitoring and Troubleshooting WLAN Components
This chapter discusses the following topics:
Using Reports on Cisco Prime Infrastructure and DNAC: This section discusses how reports are managed on Cisco PI and DNAC and how you can better understand both your network current state and projected future state by using reports.
Managing Alarms on Cisco Prime Infrastructure and DNAC: This section gives you the tools you need to manage alarms on Cisco PI and DNAC and also to manage rogue clients and APs.
Troubleshooting Client Connectivity: This section helps you troubleshoot client issues, by first providing a method and then pointing to the tools at your disposal to determine the root cause of the client problem.
Troubleshooting and Managing RF Interferences: This section expands troubleshooting to the RF side of your network and helps you assess the effect of non-802.11 interferers on your network efficiency.
This chapter covers the following ENWLSI exam topics:
7.1 Utilize reports on PI and Cisco DNAC
7.2 Manage alarms and rogues (APs and clients)
7.2.a WLC
7.2.b PI
7.2.c Cisco DNAC
7.3 Manage RF interferers
7.3.a WLC
7.3.b PI
7.3.c DNAC
7.4 Troubleshoot client connectivity
7.4.a WLC
7.4.b ISE
7.4.c PI
7.4.d DNAC
Once your network has been deployed, you enter what network lifecycle specialists call the monitoring phase. In this phase, you need to evaluate the state of your network to validate its performance levels as well as solve issues ranging from unexpected effects of device configuration changes to client troubleshooting tickets or physical changes (a new wall added, a broken cable, and so on). You also must predict the future changes needed to adapt your network to utilization trends.
These responsibilities cover a vast set of tasks and skills that the CCNP exam will test. An easy way to address these various functions is to separate them into two different functional requirements: monitoring the network, including evaluating its performances and understanding the main trends, and troubleshooting issues, including addressing client problems and the effect of interferers.
Therefore, this chapter starts with reports. On Cisco Prime Infrastructure (PI), reports are a great way of selectively observing key metrics relevant to your network operations. As reports can be run for long periods of time (lasting several months), they can also help you understand trends that, in turn, will help you predict the likely changes needed to your network as it continues to evolve. Moving from Cisco PI to DNAC offers an interesting perspective, because DNAC continuously produces reports, and you can select from their outcomes the elements that should attract your attention.
These elements can be thought of as alarms, which will be the object of our second section. DNAC surfaces elements that affect the performance of your networks, and you need to understand their various levels and categories. On Cisco PI, alarms also match different criticality levels. However, the severity is seen in the event itself, not in the way the event affects your network. Therefore, you may need to refine the way Cisco PI reports events, so as to only concentrate on impactful issues. Out of all issues, rogue APs and clients are central to your RF environment and will be covered in detail in this chapter.
The third section of this chapter focuses on troubleshooting client issues. This activity is, of course, central to your network management. The WLC, Cisco PI, and DNAC record all connection transactions and provide you with all the information you need to understand what affects your clients.
The last section of this chapter focuses on a particular type of issue—that caused by RF interferers. Although their effect on your cells is not very different from any other RF issue, the way they are detected depends on the type of APs you have deployed, so you need to know both the vocabulary and the management process.
“Do I Know This Already?” Quiz
The “Do I Know This Already?” quiz allows you to assess whether you should read this entire chapter thoroughly or jump to the “Exam Preparation Tasks” section. If you are in doubt about your answers to these questions or your own assessment of your knowledge of the topics, read the entire chapter. Table 16-1 lists the major headings in this chapter and their corresponding “Do I Know This Already?” quiz questions. You can find the answers in Appendix D, “Answers to the ‘Do I Know This Already?’ Quizzes and Review Questions.”
Table 16-1 “Do I Know This Already?” Section-to-Question Mapping
Foundation Topics Section |
Questions |
|---|---|
Using Reports on Cisco Prime Infrastructure and DNAC |
1, 2 |
Managing Alarms on Cisco Prime Infrastructure and DNAC |
3, 4 |
Troubleshooting Client Connectivity |
5, 6 |
Troubleshooting and Managing RF Interferences |
7, 8 |
1. Which of the following best describes a trend report on Cisco Prime Infrastructure?
A projection of AP loads for the next 6 months
An aggregated report of your client protocols over the last 6 months
A report on new AP types adopted by other Cisco customers
A Machine Learning–produced analysis of your network performance
2. You want to configure a new report on your AP loads over the last week from DNAC. Where should you go to configure such report?
Manage > Network > Reports
Settings > Performances > Reports
Dashboards > Health > Network Health
Dashboards > Performance > Network
3. A network associate reports that a rogue was detected at the edge of your network, in one of your multitenant buildings. The associate asks what action should be taken. What would be the best answer?
Set the rogue to Contain on the WLC or Cisco PI.
Set the rogue to Smart Containment on DNAC.
Immediately alert the building security.
Do nothing for now and spend more time evaluating the rogue.
4. Why is a rogue client something you would want to get alarms about?
Because the fact that one of your clients has decided to leave your network for an AP you do not manage is suspicious
Because a rogue client is sending invalid frames to your network and is a likely sign of an ongoing attack
Because a rogue client offers AP service, which is not normal when a wireless infrastructure is available
Because a rogue client establishes direct communication with other clients, thus avoiding the infrastructure, which is suspicious
5. In what state will your WLC CLI report a client with a static IP address that just completed L2 authentication?
Run
Authcheck complete
DHCP_fail
DHCP_reqd
6. Under what conditions will a WLC report a Client Scan report for a client?
If the client is Apple iOS or Samsung and sent an 802.11k report
If the client is CCX and sent a Channel Scan report
If you clicked the “test connectivity” button on the client 360 page
If neighboring APs detected the client before or during the association phase
7. A junior associate wants to use the C9800 Packet Capture function to collect and analyze the 802.11 management frames sent by a particular client. What would you tell the junior associate?
This is the correct function, and you can configure it to only report management frames (no data frames) to limit the capture volume.
This is a waste of time, as clients do not send management frames (management is an AP function).
This is the wrong function, as it will only capture wired frames.
The Packet Capture function only collects management frames if the capture is set to “headers only.”
8. Your network uses C1800 APs with Spectrum Intelligence. The network uses a C9800 WLC with default settings. A junior associate complains that the sporadic keepalives sent an inverted waveform by an industrial sensor are not reported. What can you tell the junior associate?
SI does not detect inverted waveform signals.
By default, CleanAir is not enabled on C9800.
The C1800 will only report an interference if it affects the AP radio performance.
CleanAir does not report keepalives because they are short-lived.
Foundation Topics
Using Reports on Cisco Prime Infrastructure and DNAC
The network lifecycle is often summarized using the acronym PPDIOO: Prepare, Plan, Design, Implement, Operate, Optimize (then back to Prepare, for the next phase). The logic behind this cyclic structure is that network deployments are never a one-time effort. A network is like a living organism. Once implemented, your network needs to be maintained, which includes several complementary tasks:
Monitoring the network: This is done to verify that it performs at its expected level. This task includes observing load levels (client counts, interface counters, and other volume-related metrics).
Evaluating reported issues: These issues can be surfaced by customers raising support tickets or by automated mechanisms triggering messages. A key element for this task is to determine if an issue relates to a temporal event, relates to a particular device or user, or if the issue is representative of a deep, more systematic aspect of your deployment.
Troubleshooting discrete issues: Temporal issues that pertain to a small number of devices need to be addressed to maintain the network quality. Usually, the remedy includes partial configuration changes (on the client or on the network).
Preparing for network evolution: Issues that appear to be systematic will require deeper changes to your network, including moving, removing, or adding APs, switches, controllers, and so on. At the same time, your client population is also likely to change over time with increased or decreased density in some areas, changes in the way people work or use the network, new devices, and new technologies (for example, Wi-Fi 6, then Wi-Fi 7, and so on.)
The “monitoring” and “preparing” elements are closely related. Although the presence of new technologies may easily be noticed (for example, by reading the specifications of new clients introduced in your network), its impact on your network is often difficult to evaluate. Similarly, changes in density of work behavior are sometimes associated with vast and visible organizational changes but are also often the result of multiple small changes that are hard to track. However, as a networking professional, it is your responsibility to foresee the need for deep network changes before they manifest as the result of massive network outages. Therefore, one of your first tasks after deployment is to take the pulse of your network at regular intervals. In most cases, this job means collecting information from your networking devices, measuring their activity and changes over time. This task is so critical that most network management platforms include report functions that are highly configurable. In a Cisco network, both Cisco Prime Infrastructure (PI) and DNA Center include such reports.
In many networks, Cisco PI is already present as a tool to manage and monitor the network. DNA Center is more recent and might not be available in your network. Because Cisco PI is a well-established tool, you should know its main functions. Because DNA Center is where many new functions are developed, such as issue root cause analysis and network trend prediction through machine learning, you should make sure to be familiar with this tool as well. As DNA Center becomes more common, the reliance on Cisco PI is likely to slowly be reduced, and there will come a time when you will only need to master a single tool. Until then, being familiar with both is required to successfully pass the professional-level exams.
Reports on Cisco Prime Infrastructure
Cisco PI offers more than 120 different report types that can be generated to run on an immediate or scheduled basis. Each report type has a number of user-defined criteria to aid in the defining of the reports. You can use the predefined criteria directly, or you can customize the report to add specific parameters. The reports are formatted in summary, tabular, or graphical layout. When defined, the reports can be saved for future diagnostic use or scheduled to run on a regular basis. Reports are saved in either CSV or PDF format and are either saved to a file on Cisco PI for later download or sent to a specific email address.
The reporting types include the following:
Current: Provides a snapshot of the data from the last polling cycle without continuously polling. This type or report is useful to understand the current state of your network.
Historical: Retrieves data from the device periodically and stores it in the Cisco PI database. This type of report is very valuable in understanding what happened in your network.
Trend: Generates a report using aggregated data. Data can be periodically collected based on devices at user-defined intervals, and a schedule can be established for report generation.
You would use the historical reports to analyze how events or activities in the building correlated with network counter changes. You would use the trend reports to evaluate what deeper changes in network activity mean for the future of your deployment.
With Cisco PI, you also have the ability to export any report that you can view, sort reports into logical groups, and archive reports for long-term storage.
Report Types
Although you do not need to learn by heart the details of each individual report, you should know the general report families and structure. All reports can be accessed from the main menu icon in the upper-right part of Cisco PI window or by choosing Reports > Report Launch Pad. Thirteen different report families are available, as illustrated in Figures 16-1 and 16-2 and detailed in the following list:

Figure 16-1 Cisco Prime Infrastructure Report Launch Pad (Upper Part)
Autonomous APs: Because these APs are not connected to any WLC, you cannot monitor them centrally. This type of report allows you to collect information on autonomous APs’ uptime, memory and CPU utilization, radio channel, power, and utilization. You can also get detailed information on which of these APs is busiest.
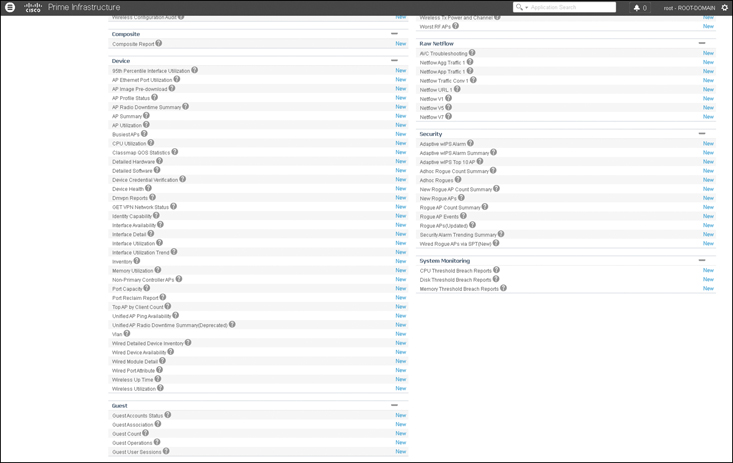
Figure 16-2 Cisco Prime Infrastructure Report Launch Pad (Lower Part)
CleanAir: RF interferers may be transient and difficult to detect. With this family of reports, you can monitor air quality over time as well as check which APs are most affected by interferers, which detected interferers are most impactful to your network, and which of them provide the highest security risk to your clients.
Client: Clients are obviously at the heart of your network, and this category includes many reports. You can get a client count per protocol (802.11a/b/g/n/ac/ax), per SSID, or per AP as well as measure their traffic volume and throughput over time or per session and monitor dormant clients (clients that became idle beyond the SSID session timeout). You can also measure more specific items, such as real-time voice or video performance indicators (called Traffic Stream Metrics, which are collected by the AP to measure the frame delays to and from voice or video clients), observe client posture (clients whose access to the network is conditioned by complying with configuration or parameter sets enforced by a posture server). You can also get more detailed information from clients that implement Cisco Compatible Extensions (CCX, a set of proprietary parameters that provides additional exchange capabilities to supporting clients).
Compliance: Compliance is critical if your network includes a publicly accessible area where payment is being processed. You may need to comply with the Payment Card Industry (PCI) Data Security Standard (DSS), which includes several requirements for wireless networks. From the compliance menu, you can run a compliance audit. Beyond PCI, this family of reports allows you to check your wireless network configuration for security weaknesses (insecure protocols and such) and also verify what configuration changes have been made on your network and whether these changes result in inconsistent configurations between network elements.
Composite: Because you might need some elements found in different reports, you can create a composite report, built from subsections of other report types.
Device: “Device” is a generic term. Here, it is understood to mean a networking device, like an AP or WLC. Here, you can monitor radio or Ethernet interfaces and their associated counters, such as status over time, traffic volume, utilization, client count, and memory or CPU utilization. You can also monitor the devices more globally, checking their status, uptime/downtime, software image, or hardware versions. For APs, you can also review the WLCs they have been associated to over time.
Guest: Guests are defined as clients that connect to WebAuth WLANs. You can monitor guest session count, duration per SSID, and volume of traffic exchanged, but you can also monitor the guest-related activity on Cisco PI, like the list of accounts created, deleted, or modified and the identity of the account creators, along with the Wi-Fi activity of these accounts (session start/end time and SSID).
Mesh: Mesh networks have specific constraints, as mesh APs (MAPs) need to use their radio as a backhaul link to connect to root APs (RAPs) that provide the wired connectivity toward the WLC. The MAPs automatically select the best path to the RAP through a series of other MAPs (called parents). You can monitor MAPs changing parents, statistics on the AP radio links (like SNR, hop count to the RAP, traffic volume, and errors), details of the mesh tree (like parent and AP count), observe the traffic over the entire mesh tree, or pay particular attention to APs that failed to reach a RAP (stranded APs) or those that can only reach a RAP through a poor backhaul connection (worse nodes).
Network Summary: This section contains two types of reports. At the bottom, the Wireless Network Executive summary provides a view of the number of APs, WLCs, and MSEs, along with their status (associated or not), a short view of client count and volume, and a summarized snapshot of the RF network operating conditions (air quality, utilization, client count, and percentage per protocol). From the top part of the Network Summary section, you can run legacy reports about the 802.11n client statistics and about clients that made specific SIP calls. These last two reports are present for backward-compatibility purposes.
Performance: Just like Client and Device, this segment is critical for your network management. You can look at the network performance of your devices (802.11 counters, RF quality, traffic volume, application types and flows, coverage gaps, interface performances, and utilization) but also focus on specific performance aspects, such as interface errors, temperatures, threshold violations, and voice and video statistics.
Raw NetFlow: NetFlow is a network protocol developed by Cisco for collecting IP traffic information and monitoring network traffic. Using a NetFlow collector and analyzer, you can see where network traffic is coming from and going to and how much traffic is being generated. Here, you can create NetFlow tests using IP addresses or Fully Qualified Domain Names (FQDN), let them run, and then collect reports on their observed performance. NetFlow has undergone multiple enhancements over time, and some of your network devices may support NetFlow v7, v5, or the older v1.
Security: Beyond a summary of security alarms raised by Cisco PI, security reports are primarily about rogue APs or peer-to-peer (ad hoc) networks. You can monitor their count over time and their detection times, and you can review which APs detect the most rogues. If you implement WIPS in MSE, you can also get reports on WIPS activity. Last, you can monitor wired rogues, if you have configured rules to monitor over the wire any rogue MAC addresses detected over the air.
System Monitoring: “System” in this context represents your network objects, such as APs, WLCs, and switches. You can create specific reports to monitor their CPU, memory, and disk threshold breaches.
Scheduling and Managing Reports
From the Report Launch Pad, all report types are listed. For each type, you can click New to directly configure a new report. If you are unsure of a report function or features, you can use the Verbose icon to obtain more information about the report.
Clicking the Report Type heading in the left menu opens a new page, listing all reports of this type that are available or have been configured on Cisco PI.
Click each report to edit its settings. You can also enable or disable scheduling or run the report immediately. You can also delete a report using the Delete button. If you want to run the report at a later time or on a recurring basis, you will need to schedule it. The procedure to schedule a report configuration is the same for all reports. To schedule a report, use the following procedure:
Step 1. Each report has a Settings and Schedule side of the screen, as illustrated in Figure 16-3. On the Schedule side, check the Enable check box.

Figure 16-3 Configuring Cisco PI Reports
Step 2. Specify the export format to be either .csv (a file containing the MAC addresses of access points) or .pdf from the Export Format drop-down menu.
Step 3. Choose either the File or Email option as the Destination type.
Step 4. If you select the File option, a destination path must first be defined at the Administration > Settings > Report page. Enter the destination path for the files in the Repository Path field.
Step 5. If you select the Email option, an SMTP mail server must be defined prior to entry of the target email address. Go to Administrator > Settings > Mail Server to enter the appropriate information.
Step 6. Enter a start date/time (MM:DD:YYYY format) in the provided field or click the calendar icon to select a date. The report begins running on this date.
Step 7. Click one of the Recurrence buttons to select how often the report is run.
Step 8. When entry is complete, do one of the following:
Click Run if you want to run the report immediately and review the results in the Cisco PI window. The report runs regardless of any scheduled time associated with the report.
Click Save to simply save the entry.
Click Run and Save to save the changes and run the report now. The report is run, and the results are either emailed or saved to a designated file as defined in the Schedule tab. The report runs again at the scheduled time.
Click Save and Export to save the changes and export the report as defined in the Destination section (CSV or PDF).
Click Save and Email to save the changes and send the report to the email address specified in the Destination section.
Note
You can use the Run command to check a report scenario before saving it or to run ad hoc reports as necessary.
A report can be customized to meet your specific needs. The Create Custom Report page allows you to customize the report results. An example is shown in Figure 16-4.
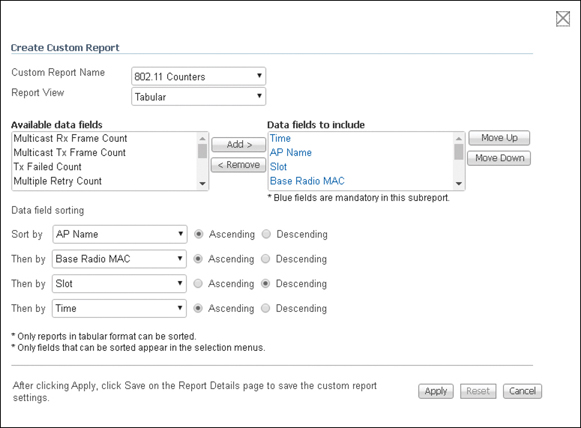
Figure 16-4 Customizing Cisco PI Reports
To customize a report, in the Settings section of the report configuration page, click the Customize button. A Create Custom Report page appears.
From the Create Custom Report page, use the Add > and < Remove buttons to move highlighted column headings between the two panels (Available data fields and Data fields to include).
Note
Column headings in blue are mandatory in the current subreport. They cannot be removed from the Selected Columns area.
You can also use the Move Up and Move Down buttons to determine the order of the columns in the results table. The higher the column heading appears in the Selected Columns list, the farther left it appears in the results table. In the Data field Sorting section, indicate your sorting preference (ascending or descending). Determine how the report data is sorted. You can select four data fields for which you can specify sorting order. Use the Sort by and Then by drop-down lists to select each data field for sorting.
Note
Only reports in table form (rather than graphs or combined) can be sorted. Only fields that can be sorted appear in the Data field sorting drop-down lists.
Reports on Cisco DNA Center
DNAC is aimed at integrating advanced network monitoring functions grouped under the label “Assurance.” As such, the main page of DNAC provides multiple metrics about your network that can be customized. In other words, DNAC Assurance continuously collects information about your network and runs reports that can be visualized directly in the DNAC Assurance interface. The interface is organized into three tabs:
Dashboards: The dashboards include the Health component (Overall/Summary, Network, Client, and Applications), the Issue component (Open, Resolved, and Ignored), and then Wireless Sensors, Rogue Management, and the Dashboard library.
Trends and insights: This section includes Network Insight, Network Heatmap, Peer Comparison, and Site Comparison.
Manage: This section allows you to configure various settings, such as Issue settings (what issue detection is enabled, what priority/severity it should get, and how it is triggered), Health score settings, Sensor settings, and Intelligent Capture settings. Sensors allow you to deploy APs that test your network at regular intervals. Intelligent Capture allows you to capture over-the-air traffic based on specific events or thresholds.
Managing Dashboards
The Dashboards menu is where you will find the equivalent of Cisco PI reports. The concept of health in DNAC combines metrics about status (up/down), traffic volume, and also dynamic ratios related to specific elements and their activity. For network elements, the Network Health page displays device counts and status, their health level as a measure of elements that can disrupt normal activity, and a severity level. Heath can be good (green status), fair (orange status), poor (red status), or unmonitored (grey status). For example, for access points, radio health can be impacted by interferers.
For each dashboard, you can have a summarized view (for example, a list of all network element types and their count and health status). The global health status is displayed as the health level of the worst element. An example is displayed in Figure 16-5.

Figure 16-5 DNAC Global Network Health
In this case, Access Points shows a health score of 60, which means that at least one AP has a health score of 60, and the worst health score for all APs is 60 (all the others are displaying a score higher than 60). You can then click a particular element (for example, the Access Points hyperlink) to display details about this element, as shown in Figure 16-6.

Figure 16-6 DNAC Access Point Health Detail Page
In this example, nine APs have a good health score and six APs have a fair health score. The bottom of the page provides individual details.
For each element, the dashboard provides a view of the current state of elements (using the Latest option) but also counters for the last 24 hours (using the Trend option). At the top of the page, you can use the slider to reduce or extend the computed time window. Alternatively, you can click the Time Range hyperlink and configure the interval to display, as illustrated in Figure 16-7.

Figure 16-7 Configuring Reporting Time Range on DNAC—Client Health Example
Additionally, for each element of interest, you can use the Filter option (visible on the bottom left of Figure 16-6) to only display a subset of elements. Each time a set of element health is displayed as a graph, the bottom of the page also displays a table with the details of each component. You can then click the Export button (visible at the bottom of Figure 16-6) to export the table in a CSV format.
Wherever needed, you can customize the dashboards and their elements by clicking the Actions > Edit Dashboard option in the upper-right part of the page. There, you can reorganize the elements in the page. You can also navigate to Dashboards > Dashboard Library to create a new customized dashboard and its customized elements.
Trends and Insights
The dashboards are built by computing performance numbers based on Key Performance Indicators (KPI) collected from the network elements. DNAC also integrates a Machine Learning engine that uses multiple techniques to predict trends or issues. This element is organized around the idea that the first concern of a network administrator is to avoid network issues, the second concern is to understand the network activity, and the third concern is to determine if the level and type of activity are normal.
With this mindset, the first element of Trends and Insight is the Network insight, which displays the list of events that show abnormal activity. In this context, abnormal represents a metric that shows an important variation over time. For each monitored element in your network and associated counters, DNAC computes the values’ averages, standard deviations, and so on, and can alert you when there is a sudden drop or increase. This approach is useful, because a small store’s traffic characteristic is unlike a large stadium’s, and what is normal here may not be normal there. When you compute your network baseline, the Network Insight element can surface deviations that should alert you, even if the computed numbers would be normal elsewhere. In the Network Insight page, the last detected deviations are listed. Clicking each of them opens a details page, as illustrated in Figure 16-8.

Figure 16-8 DNAC Network Insight
In this example, the client count on a particular AP increased dramatically over the last few weeks. With this element of information, you can then check the AP location and verify if this increase is normal (for example, a cafeteria terrace opened when spring arrived).
This notion of counter, baseline, and deviation can be visualized in the Network Heatmap page, where you can choose the KPI (such as client count represented in Figure 16-8, but also AP radio throughput, radio resets, packet failure rate, interference, channel change count, average client RSSI or SNR, traffic volume, channel utilization, or Cloud, Social or media app throughput) and the system will list all network elements, sorted from highest to lowest for the KPI you are monitoring over the last (configurable) 1-month period.
The amount of information provided can be overwhelming. It may be particularly difficult to estimate if a deviation is normal or even if your baseline is normal. To help you further, the Site Comparison option in Trends and Insight displays a comparison graph for key counters (such as client onboarding time, average RSSI, and SNR) across all your sites, to help you evaluate if a local deployment would be different from the others.
In the Trends and Insight menu, you can also choose the Peer Comparison option. By comparing (locally) your network to the KPIs collected anonymously from tens of thousands of networks with the same type of deployment as yours, the tool can help you understand if what looks normal in your network is really normal, or if you are just got accustomed to seeing these numbers. An example is displayed in Figure 16-9, where the local network provides a much higher throughput than other networks of the same type.
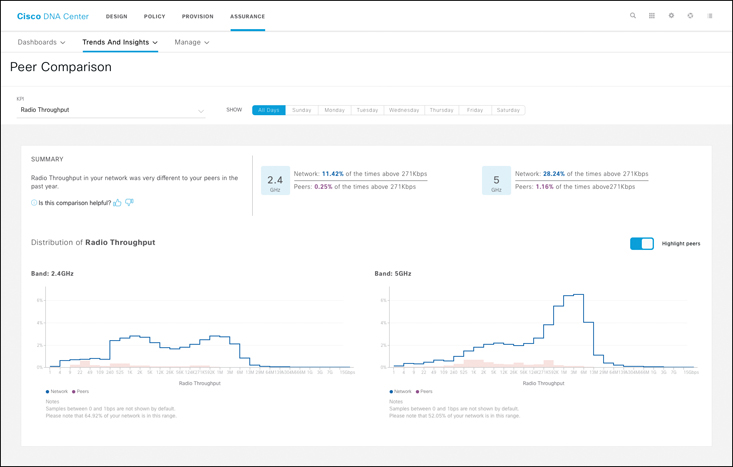
Figure 16-9 DNAC Peer Comparison
This difference may be caused by a lower client density or smaller cells. Higher performance is usually not much of a concern. The comparison can be done for radio throughput, radio resets, radio packet failure rate, interference, client RSSI, or average cloud-app throughput.
Managing Alarms on Cisco Prime Infrastructure and DNAC
Both Cisco Prime Infrastructure (PI) and DNAC surface alarms when abnormal events occur. The previous section showed the outcome of these alarms in DNAC, as they are a natural consequence of the way DNAC constantly builds reports. However, you need to know how to configure them. In Cisco PI, alarms are treated independently from reports.
Alarms in Cisco Prime Infrastructure
In Cisco PI terminology, alarms and events are different. An event is a distinct incident that occurs at a specific point in time, such as a port status change or a device becoming unreachable. Events can indicate errors, failures, or exceptional conditions in the network. Events can also indicate the clearing of those errors, failures, or conditions.
An alarm is a Prime Infrastructure response to one or more related events. Only certain events generate alarms. Alarms have a state (cleared or not cleared) and a severity (Critical, Major, Minor, and so forth). An alarm inherits the severity of its most recent event. Alarms remain open until a clearing event is generated (or if the alarm is manually cleared).
You can access the alarms and events from Monitor > Monitoring Tools > Alarms and Events.
The alarms are classified into four categories and displayed in separate tabs in the Alarms table:
Network Health tab: Shows the Network Health alarms that are not covered under Rogue AP, Ad-hoc Rogue, Security, and System category alarms
Rogue AP: Shows the Rogue AP and Ad-hoc Rogue category alarms
Security: Shows the security category alarms
System: Shows the system category alarms
Rogues
In the context of Cisco Wireless networks, a rogue is any 802.11 device that is not managed by your organization. For example, if you manage the Wi-Fi service of a department store in a shopping mall, the neighboring stores’ Wi-Fi APs are all considered rogues from your network’s viewpoint. This does not mean that any action should be taken against them; they are just not APs managed by your systems.
Rogue APs are detected because of their beacons, sent from a MAC address that your WLC (or Cisco PI or DNAC) does not recognize as one of your APs. All three systems will alert you about these rogues. They are by default unclassified. You can then manually classify them as friendly (internal if they belong to your organization but are not managed by your WLCs and external if they are neighbors) or malicious (you have identified them as posing a threat).
Rogue clients are any of your clients (a client that was associated to one of your APs in the past) that is now associated to a rogue AP (your clients should have no reason to decide to jump off your networks and prefer an AP that is not managed by your system).
Ad hoc rogues are clients of your network that establish a peer-to-peer connection (that is, they decide to avoid going through the infrastructure in order to communicate with each other).
The count next to each tab name indicates the total number of alarms in that specific alarm category. The alarm severity can be one of the following:
Critical (red cross)
Major (orange warning sign)
Minor (yellow warning sign)
Warning alarm (light blue warning sign)
Alarm cleared, back to normal (green checkmark)
Informational alarm (blue Information icon)
Underdetermined alarm (blue icon with white question mark)
For each alarm, you can click the “i:” icon on the right to get additional details.
The page (columns order and content) can be customized by clicking the wheel icon in the top-right part of the page. The alarm status can be modified, and you need to clearly understand the different states:
When it appears, an alarm is “Not Acknowledged,” which means the problem is not being worked on. It could indicate a new fault condition in the network or a cleared fault condition that has recurred. Not Acknowledged alarms are not removed from the Alarms and Events tables until they are either acknowledged or cleared.
“Acknowledged” means a fault condition has either been recognized and is being worked on, or it can be ignored. Moving an alarm to the Acknowledged status is a manual operation and changes the alarm’s status. An Acknowledged event is still considered to be open (that is, not cleared), so if any related events recur, the events are added to the alarm. Acknowledged alarms can be moved back to the Not Acknowledged status (for example, if you acknowledged the wrong alarm).
Note
By default, acknowledged alarms are not removed from the Alarms list. This behavior depends on the Hide Acknowledge Alarms setting that is controlled by the administrator.
“Cleared” means the fault condition no longer exists. If an alarm is cleared but an associated event recurs, Prime Infrastructure opens a new alarm. By default, cleared alarms will not be shown in the Alarms and Events page. To view the cleared alarms in the Alarms History table in the Alarms and Events page, under Alarm Display Options, uncheck the Hide Cleared Alarms box.
You can also customize how often information is gathered (polling interval), the threshold value that indicates a problem, and whether Prime Infrastructure should generate an informational event or an alarm (of severity) when a problem is detected. Not all policies have all of these settings; for example, a policy may only collect statistics, so it would not have any thresholds or alarms associated with it.
To customize an alarm, use the following steps:
Step 1 Choose Monitor > Monitoring Tools > Monitoring Policies > My Policies and select the policy you want to edit.
Step 2 Locate the parameter you want to change. You can search for the parameter by entering a string in the Parameter text box.
Step 3 To adjust the polling interval, select the new interval from the Polling Frequency drop-down list. To disable polling, choose No Polling. Note that some polling frequencies are applied to groups of parameters. Changing the group interval will change the polling for all settings in the group. If a policy does not have any thresholds or events associated with it, Prime Infrastructure prompts you to save the changes.
Step 4 To change a threshold value, expand the parameter and choose a value from the parameter’s drop-down list.
Step 5 To specify what Prime Infrastructure should do when the threshold is surpassed, choose an alarm value from the parameter’s drop-down list. You can configure Prime Infrastructure to generate an alarm of a specified severity, generate an informational event, or do nothing (if no reaction is configured).
Step 6 Click Save and Activate to save and activate the policy immediately on the selected devices. Click Save and Close to save the policy and activate it at a later time.
A special treatment needs to be made for rogue management. From the Monitor > Monitoring Tools > Alarms and Events, and from the Dashboard > Wireless > Security pages, you can select a rogue and change its default classification from Unclassified to Friendly (Internal, if it is one of your APs, or External, if it is a known neighbor). Doing so and acknowledging the rogue will prevent it from being reported in future alarms, unless its parameters change. You can also classify the rogue as malicious to maintain it in an alarm state. From within this classification, you can also choose to contain the rogue. In this case, your APs in range of the rogue will start sending deauthentication messages to any detected client of the rogue.
Note
Be careful with this feature! In most countries, deauthenticating clients of a legitimate Wi-Fi network is considered an attack and is illegal. Make sure that the rogue you are containing is within the physical venue under your control, is not legitimate, and is posing a threat to your network. If you are in doubt, do not contain the rogue and investigate locally.
You can also configure larger rogue policies, from Security > Wireless Protection Policies > Rogue Policies. From this page, you can refine how alarms about rogues are triggered:
Rogue Location Discovery Protocol: RLDP determines whether or not the rogue is connected to the enterprise wired network. It does so by using one of the neighboring APs that pretends to be a client and associates to the rogue. That pretend client then attempts to contact its WLC, through the rogue, on UDP port 6352 (RLDP port). If the message reaches the WLC, then the WLC signals to Cisco PI that the rogue is effectively connected to your wired infrastructure. Obviously, this attack only works if the SSID on the rogue is open (your AP will not be able to connect to an SSID protected by WPA/WPA2/WPA3) and if no firewall between the rogue and your WLC blocks UDP 6352. If you decide to enable RLDP, you can choose one of the following options:
Disable: Disables RLDP on all access points. This is the default value.
All APs: Enables RLDP on all access points.
Monitor Mode APs: Enables RLDP only on access points in Monitor mode.
Rogue APs Policies: You can configure the parameters upon which a rogue should be reported:
Expiration Timeout for Rogue AP and Rogue Client Entries (seconds): Enter the number of seconds after which the rogue access point and client entries expire and are removed from the list. The valid range is 240 to 3600 seconds, and the default value is 1200 seconds. If a rogue access point or client entry times out, it is removed from the controller only if its rogue state is Alert or Threat for any classification type.
Rogue Detection Report Interval: Enter the time interval in seconds at which the APs should send the rogue detection report to the controller. The valid range is 10 seconds to 300 seconds, and the default value is 10 seconds. This feature is applicable to APs that are in Monitor mode only.
Rogue Detection Minimum RSSI: Enter the minimum RSSI value that a rogue should have for the APs to detect and for the rogue entry to be created in the controller. The valid range is −70 dBm to −128 dBm, and the default value is −128 dBm. This feature is applicable to all the AP modes. There can be many rogues with very weak RSSI values that do not provide any valuable information in the rogue analysis. Therefore, you can use this option to filter the rogues by specifying the minimum RSSI value at which the APs should detect rogues.
Rogue Detection Transient Interval: Enter the time interval at which a rogue has to be consistently scanned for by the AP after the first time the rogue is scanned. By entering the transient interval, you can control the time interval at which the AP should scan for rogues. The APs can filter the rogues based on their transient interval values. A valid range is between 120 seconds and 1800 seconds, and the default value is 0. This feature is applicable to APs that are in Monitor mode only.
Rogue Clients parameters:
Validate rogue clients against AAA: Select the check box to use the AAA server or local database to validate if rogue clients are valid clients. The default value is unselected.
Detect and report ad hoc networks: Select the check box to enable ad hoc rogue detection and reporting. The default value is selected.
Alarms in DNAC
Alarms in DNAC are called “issues” and are found at the bottom of most dashboard pages. Behind the scenes, DNAC distinguishes global issues from device issues. The boundary between both is malleable. A device issue is, as the name indicates, an issue that affects a single device (for example, an STA failing to obtain an IP address). When the device is a networking device, the local issue may affect many users and may become global by nature (for example, a WLC crashing). An issue affecting a single device may also be reflective of a global issue. For example, an STA may fail to obtain an IP address because of local RF issues at the station level (local issue) or because the DHCP server stopped responding (global issue). This classification is not directly visible in DNAC, but you need to keep it in mind. Cisco PI directly reports the events and alarms as they are configured. By contrast, DNAC also attempts to analyze the events and alarms to determine their most likely root cause. And it is the root cause that will drive the classification of the alarm. Therefore, you may see a similar event (an STA failing to get an IP address) be classified differently in DNAC, depending on what might have caused the issue.
Additionally, with a focus on network performance (not general data collection), rogues are not reported in DNAC by default, unless they effectively affect your network performance. If you want to surface rogues that are detected but have no effect on your network, you need to download a special DNAC add-on called Cisco DNA Center Rogue Management Application. Refer to this page for more details on this package:
As you navigate to the main issues page, in Assurance > Dashboards > Issues > Open, you will see at the bottom the top 10 issues. They are classified by severity (global impact first). You can click the various columns (Priority, Issue Type, Device Role, Category, Issue Count, Site Count, Device Count, and Last Occurred Time) to change the way the issues are sorted. DNAC recognizes eight categories:
Onboarding: Displays the wireless and wired client onboarding issues
Connectivity: Displays network connectivity issues, such as OSPF, BGP tunnels, and so on
Connected: Displays client issues
Device: Displays device-related issues, such as CPU, memory, fan, and so on
Availability: Displays device availability issues for APs, wireless controllers, and so on
Utilization: Displays utilization issues of APs, wireless controllers, radios, and so on
Application: Displays application experience issues
Sensor Test: Displays sensor global issues
You can also click View All Open Issues to expand the view beyond the top 10. You can click each issue to get more details. You can then use the Actions drop-down list to move the issue from the Open status to Resolved or Ignored. The classification has no direct effect on the issue, but is an easy way for you to separate issues that matter for your network from issues that are not important.
For each type of issue, DNAC offers a preset series of possible remediation actions, as shown in Figure 16-10.

Figure 16-10 DNAC Issue Remediation Page
These actions can be used to verify that the issue is still occurring. They can also be used as a step-by-step process to validate the root cause of the issue. When the action is a command that can be sent to a particular device, a Run button is available for DNAC to issue the correct command, on the correct device, for you.
An issue may not have the same severity in all networks. You can manage the issues that are relevant to your network by navigating to Manage > Issue Settings. As DNAC lists close to 200 different issues, you can use the filters at the top of the page to only display issues relevant to a particular device type (router, core/distribution and access switches, WLCs, access points, wired clients, wireless clients, applications, or servers) and only one of the eight categories listed previously.
You can then click each issue to open a slide-in pane with the settings. Click the Enabled toggle to enable or disable the issue. To set the issue priority, click the Priority drop-down list and select from the following priority options:
P1: Indicates a critical issue that needs immediate attention that can result in wider impact on network operations
P2: Indicates a major issue that can potentially impact multiple devices or clients
P3: Indicates a minor issue that has a localized or minimal impact
P4: Indicates a warning issue that may not be an immediate problem but addressing it can optimize the network performance
In the Trigger Condition area, you can change the threshold value for when the issue is reported.
If there are any changes to the settings, you can hover your cursor over View Default Settings to display the default issues. Click Use Default to restore all the issue settings to the default values.
Troubleshooting Client Connectivity
Monitoring alarms is important, but a good management tool does not compensate for a bad deployment. When users continue to complain about connectivity or when alarms keep showing gaps in coverage, you may need to focus your attention more closely onto the cells, their overlap, and your AP configurations.
Building a Troubleshooting Method
Before jumping to your WLC to change any configuration, it is critical to pause and clearly define the problem and its scope. The most commonly reported issue is probably “Wi-Fi does not work for me.” Such pronouncement is too vague to be actionable. Therefore, your first task is to collect as much information as possible to exactly qualify the problem, without short-circuiting the process by jumping to a conclusion or a diagnosis on the first appearance of a symptom that may remind you of an issue you saw in the past. Many issues are different yet surface some common symptoms. A good approach is often to ask as many questions as possible so as to reduce the scope of the problem, using “Wi-Fi does not work” as a starting point:
Can the user connect to Wi-Fi, but not use it, or is connection itself impossible? Although this narrowing down does not tell you at what Open System Interconnection (OSI) layer the issue is occurring (the problem may be occurring at Layer 2, after association), it still helps narrow down the phase you should focus on. If association itself is an issue, then checking the state at which the client stops, as detailed in the following list, will also help you focus. In most cases, the client utility cannot provide these details, but the WLC exposes the client state, if it is detected as attempting to connect through one AP. Here again, do not jump to conclusions. For example, a client stuck in DHCP-required state does not directly point to a DHCP server problem. An RF issue, too many collisions, and a VLAN misconfiguration are all causes that may prevent the client from completing the DHCP process.
Is the problem permanent or temporary? A temporary issue will conduct you to look into environmental conditions, while a permanent issue will drive you toward systemic configurations.
Is the problem affecting all traffic or only some of the traffic? This approach is called “top-down.” If all applications are affected, then the Application layer is likely not at fault, and something in a lower layer is likely at fault. A next step in this case could be to go down in the OSI layer logic and check if DNS resolution works, then if a particular server IP address can be reached (ping), thus testing Layer 3 connectivity, then if the gateway can be reached (both the gateway IP address on the client side and the IP address on the other side of the router), thus testing both IP connectivity and routing, and then, of course, if the client obtained an IP address (and in the right scope). If only some applications are affected, then the lower layers are likely to perform normally, and the issue may be related to the application itself.
In order to effectively solve connection issues, you need to clearly understand the client association phases and how they are labeled on the WLC:
The client first has to discover the network, by sending probe requests (or listening to the AP beacons). As this component does not mean that the client will want to effectively join the network (it may just be collecting information about APs but failing to find an SSID matching one of its profiles), the client may simply be labeled as Probing on the WLC, if the client is known, but may also simply not be reported (if the client has never joined the network in the past).
The client really begins the join process with an 802.11 authentication. This initial phase is labeled as Start on the WLC. In the early days of 802.1, this phase had a real (security) authentication component. Today, this phase simply authenticates the client as a valid 802.11 device.
The client continues with an 802.11 association, which is a simple obtention of an association identifier (AID) on the AP SSID.
At the conclusion of the 802.11 association phase, the client status moves from Start to another state that depends on the WLAN security. For Open and WebAuth SSID, the client moves to L2authcomplete. For PSK/802.1X WLANs, the client moves to Authcheck. A PSK network will display this state while the AP and the client verify that they both have the same key (4-way handshake). An 802.1x network will immediately switch to 802.1X_reqd while the client RADIUS exchanges occur. For both authentication methods (PSK/802.1X), auth failure shows an issue, and L2authcomplete is the expected successful outcome.
Once the authentication phase completes, the client will need an IP address and will therefore switch to the DHCP_reqd state. DHCP failure will obviously display a problem for this phase.
Once an IP address is obtained, the WebAuth client will still need an extra step (web authentication) and will therefore switch to Webauth_reqd. Here, Auth failure will point you to credential issues.
The client then moves to fully authenticated—a fully associated and functional state, labeled on the WLC CLI as the Run state. This state is also called Active in the WLC web interface.
These states are visible on the WLC by navigating in AireOS to Advanced > Monitor > Clients > Client Details and on C9800 to Monitoring > Wireless > Clients > Select Client > General.
Once you have validated the conditions of the issues mentioned and the client state, you can focus your attention on the wired side of the network if the issue is associated with a wired service (DNS, DHCP, server reachability, and so on.) However, keep in mind that if some clients in a cell successfully obtain a service but others do not, then the issue may either come from the clients themselves or from the cell.
RF Coverage Validation
One common cause of connectivity or service completion issue is a lack of good RF coverage. Before the deployment, you should have performed a site survey. After the deployment, you should have performed a verification survey. However, over time, APs get moved, their power gets changed, and furniture and walls may change the RF environments. Therefore, a common task associated with a rise of client support tickets is to verify the RF coverage again:
Conduct a verification survey of the entire affected environment (divided into several shorter surveys, if necessary) and compare the results to those generated during the planning stage of the pre-deployment process.
Make any required adjustments that were not accounted for in the preinstallation portion in order to make the network meet user and throughput requirements.
Conduct a separate verification site survey for each protocol supported (802.11a/b/g/n/ac/ax). Check for co-channel interference by standing near an access point on one channel and watch for other access points that are on the same channel. Check to see if the signal level on other access points that are heard on the same channel is at least 19 dBm weaker than the access point you are next to. For example, if the local AP signal is −67 dBm, the signal from the next AP on the next channel should not be stronger than −86 dBm (86 − 67 = 19).
Validate performances by testing a client against each AP. This process also allows you to verify that the real-world network traffic (for example, physical data rate, packet loss or packet retry, and uplink or downlink data) meets user requirements.
A key component of this phase is roaming verification. As part of your initial survey, you should have identified roaming paths (that is, the path users take when they move around) and therefore roaming points. It is common to observe that support ticket locations match roaming points between APs. If this case is observed in your network, focus your attention on the area between cells:
Take some time to walk back and forth at the edge of each cell to precisely determine where roaming occurs in each direction. At each point, verify that a standard user device has the time to discover the next AP and then roam to it.
Also verify that the next AP the client roams to is the one intended in your AP layout (that is, the view from the ground should be the same as the view from the ceiling, as explained in Chapter 3, “Conducting an Onsite Site Survey”).
Make sure to use the client whose technical specifications are closest to the one your users are reporting about in their support tickets. Your network probably has a large variety of clients types. When you tested those clients in the early phase of your site survey, you probably determined “good” and “poor” clients. The qualification of “good” and “poor” may not have any absolute meaning but may be a client-to-client comparison. Good clients are those that offer a good RSSI, good SNR (as reported by a client utility and the AP), and good throughput at a location position, whereas poor clients, at the exact same physical location, would offer a lower RSSI, lower SNR, and/or lower throughput. In your client test, you want to select the poor client. The assumption is that if performance is satisfactory for poor clients, it will be acceptable for good clients as well.
Note
Keep in mind that the RSSI alone is not enough to compare clients, as the RSSI is a vendor-specific value expressing the client’s ability to transform an RF signal into usable information. The RSSI can usually not be compared between two clients from two different vendors. Throughput is therefore a good additional metric.
Be sure to survey from all edges of the cell; do not assume that coverage on one side of the access points will be identical to coverage on the opposite side. The edge of the cell is not only the point where you expect your client to roam but also the (farther) point where the AP signal gets lost in the noise (typically by −94 dBm).
Your body may interfere with the signal. Other users will also experience this issue, and the opposite effect is true. If there is no obstacle between your wireless device and the AP, you will get a better signal than if your body is in the way. You need to take this fact in consideration when verifying the coverage. If you walk down a corridor in one direction with your laptop in front of you, make sure to also walk the same corridor in the other direction (still with your laptop in front of you) to test various body positions in the same environment.
Moving too quickly can result in insufficient data collected; however, moving too slowly results in longer processing times due to an excess of information.
As you review coverage, remember that channels play an important role. Many clients do not support the U-NII-2 extended (Band 3) channels 100 through 140 (5.470 to 5.725GHz). Most supporting clients take longer to discover APs in these channels than in other channels. Account for this added delay in roaming. Some clients support ISM channel 165; some others stop at the edge of the band that is defined for U-NII-3 (Band 4) channel 161. Ensure that only channels enabled on the controller or access points are supported by all wireless clients on the network. Failure to do so can cause coverage holes for clients that do not support certain channels.
After having verified the channels supported by all clients that are expected on your network, you can choose the list of channels that should be enabled and those that should be disabled. Keep in mind that channel support is not just related to the client hardware (the physical capacity of the radio installed on each client) but also to the client firmware. Channel support may change when upgrading or downgrading client firmware.
The network is also not ready until all applications have been tested on the wireless network Layers 1 through 7. You should perform density testing and roam testing while using the target applications that are reported in your support tickets. In density testing, you should ensure that each client gets the level of service it needs when peak activity levels are reached. In roam testing, you should verify that mobile clients can roam without losing their application session and that handoffs are smooth between access points (no freezes or losses).
WLC, PI, and DNAC Client Troubleshooting Tools
Once the RF conditions have been validated, it may be time to go back to individual client troubleshooting. The WLC is a network management tool, and one of its functions is to provide visibility into your network and its conditions.
Client Troubleshooting on the WLC
In AireOS, the Home > Monitoring > Clients page should be your first stop to monitor your associated clients and their state. The Client Detail page provides a lot of information about the client connection, such as connected AP, SSID, authentication and encryption mechanisms, QoS values, and so on. An example is provided in Figure 16-11.

Figure 16-11 AireOS Client Detail Page
A Samsung (S9 or later) or Apple iOS client will also display its details (hardware and OS version).
The Performance and Connection Score sections provide more information about the client RF characteristics, as detected by the AP. The connection score is 100% if the client connects at the maximum MCS/data rate it supports. In most cases, clients may not be close enough to the AP to connect at max MCS, and a lower connection score may not be of concern.
If the client implements Cisco Compatible Extensions (CCX), it is labeled “Cisco Compatible.”
On the right side, the WLC monitored the client onboarding and colored green all steps that completed as expected. Steps that got a warning (long delay and so on) are colored yellow, and steps that failed are colored red.
In the lower part of the page, you can see the connection path for this client, including the SSID and the AP names, but also the AP path to the WLC (switches and their ports). This information can help you evaluate the path taken by the client traffic through the network.
At the very bottom of the page, you can test the client connection by running a ping test. You can also navigate to the Connection tab and click Start. Then, on the client, attempt a connection. Then click Stop on the WLC Connection tab. The WLC will log and display each phase on the client association. Clicking each phase (802.11 association, Security Policy, Network Membership, IP addressing, or IP Addressing Options) will expand the relevant section to provide a list of frames and their content and outcome. The same logic applies to the Event Log tab, where you start logging each event relevant to the target client.
If AVC is enabled on your WLC, the Top Application section shows the main applications used by the client, along with volume (in MB) and proportion of the client total traffic.
If your client runs Apple iOS 11 or later, you will also see the Client Scan report section in the page. Right after (re)association, the iOS client sends an unsolicited 802.11k neighbor report to its connecting AP, listing all the other APs it detected (for the target SSID) while scanning before joining the local AP.
Note
Do not be alarmed if the client does not list all APs. When an AP signal is strong, the client may stop scanning and directly join that AP.
Lower down in the page, you can see the client network, QoS, and security policies. This section is very useful to verify, from all policies configured on the WLC (and possible AAA), which one was applied to this client.
The same type of information is available in the Monitoring > Clients >Details page in the C9800 WLC, as shown in Figure 16-12.
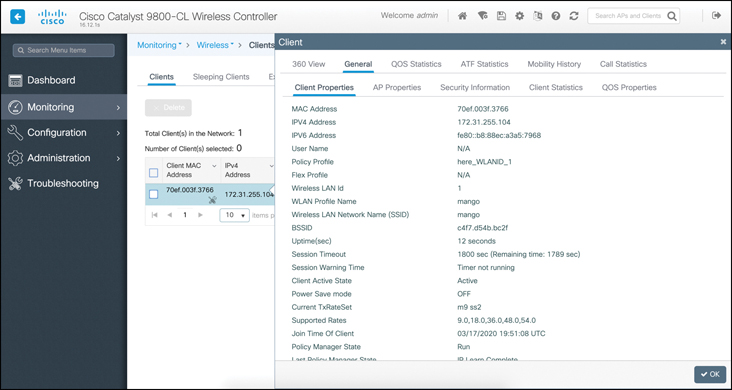
Figure 16-12 C9800 Client Detail Page
You will note that the page is organized slightly differently compared to AireOS. The 360 View includes the client general information (the AireOS equivalent is shown in Figure 16-11) along with the top applications list. The General tab includes five subtabs: Client Properties, AP Properties (client), Security Information (client policy), Client Statistics, and QoS Properties (QoS policies applied to the client). In AireOS, the Client Statistics, along with the equivalent to the C9800 QoS Statistics, ATF (Air Time Fairness) Statistics, Mobility History, and Call Statistics tabs are not accessible from the home page but from the Advanced > Monitor > Client > Details page.
The C9800 also includes a Troubleshooting menu, intended to help you troubleshoot most client and network issues, as illustrated in Figure 16-13.
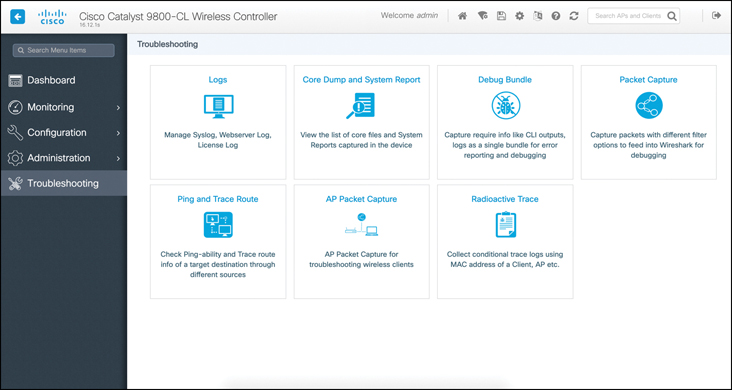
Figure 16-13 C9800 Troubleshooting Page
Most of the menus are self-explanatory. Keep in mind that the logs can provide a view of past client issues (in AireOS, logs are accessible from Management > Logs). With the Radioactive Trace function, you can enter a client MAC and let the system collect in a single file all the subsequent logs relevant to this client. The Core Dump and System Report and Debug Bundle menus are used to troubleshoot the WLC platform. The Packet Capture menu only applies to wired capture (physical or VLAN interfaces). Therefore, you should only use it if you suspect that the client issue you are troubleshooting has a strong wired component.
If you suspect a wireless component, you can use the AP Packet Capture function. The function only works if you have defined how and where the capture should be stored. This is done from Configuration > Tags & Profiles > AP joint. Add or edit a profile and then navigate to the AP tab. Within this tab, click the Packet Capture tab. At this location, you can create a capture profile that defines what frames are to be captured (802.11 control, 802.11 management, 802.11 Data, Dot1x, ARP, IAPP, IP, Broadcast, Multicast, and TCP/UDP with target ports). You can also define the maximum capture size (in KB) and duration (in minutes) and also decide if you only want to capture the header of the frames (using the Truncate option, where you define the number of bytes of the frame to capture). You can then define the FTP server address and credentials to use for the capture. Save the capture profile by clicking Update and Apply to Device. You can then go to Configuration > Wireless Setup > Advanced > AP Join Profile to select the profile you created and then Tag APs to apply that profile to your APs. They will then be able to capture over-the-air traffic.
Navigate back to Troubleshooting and click AP Packet Capture. A new page appears. You can enter the target client to monitor in the Client MAC Address field. The Capture mode is by default set to Auto, which means that the system will automatically capture the channel on the AP to which the client is associated. You can also set the mode to Static (for example, if the client is not associated or if you want to verify how a neighboring AP detects the client). In Static mode, you can manually enter the AP name. Once you click Start, the AP will capture the client traffic and send it to storage upon completion. You can stop the capture manually by clicking Stop, or you can wait for the maximum duration or maximum size to be reached.
In some cases, you will conclude that the issue occurs during the 802.1X/EAP authentication phase and that the AAA server is either rejecting the authentication or simply not responding. In the first case, the WLC will display an authentication failure message. In the second case, the WLC will display a AAA timeout message. In both cases, you may need to go to the Identity Services Engine (ISE) interface to investigate further. In many networks, a different team manages the AAA server, and this access may not be available to you. Additionally, the CCNP exam does not expect you to be a security expert. However, you should be aware that you can verify connectivity with the WLC, in ISE, from Administration > Network Resources >Network Devices. If the WLC considers a Network Access Device (NAD) to be misconfigured, you will see the issue in its status. Make sure you correctly configure the IP addresses and keys, both in ISE and in the WLC, as explained in the Chapter 15, “Security for Wireless Client Connectivity.”
Additionally, you can also monitor the authentication and authorization dialogs in Monitor > Authentication. For each user and attempt, you can click the attempt and get details on what message was received and what ISE’s answer was. Because the details of the authentication dialogs are usually encrypted, they are not visible to the WLC. Therefore, ISE is the best place to investigate AAA issues. Refer to Chapter 15 and the ISE troubleshooting guide at the end of this chapter for more details on troubleshooting functions in ISE.
For most nonsecurity issues, the WLC likely provides all the information you need to troubleshoot your clients. However, your efforts might lead you to Cisco PI (or DNAC) for two reasons:
Some network management teams only use central management tools, such as PI or DNAC. Therefore, the tools that exist on the WLC are also available on PI and DNAC. In most cases, the functions are the same. The difference only lies in the troubleshooting preferences of the support team.
However, the WLC does not store historical information and therefore can only provide a live snapshot of the network conditions. By contrast, Cisco PI and DNAC can be configured to store historical information and can be preferred if you need to look at past events, either in search of a particular point in time when an issue occurred or because you need to compare past states or conditions to the present.
Client Troubleshooting in Cisco Prime Infrastructure
There are multiple ways in which you can view the list of clients connected to your network in Cisco PI. One of them is to navigate to Dashboard > Network Summary, where a dashlet represents graphically the number of wireless clients connected over time.
At the top of any page in the dashboard, you can also look for a particular client by using the Search field and entering a client MAC address, IP address, or username.
To get information about more than one client, you can use the Dashboard > Overview > Client page. There, you will see dashlets representing the client distribution by RSSI, by SNR, by 802.11 protocol (802.11a/n/ac/ax), or by type (iPhone and so on, when available). To get a list of clients, instead of a graphical split by type, navigate to Monitor > Monitoring Tools > Clients and Users. You will see all the clients, with the MAC address, IP address and type (9IPv4/IPv6), username, device type and vendor, location (if you use MSE/DNA Spaces), WLC and its interface, the client VLAN, 802.11 protocol, and status (associated and so on). You can sort or filter the view by using the Show drop-down list and selecting only a subcategory of clients. You can also click the filter icon and select the filter criteria. When you click the icon next to each client username, a client 360 pop-up appears that shows similar information as what you had in the WLC client 360 view.
You can click a single client and click Troubleshoot. This action opens a new page where you will see several tabs. The default tab is Troubleshoot and Debug. In the upper part of the page, you will see client general information (username, IP address, MAC, vendor, and so on), session details (WLC and AP details, SSID, protocol, state, and VLAN), and security details (EAP-type ACLs and so on.). The Overview tab will also show the client path (AP and WLC).
At the bottom of the Overview section, the Association History segment is where Cisco PI diverges from the WLC. Here, you can see each past session for this client, along with association time and session duration, AP, WLC, IP address, and so on. This part is very useful to understand the client behavior over time and identify sporadic disconnection issues.
In the Troubleshoot and Debug tab, you can push your investigations further by looking at the Troubleshoot section at the bottom of the page. There, you will see tabs for each client association phase (802.11 Association, Open Authentication, IP Address Assignment, and Successful Association) and a status indicator (green checkmark for pass, red X for failed). Clicking each tab provides more details on the frames exchanged for this phase and the outcome. On the right side, the Debug and Analysis section allows you to trigger log captures from the WLC. You can select the types of messages to log (All or a subset, like 802.1X authentication or DHCP messages). In case of troubleshooting, All is likely a good choice. You can click Start, ask your client to attempt to connect to the network, and then click Stop when the experiment completes. The page will display the details of the frames received and sent (802.11 association, 802.1X authentication, and so on) along with their outcome.
Client Troubleshooting in Cisco DNA Center
DNAC offers similar functions as Cisco PI. When you navigate to Dashboards > Health > Client Health, you will see global statistical graphs at the top and then the list of all clients in the Client Devices section. For each client, you can see the username, IP address, device type, traffic volume, AP name, band RSSI location (and then time where the client was last reported). You can also see a composite health index for the client. This index is a simple composite indicator of the client status. DNAC defines “good RSSI” as −72 dBm and above, and it defines “good SNR” as 9 dB and above. The client will display a health index of 1 if it failed to complete association, 4 if it connected but has both poor RSSI and poor SNR, 7 if RSSI or SNR gets above the threshold, and 10 if both RSSI and SNR get above the threshold for the connected client.
At the top of the section, you can use Type selection buttons to reduce the display list to only wireless clients or wired clients, only inactive clients, or only clients with poor (4 or less), fair (7 or less), or good health (more than 7). You can also refine the display with the Data button to only show the clients whose onboarding times exceed key values (more than 10 seconds for total onboarding time, more than 5 seconds for association, more than 5 seconds for DHCP, more than 5 seconds for authentication [Webauth, 802.1X, PSK], less than −72 dBm RSSI, and less than 9 dB SNR). You can also use the Filter button and enter a particular client MAC address, IP address, username, or any other criterion present for a client (health score, RSSI, connected AP, and so on) to focus your attention on a particular case.
The client’s Details page is organized around the idea of performance monitoring and issue root cause analysis. The top of the page shows a graph of the client health over time. You can use the date on the upper-right part of the screen, or the sliders on each side of the graph, to change the monitored interval. The default is a sliding 24-hour window.
Below the graph is a list of issues (if any) for the same period. The lower part of the page displays the elements you are now familiar with from the other interfaces we covered in this chapter, an onboarding section showing the various steps (association, AAA, DHCP) and their status (green or red), a list of frames for each of these events, and a graph of the client connection (SSID, AP, WLC). However, you will notice that DNAC provides more information than the other interfaces (for example, the count of other clients on the same AP or the WLC, the IP address of the AAA authentication server, and so on).
Lower in the page, the Application Experience section shows the applications used by that client. Instead of providing a list sorted by default by volume, DNAC organizes applications based on their policy classification: Business Relevant, Business Irrelevant, or Default (that is, either business relevant or not, depending on what payload that application carries). In the DNAC Policy menu, you can change this classification.
The very bottom of the page provides additional information about the client, such as device type, operating system (when known), MAC address, IP address, and so on. A Connectivity tab shows graphs for transmission elements, such as Tx and Rx bytes over the monitored period, DNS requests and responses, and overall data rate. An RF tab shows the client RSSI and SNR over the period. If the client is Apple iOS, an iOS Analytics tab is visible that displays the 802.11k neighbor report that the client provided at association time. If the client is a Samsung Galaxy S9 or later, a Samsung Analytics tab is visible that displays more details about the client (SP or manufacturer build, detailed reasons for client de-association, and so on).
Although DNAC does not give you access to the raw logs like Cisco PI does, you can access the same content. It is simply preorganized into relevant phases. DNAC also includes two additional client troubleshooting tools that are specific and often seen as very valuable:
Path Trace: Start by clicking the icon by the middle of the client details page. Path Trace allows you to configure a starting and terminating point as well as a traffic type (protocol and ports) and to evaluate what would happen if that traffic were to run. This function is very useful for troubleshooting specific applications and their path through the network as well as networking device issues on the path. For example, in Figure 16-14, the Cat93200-2 outbound interface is dropping packets for the target traffic. You then know exactly where to focus your troubleshooting efforts.

Figure 16-14 DNAC Path Trace
Intelligent Capture: Start by clicking the name in the upper-right part of the client details page. DNAC then sends an instruction to the AP to which the client is associated to start a live capture and return the flow to DNAC, where you can see near-real-time (about 3-minute delay) information about the client, including location on a map, RF statistics (RSSI, SNR, Rx data rate, Tx/Rx packets, and retries) and the management frames exchanged with the clients (authentication, key exchanges, and so on). When an exchanged has failed, you can click the flagged frame. An Auto Packet Analyzer will display the packet details and the reasons for the failures, as shown in Figure 16-15. You can also download the full PCAP capture, if you want to leverage the capture on another tool. Intelligent Capture is very useful either to troubleshoot clients in near real time, to continuously monitor the performance of key devices (for example, your boss crossing the floor), or to run what-if scenarios (during AP or new client device deployment, walk target areas with a few test clients and monitor the outcome).

Figure 16-15 DNAC Intelligent Capture
Note
Intelligent Capture is also its own menu, accessible from Assurance > Manage > Intelligent Capture, where you can schedule a client capture (immediately or with a delayed start) with the same logic detailed previously in the C9800 section, and also review and manage the list of clients currently monitored with Intelligent Capture. Therefore, clicking Intelligent Capture from the client details page automatically starts Intelligent Capture for that client, but you can manage Intelligent Capture outside of the client details page.
For all cases where you cannot directly test with a client, DNAC allows you install sensors—access points with a small form factor that are installed where clients would be placed (that is, connected to a power socket near ground level). These sensors can then be configured to test your RF environment, along with target applications. For more details, refer to the sensor deployment guide at https://www.cisco.com/c/dam/en/us/td/docs/cloud-systems-management/network-automation-and-management/dna-center/deploy-guide/Cisco_1800S_Sensor_Deployment_Guide_133.pdf.
Troubleshooting and Managing RF Interferences
In your client troubleshooting efforts, you will have encountered many scenarios where the issue comes from the RF environment. As such, this section does not need to be long. However, the CCNP exams expect you to be able to manage RF interferers, regardless of their effect on your clients, so you need to make sure you know what tools are available and where to find them.
WLC Interference Management Tools
Remember from Chapter 3 that on many Cisco APs, non-802.11 interferers are detected through a specific chip called Spectrum Analysis Engine (SAgE). Some lower-price-point APs do not include a SAgE chip and use software analysis from the Wi-Fi chipset (called Spectrum Intelligence) to perform detection.
Note
SI is a subset of what SAgE does. Refer to this document for a detailed comparison: https://www.cisco.com/c/en/us/td/docs/wireless/controller/technotes/8-6/b_wlc_8_6_spectrum_intelligence_on_cisco_wave_2_aps.html.
The SAgE chip scans the AP channel continuously (when the AP is not transmitting or receiving) and can recognize hundreds of different signal types. It then associates a pseudo-MAC address with each detected non-Wi-Fi signal (so the interferer can be labeled uniquely with an identifier) and returns the report to the WLC. The WLC reconciles the reports from multiple APs that may be hearing the same interferer and then exposes the reports to the admin. You can then configure your WLC to react to these interferers and have the APs change channel when the interference is too damaging to your WLAN’s performance. This overall solution is called CleanAir.
On the C9800, CleanAir is enabled by default, and the dashboard (in the upper-right area) counts the interferers detected in 2.4GHz and 5GHz. You can click each band or interferer count to get more details. This action redirects you to the Monitoring > Wireless > CleanAir Statistics page, where the interferers are listed, along with their type, the affected channel, the reporting AP, the severity, duty cycle, RSSI, and allocated unique identifier (pseudo-MAC).
Note
The severity is an index from 1 to 100 that reflects how badly the interferer affects your channel. At 100, the channel is completely unusable.
Note
The duty cycle represents the percentage of time, each second, the interferer transmits energy.
You can click each interferer to get a graphical view of the channel Air Quality and interferer RSSI (its transmission strength).
As more than one interferer can affect each channel, the WLC also outputs a channel Air Quality report, available in the Air Quality Report tab, that provides for each channel an Air Quality Index (AQI), which is a composite measure of the effect of all interferers on that channel. An AQI of 100 means “no interferer.”
Note
Although there is a direct relationship between each interferer severity and the AQI for that channel, the relationship is not linear. In other words, a single interferer with a severity of 35 does not cause the AQI to be exactly 65 (100 – 35), as the AQI factors multiple components to provide the index value.
To help you better visualize your environment, a Worst Air Quality Report tab also shows which AP has the worst AQI, along with the number of detected interferers.
Although CleanAir is enabled by default, you can configure it from the Configuration > Radio Configuration CleanAir page. From that page, you can enable or disable CleanAir and SI and also decide which interferer to detect and report (and which to ignore, because they may be expected and unavoidable in your network). You can also decide which detected interferer is reported via SNMP (to Cisco PI or DNAC). You can also disable CleanAir for each individual AP (in Configuration > Wireless > Access Points > [5GHz | 2.4GHz] Radios > Configure > CleanAir Admin Status).
Last, from the Configuration > Radio Configurations > RRM > Band > DCA page, you can enable or disable several functions related to interferers:
Avoid non-5GHz noise: This is a Wi-Fi chipset-based detection of energy that the chipset does not recognize. It is enabled by default and causes the AP to attempt to change channel on the next RRM cycle.
Avoid persistent non-Wi-Fi interference: This is a CleanAir function that analyzes interferers and identifies those that will affect the channel continuously (for example, a camera feed). It is disabled by default. When enabled, it causes the AP to attempt to change channels on the next RRM if a detected interferer on the channel is persistent.
Event-Driven RRM (EDRRM): This is a CleanAir function that reacts to severe interferers. If these interferers are present for more than 30 minutes, this feature triggers RRM instead of waiting for the next RRM cycle. The feature is disabled by default. When it is enabled, you can also configure the sensitivity threshold: high (AQI of 60), medium (AQI of 50), or low (AQI of 35), at which point the RRM event would be triggered.
On AireOS, the same functions are of course available. In the Home > Monitoring > Interferers page, you will find the list of interferers per band, along with their type, the detecting AP, device type, affected channel, severity and duty cycle, RSSI, and pseudo- MAC address. Clicking an interferer sends you to Advanced > Monitor > Cisco CleanAir > [802.11a/n/ac/ax | 802.11b/g/n/ax] > Interference Devices. In the same Cisco CleanAir umbrella, you will find Air Quality reports for each band and the Worst Air Quality Report option.
In Wireless > [802.11a/n/ac/ax | 802.11b/g/n/ax] > CleanAir, you can enable CleanAir. In AireOS, the feature is disabled by default (recall that it is enabled by default in C9800). You can also enable SI, choose what interferers to detect and report in the WLC, and from those, which ones to report via SNMP (to Cisco PI or DNAC).
In Wireless > [802.11a/n/ac/ax | 802.11b/g/n/ax] > RRM > DCA, you can configure Avoid non-802.11a noise (enabled by default and called in C9800 “non-5GHz noise”), configure Avoid Persistent non-Wi-Fi Interference, and configure EDRRM. For each individual AP, you can disable CleanAir (if CleanAir is enabled globally) from Wireless > Access Points > [802.11a/n/ac/ax | 802.11b/g/n/ax] Configure CleanAir Status.
Interferers on Cisco PI and DNAC
Naturally, interferers on Cisco PI are only reported if CleanAir or SI SNMP reporting is enabled on the WLC. Then, you will see CleanAir and SI interferers in the alarms, along with severity and reporting AP and WLC. You can also use the Search function to look for interferers by severity, type, or reporting AP.
For each AP listed in Cisco PI, a column mentions if CleanAir is enabled for this AP on the WLC.
The situation is even simpler on DNAC. The Health and Issues pages focus on the consequences of interferers (that is, high radio utilization or poor RF). Interferers are not reported as individual objects but as a possible root cause of detected issues. As such, interferers with little to no impact do not clog the interface and are not mentioned.
However, for each AP, in the AP 360 page, on the RF tab, you can see a graph with the Air Quality reported by this AP for each radio over the monitored period. When the AQI is less than 100, you can hover over the affected time interval to see the details of the associated interferer.
Summary
This chapter addressed the management of reports and alarms in Cisco Prime Infrastructure and DNA Center. It also pointed to tools and resources to help you troubleshoot issues related to client connectivity and RF interferences. In this chapter you have learned the following:
How to configure reports on Cisco Prime Infrastructure
How DNAC continuously produces reports, and how to tailor these reports to your needs
A step-by-step methodology to analyze client connectivity issues
How to use the WLC, Cisco PI, and DNAC tools to evaluate client issues, and how to perform dynamic air captures
How to visualize reports and alarms about RF interferers on the WLC, Cisco PI, and DNAC
How to configure your system to integrate RF interferences into the global RRM scheme
References
For additional information, refer to these resources:
Cisco Prime Infrastructure User Guide, Managing Reports: https://www.cisco.com/c/en/us/td/docs/net_mgmt/prime/infrastructure/3-6/user/guide/bk_CiscoPrimeInfrastructure_3_6_0_UserGuide/bk_CiscoPrimeInfrastructure_3_6_0_UserGuide_chapter_010111.html
Cisco DNAC, Managing Client Health: https://www.cisco.com/c/en/us/td/docs/cloud-systems-management/network-automation-and-management/dna-center-assurance/1-3-1-0/b_cisco_dna_assurance_1_3_1_0_ug/b_cisco_dna_assurance_1_3_1_0_chapter_0111.html
Cisco DNAC Path Trace: https://www.cisco.com/c/en/us/td/docs/cloud-systems-management/network-automation-and-management/dna-center-assurance/1-3-1-0/b_cisco_dna_assurance_1_3_1_0_ug/b_cisco_dna_assurance_1_3_1_0_chapter_01000.html
Cisco DNAC Intelligent Capture: https://www.cisco.com/c/en/us/td/docs/cloud-systems-management/network-automation-and-management/dna-center-assurance/1-3-1-0/b_cisco_dna_assurance_1_3_1_0_ug/b_cisco_dna_assurance_1_3_1_0_chapter_01100.html
Cisco DNAC Sensors and Sensor-Driven Tests: https://www.cisco.com/c/en/us/td/docs/cloud-systems-management/network-automation-and-management/dna-center-assurance/1-3-1-0/b_cisco_dna_assurance_1_3_1_0_ug/b_cisco_dna_assurance_1_3_1_0_chapter_01010.html
Cisco Prime Infrastructure, Troubleshooting Clients: https://www.cisco.com/c/en/us/td/docs/net_mgmt/prime/infrastructure/3-6/user/guide/bk_CiscoPrimeInfrastructure_3_6_0_UserGuide/bk_CiscoPrimeInfrastructure_3_6_0_UserGuide_chapter_010100.html#task_1082131
Cisco C9800, Client Troubleshooting: https://www.cisco.com/c/en/us/support/docs/wireless/catalyst-9800-series-wireless-controllers/213949-wireless-debugging-and-log-collection-on.html
Cisco CleanAir on C9800: https://www.cisco.com/c/en/us/td/docs/wireless/controller/9800/config-guide/b_wl_16_10_cg/cisco-cleanair.html
AireOS Configuration and Troubleshooting Guide: https://www.cisco.com/c/en/us/td/docs/wireless/controller/8-8/config-guide/b_cg88.html
Cisco Identity Solution Engine (ISE) Troubleshooting Client Guide: https://www.cisco.com/c/en/us/td/docs/security/ise/1-2/troubleshooting_guide/ise_tsg.html#pgfId-193059
Exam Preparation Tasks
As mentioned in the section “How to Use This Book” in the Introduction, you have a few choices for exam preparation: the exercises here, Chapter 18, “Final Preparation,” and the exam simulation questions in the Pearson Test Prep Software Online.
Review All Key Topics
Review the most important topics in this chapter, noted with the Key Topic icon in the outer margin of the page. Table 16-2 lists these key topics and the page numbers on which each is found.
Table 16-2 Key Topics for Chapter 16
Key Topic Element |
Description |
Page Number |
|---|---|---|
List |
Report types on Prime Infrastructure |
407 |
Paragraph |
Reports on DNA Center |
412 |
Paragraph |
Rogues |
417 |
List |
Alarm types on PI |
417 |
Paragraph |
Good management vs. bad design |
422 |
Define Key Terms
Define the following key terms from this chapter and check your answers in the glossary: