
Chapter 12. Cisco Unified Computing Infrastructure Monitoring
Today data center architectures are transitioning to highly virtualized, highly dynamic, internal cloud forms. Monitoring activity from the computing perspective is an essential source of operational intelligence. Monitoring tools must provide sufficient capacity and flexibility to handle rapidly growing traffic volumes and a dynamic computing resource. Cisco UCS Monitoring enables the data center administrator to monitor the physical computing environment in conjunction with the virtual environment and helps reduce the corresponding management complexities, thus increasing IT agility.
This chapter covers the following key topics:
• Cisco UCS System Monitoring: This section discusses various UCS monitoring features, including SNMP, Call Home, NetFlow, and traffic monitoring (known as Switched Port Analyzer, or SPAN).
• Cisco Intersight: This section covers the Cisco Intersight Software-as-a-Service management platform, which provides global management of the Cisco Unified Computing System (UCS) and Cisco HyperFlex hyperconverged infrastructure anywhere.
“Do I Know This Already?” Quiz
The “Do I Know This Already?” quiz enables you to assess whether you should read this entire chapter thoroughly or jump to the “Exam Preparation Tasks” section. If you are in doubt about your answers to these questions or your own assessment of your knowledge of the topics, read the entire chapter. Table 12-1 lists the major headings in this chapter and their corresponding “Do I Know This Already?” quiz questions. You can find the answers in Appendix A, “Answers to the ‘Do I Know This Already?’ Quizzes.”
Table 12-1 “Do I Know This Already?” Section-to-Question Mapping”

Caution
The goal of self-assessment is to gauge your mastery of the topics in this chapter. If you do not know the answer to a question or are only partially sure of the answer, you should mark that question as wrong for purposes of the self-assessment. Giving yourself credit for an answer you correctly guess skews your self-assessment results and might provide you with a false sense of security.
1. What types of UCS interfaces support a traffic monitoring session? (Choose two answers).
a. Ethernet
b. vNIC
c. Fiber Channel
d. FCoE Port
2. If you suspect some changes have been made to the UCS configuration and want to check who initiated them, what log do you check?
a. Syslog
b. System event logs
c. SNMP
d. Audit logs
3. The UCS system event log resides on the Cisco Integrated Management Controller (CIMC) in NVRAM. What will happen if the logs reach their maximum file limits?
a. The system event log (SEL) will be rotated, and the old log will be archived automatically.
b. The system event log file has circular logging, which means that new data will delete the old data.
c. No further events can be recorded when the logs are full, unless files are backed up and cleared manually or via policy.
d. Files will be deleted, and the system event log will be lost.
4. Which Cisco Intersight license required for on-premises server (an Intersight virtual appliance)? (Choose two answers.)
a. Standard
b. Essential
c. Advance
d. Base
5. What is the Intersight upgrade process?
a. Manually download the upgrade files from Cisco.com, upload them to the Intersight server via SCP or SFTP, and run the command-line interface (CLI) command to update the server.
b. Upgrades to Cisco Intersight are delivered automatically without requiring the resources of traditional management tool upgrades and disruption to your operations.
c. Manually download the upgrade files from Cisco.com, and then use the browser to upload the files and upgrade the server.
d. Only the Cisco Technical Assistance Center (TAC) can upgrade the Intersight server.
Foundation Topics
Cisco UCS System Monitoring
The Cisco Unified Computing System (UCS) Manager can detect all system faults. Normally, system faults are categorized as critical, major, minor, and warnings. Cisco recommends that you monitor all critical and major severity faults. As in Cisco NX-OS, the Cisco UCS supports different monitoring protocols, such as standard syslog, SNMP, NetFlow, Call Home, and SPAN traffic monitoring. In addition, the Cisco UCS provides monitoring for the computing environment, such as XML application programming interface (API), audit logs, statistics collection, database health monitoring, and computing hardware monitoring.
The Cisco UCS Manager core is made up of three elements: the data management engine, application gateway, and user-accessible northbound interface. The northbound interface is composed of SNMP, syslog, XML API, and UCSM CLI.
You can monitor the Cisco UCS Manager servers through XML API, SNMP, and syslog. Both SNMP and syslog are interfaces used only for monitoring because they are read-only, so no configuration changes are allowed from these interfaces. Alternatively, the XML API is a monitoring interface that is read-write, which allows you to monitor the Cisco UCS Manager and change the configuration if needed. Figure 12-1 shows the core and monitoring interfaces.

Figure 12-1 Cisco UCS Manager Core and Monitoring Interfaces
Data Management Engine
The data management engine (DME) is the center of the Cisco UCS Manager system, which maintains the following components:
• The Cisco UCS XML database, which houses the inventory database of all physical elements (blade and rack mount servers, chassis, modules, and fabric interconnects)
• The logical configuration data for profiles, policies, pools, vNIC, and vHBA templates
• The various networking-related configuration details like VLANs, VSANs, port channels, network uplinks, and server downlinks
The DME monitors
• The current health and state of all components of all physical and logical elements in a Cisco UCS domain
• The transition information of all finite state machine (FSM) tasks occurring
The Cisco UCS XML database stores only the current inventory, health, and managed endpoints config information, resulting in near real time XML data file. By default, the DME does not store a historical log of faults that have occurred on a Cisco UCS domain. As fault conditions are raised on the endpoints, the DME creates faults in the Cisco UCS XML database. As those faults are mitigated, the DME clears and removes the faults from the Cisco UCS XML database.
Application Gateway
Application gateways (AGs) are software agents that communicate directly with the endpoints to relay the health and state of the endpoints to the DME. AG-managed endpoints include servers, chassis, modules, fabric extenders, fabric interconnects, and NX-OS. The AGs actively monitor the server through the IPMI and SELs using the Cisco Integrated Management Controller (CIMC). They provide the DME with the health, state, configuration, and potential fault conditions of a device. The AGs manage configuration changes from the current state to the desired state during FSM transitions when changes are made to the Cisco UCS XML database.
The module AG and chassis AG communicate with the chassis management controller (CMC) to get information about the health, state, configuration, and fault conditions observed by the CMC. The fabric interconnect NX-OS AG communicates directly with NX-OS to get information about the health, state, configuration, statistics, and fault conditions observed by NX-OS on the fabric interconnects. All AGs provide inventory details about the endpoints to the DME during the various discovery processes. The AGs perform the state changes necessary to configure endpoints during FSM-triggered transitions, monitor the health and state of the endpoints, and notify the DME of any faults.
Northbound Interfaces
The northbound interfaces include SNMP, syslog, CLI, and XML API. The XML API present in the Apache web server layer sends login, logout, query, and configuration requests using HTTP or HTTPS. SNMP and syslog are both consumers of data from the DME.
SNMP INFORMs and TRAPs are translated directly from the fault information stored in the Cisco UCS XML database. SNMP GET requests are sent through the same object translation engine in reverse, where the DME receives a request from the object translation engine. The data is translated from the XML database to an SNMP response.
Syslog messages use the same object translation engine as SNMP, where the source of the data (faults, events, audit logs) is translated from XML into a Cisco UCS Manager–formatted syslog message.
![]()
Cisco UCS Monitoring Events and Logs
The Cisco UCS Manager generates system log, or syslog, messages to record the following incidents that take place in the Cisco UCS Manager system:
• Routine system operations
• Failures and errors
• Critical and emergency conditions
There are three kinds of syslog entries: Fault, Event, and Audit. Each syslog message identifies the Cisco UCS Manager process that generated the message and provides a brief description of the operation or error that occurred. The syslog is useful both in routine troubleshooting, incident handling, and management.
The Cisco UCS Manager collects and logs syslog messages internally. Also, you can send them to external syslog servers running a syslog daemon. Logging to a central syslog server helps in aggregation of logs and alerts. Some syslog messages include DIMM problems, equipment failures, thermal problems, voltage problems, power problems, high availability (HA) cluster problems, and link failures.
Syslog messages contain event codes and fault codes. To monitor syslog messages, you can define syslog message filters. These filters can parse the syslog messages based on the criteria you choose. You can use the following criteria to define a filter:
• By event or fault codes: Define a filter with a parsing rule to include only the specific codes that you intend to monitor. Messages that do not match these criteria are discarded.
• By severity level: Define a filter with a parsing rule to monitor syslog messages with specific severity levels. You can set syslog severity levels individually for OS functions, to facilitate logging and display of messages ranging from brief summaries to detailed information for debugging.
Cisco devices can send their log messages to a UNIX-style syslog service. A syslog service simply accepts messages and then stores them in files or prints them according to a simple configuration file. This form of logging is the best available for Cisco devices because it can provide protected long-term storage of logs. Figure 12-2 shows UCS syslog configurations.
![]()

Figure 12-2 UCS Syslog Configurations
UCS will generate system event logs (SELs) as well. An SEL is used for troubleshooting system health. It records most server-related events, such as instances of over- or under-voltage, temperature events, fan events, and BIOS events. The types of events supported by SEL include BIOS events, memory unit events, processor events, and motherboard events.
The SELs are stored in the CIMC NVRAM, through an SEL log policy. It is best practice to periodically download and clear the SELs. The SEL file is approximately 40 KB in size, and no further events can be recorded after it is full. It must be cleared before additional events can be recorded.
You can use the SEL policy to back up the SEL to a remote server and optionally to clear the SEL after a backup operation occurs. Backup operations can be triggered based on specific actions, or they can be set to occur at regular intervals. You can also manually back up or clear the SEL. Figure 12-3 shows UCS SEL configurations for specific chassis because SELs will be saved in CIMC NVRAM.

Figure 12-3 UCS System Event Logs
The backup file is automatically generated. The filename format is sel-SystemName-ChassisID-ServerID-ServerSerialNumber-Timestamp—for example, sel-UCS-A-ch01-serv01-QCI12522939-20091121160736.
Because the UCS is a computer device, it will record any user activity. Audit logs record system events that occurred, where they occurred, and which users initiated them, as shown in Figure 12-4.
![]()

Figure 12-4 UCS Audit Logs
Cisco UCS Monitoring Policies
Cisco UCS has two monitoring policies. The first monitoring policy is fault collection and suppression; this global fault policy controls the life cycle of a fault in a Cisco UCS domain, including when faults are cleared, the flapping interval (the length of time between the fault being raised and the condition being cleared), and the retention interval (the length of time a fault is retained in the system), as shown in Figure 12-5.

Figure 12-5 UCS Fault Collection and Suppression Policies
A fault in Cisco UCS has the following life cycle:
1. A condition occurs in the system, and the Cisco UCS Manager raises a fault. This is the active state.
2. When the fault is alleviated, it enters a flapping or soaking interval that is designed to prevent flapping. Flapping occurs when a fault is raised and cleared several times in rapid succession. During the flapping interval, the fault retains its severity for the length of time specified in the global fault policy.
3. If the condition reoccurs during the flapping interval, the fault returns to the active state. If the condition does not reoccur during the flapping interval, the fault is cleared.
4. The cleared fault enters the retention interval. This interval ensures that the fault reaches the attention of an administrator even if the condition that caused the fault has been alleviated and the fault has not been deleted prematurely. The retention interval retains the cleared fault for the length of time specified in the global fault policy.
5. If the condition reoccurs during the retention interval, the fault returns to the active state. If the condition does not reoccur, the fault is deleted.
The second monitoring policy is the statistics collection policy, which defines how frequently statistics are collected (collection interval) and how frequently they are reported (reporting interval). Reporting intervals are longer than collection intervals so that multiple statistical data points can be collected during the reporting interval. This provides the Cisco UCS Manager with sufficient data to calculate and report minimum, maximum, and average values.
For NIC statistics, the Cisco UCS Manager displays the average, minimum, and maximum of the change since the last collection of statistics. If the values are 0, there has been no change since the last collection.
As shown in Figure 12-6, statistics can be collected and reported for the following five functional areas of the Cisco UCS system:
• Adapter: Statistics related to the adapters
• Chassis: Statistics related to the chassis
• Host: A placeholder for future support
• Port: Statistics related to the ports, including server ports, uplink Ethernet ports, and uplink Fibre Channel ports
• Server: Statistics related to servers
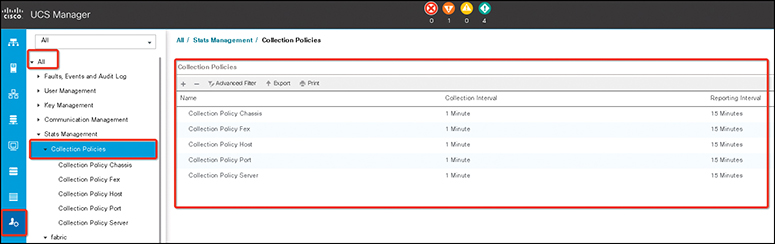
Figure 12-6 UCS Collection Policies
Note
The Cisco UCS Manager has one default statistics collection policy for each of the five functional areas. You cannot create additional statistics collection policies, and you cannot delete the existing default policies. You can only modify the default policies.
The values that are displayed for the delta counter in the Cisco UCS Manager are calculated as the difference between the last two samples in a collection interval. In addition, the Cisco UCS Manager displays the average, minimum, and maximum delta values of the samples in the collection interval.
Cisco UCS Simple Network Management Protocol
The Simple Network Management Protocol (SNMP) is an application layer protocol that provides a message format for communication between SNMP managers and agents. SNMP provides a standardized framework and a common language for monitoring and managing devices in a network:
• SNMP functional overview
• SNMP notifications
• SNMP security levels and privileges
• Supported combinations of SNMP security models and levels
• SNMPv3 security features
• SNMP support in Cisco UCS (Figure 12-7 shows a UCS Manager SNMP configuration example)
![]()
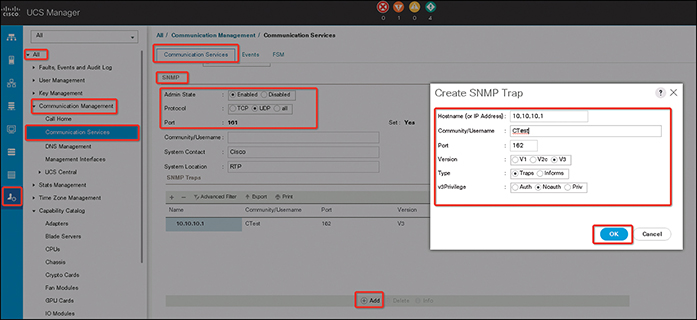
Figure 12-7 UCS SNMP Configuration Example
Cisco UCS SNMP framework consists of three parts:
• An SNMP manager: The system used to control and monitor the activities of network devices using SNMP.
• An SNMP agent: SNMP agent is the software component within Cisco UCS, that maintains the data for Cisco UCS, and reports this data as needed, to the SNMP manager. Cisco UCS includes the agent and a collection of MIBs (management Information base). To enable the SNMP agent and create the relationship between the manager and agent, enable and configure SNMP in the Cisco UCS Manager.
• A management information base (MIB): The collection of managed objects on the SNMP agent.
Cisco UCS Call Home and Smart Call Home
Call Home provides an email-based notification for critical system policies. A range of message formats is available for compatibility with pager services or XML-based automated parsing applications. You can use this feature to page a network support engineer, email a network operations center, or use Cisco Smart Call Home services to generate a case with the Technical Assistance Center (TAC).
The Call Home feature can deliver alert messages containing information about diagnostics and environmental faults, and events also can deliver alerts to multiple recipients. Each profile includes configurable message formats and content categories. A predefined destination profile is provided for sending alerts to the Cisco TAC, but you also can define your own destination profiles.
When you configure Call Home to send messages (see Figure 12-8), the Cisco UCS Manager executes the appropriate CLI show command and attaches the command output to the message.
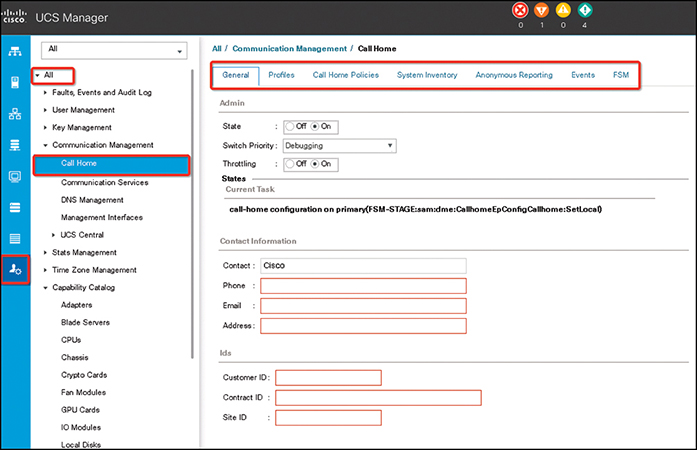
Figure 12-8 Cisco UCS Call Home Configuration Example
Cisco UCS delivers Call Home messages in the following formats:
• Short text format, which provides a one- or two-line description of the fault that is suitable for pagers or printed reports.
• Full text format, which provides fully formatted messages with detailed information that is suitable for human reading.
• XML machine-readable format, which uses Extensible Markup Language (XML) and Adaptive Messaging Language (AML) XML Schema Definition (XSD). The AML XSD is published on the Cisco.com website. The XML format enables communication with the Cisco Systems Technical Assistance Center.
![]()
Cisco UCS Manager Database Health and Hardware Monitoring
The Cisco UCS Manager uses the SQLite database stored on the fabric interconnects to persist configuration and inventory. Data corruption on both the Flash and NVRAM storage devices can cause failures and loss of customer configuration data. The Cisco UCS Manager provides several proactive health check and recovery mechanisms to improve the integrity of the Cisco UCS Manager database. These mechanisms enable active monitoring of the database health:
• Periodic health check: A periodic check of database integrity ensures that any corruption is caught and recovered proactively.
• Periodic backup: A periodic internal full state backup of the system ensures a smoother route to recovery in the case of any unrecoverable errors.
Example 12-1 shows the command-line interface to change the time interval for the health check to run every two days and commits the transaction.
Example 12-1 UCS CLI Configuration to Change the Health Check Interval
UCS-A# scope system
UCS-A /system # set mgmt-db-check-policy health-check-interval 2
UCS-A /system* # commit-buffer
UCS-A /system #
The Cisco UCS consists of different hardware components; the Cisco UCS Manager provides hardware monitoring for the following components (see Figure 12-9):
• Monitoring a fabric interconnect
• Monitoring a blade server
• Monitoring a rack-mount server
• Monitoring an IO module
• Managing the interface’s monitoring policy
• Monitoring local storage
• Managing transportable flash module and supercapacitor
• Monitoring the trusted platform module (TPM)
![]()

Figure 12-9 UCS Hardware Health Report
Cisco UCS NetFlow Monitoring
NetFlow is a standard network protocol for collecting IP traffic data. NetFlow enables you to define a flow in terms of unidirectional IP packets that share certain characteristics. All packets that match the flow definition are collected and exported to one or more external NetFlow Collectors, where they can be further aggregated, analyzed, and used for application-specific processing.
The Cisco UCS Manager uses NetFlow-capable adapters (Cisco UCS VIC 1240, Cisco UCS VIC 1280, Cisco UCS VIC 1225, Cisco UCS VIC 1300 Series, and Cisco UCS VIC 1440 Series) to communicate with the routers and switches that collect and export flow information.
Note
NetFlow monitoring is not supported on Cisco UCS 6454 Fabric Interconnects. Also, for Release 3.0(2), NetFlow monitoring is supported for end-host mode only.
NetFlow components include
• Network flows: A flow is a set of unidirectional IP packets that have common properties such as the source or destination of the traffic, routing information, and protocol used. Flows are collected when they match the definitions in the flow record definition.
• Flow record definitions: A flow record definition contains information about the properties used to define the flow, which can include both characteristic properties and measured properties. Characteristic properties, also called flow keys, are the properties that define the flow. The Cisco UCS Manager supports IPv4, IPv6, and Layer 2 keys. Measured characteristics, also called flow values or nonkeys, are measurable values such as the number of bytes contained in all packets of the flow or the total number of packets.
A flow record definition is a specific combination of flow keys and flow values. The two types of flow record definitions are
• System-defined: Default flow record definitions supplied by the Cisco UCS Manager
• User-defined: Flow record definitions that you can create yourself
• Flow exporters, flow exporter profiles, and flow collectors: Flow exporters transfer the flows to the flow connector based on the information in a flow exporter profile. The flow exporter profile contains the networking properties used to export NetFlow packets. The networking properties include a VLAN, the source IP address, and the subnet mask for each fabric interconnect.
Note
In the Cisco UCS Manager GUI, the networking properties are defined in an exporter interface that is included in the profile. In the Cisco UCS Manager CLI, the properties are defined in the profile.
Flow collectors receive the flows from the flow exporter. Each flow collector contains an IP address, port, external gateway IP, and VLAN that defines where the flows are sent.
• Flow monitors and flow monitor sessions: A flow monitor consists of a flow definition, one or two flow exporters, and a timeout policy(see Figure 12-10). You can use a flow monitor to specify which flow information you want to gather and where you want to collect it from. Each flow monitor operates in either the egress or ingress direction.
![]()
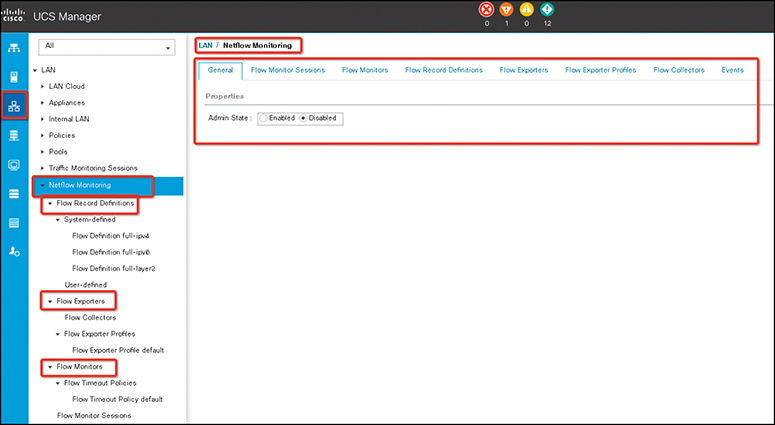
Figure 12-10 UCS NetFlow Configuration Example
A flow monitor session contains up to four flow monitors—two flow monitors in the ingress direction and two flow monitors in the egress direction. A flow monitor session can also be associated with a vNIC.
Traffic Monitoring
Today the infrastructure in data centers is distributed. With layers of virtual and physical devices and systems, the data center infrastructure has become more complex to troubleshoot. The accelerating adoption of IP-based services like cloud computing, virtual desktop infrastructure, and unified communications has further compounded this complexity, massively increasing the scope of the network. As a result, network or application problems could have a major impact on business operations.
Network administrators will need better visibility into network traffic across the data center infrastructure. Traffic visibility will improve troubleshooting and help you find the root cause of network problems. Because network performance has become more critical, if network performance drops even slightly, IP-based services will start to fail. Consequently, poor network performance has the potential to cause outages across the data center, with unpredictable and unpleasant results.
Network administrators can use traffic monitoring to detect, diagnose, and resolve network performance issues. The Cisco UCS Manager offers traffic monitoring that copies traffic from one or more source ports and sends the copied traffic to a dedicated destination port for analysis by a network analyzer. This feature is also known as Switched Port Analyzer (SPAN).
There are two types of monitoring sessions:
• Ethernet
• Fibre Channel
The type of destination port determines what kind of monitoring session you need. For an Ethernet traffic monitoring session, the destination port must be an unconfigured physical port. For a Fibre Channel traffic monitoring session, the destination port must be a Fibre Channel uplink port, except when you are using Cisco UCS 6454 Fabric Interconnects and 6300 Series Fabric Interconnects.
Note
For Cisco UCS 6332, 6332-16UP, and 6454 Fabric Interconnects, you cannot choose Fibre Channel destination ports. The destination port must be an unconfigured physical Ethernet port.
![]()
Traffic Monitoring Across Ethernet
An Ethernet traffic monitoring session can monitor any of the source and destination ports listed in Table 12-2.
![]()
Table 12-2 UCS Ethernet Traffic Monitoring Ports

Note
All traffic sources must be located within the same switch as the destination port. A port configured as a destination port cannot also be configured as a source port. A member port of a port channel cannot be configured individually as a source. If the port channel is configured as a source, all member ports are source ports.
A server port can be a source only if it is a nonvirtualized rack server adapter-facing port.
• Traffic monitoring for Cisco UCS 6454 Interconnects
• Cisco UCS 6454 does not support a Fibre Channel port as a destination port. Therefore, an Ethernet port is the only option for configuring any traffic monitoring session on this fabric interconnect.
• Cisco UCS 6454 supports monitoring traffic in the transmit direction for more than two sources per fabric interconnect.
• You can monitor or use SPAN on port channel sources for traffic in the transmit and receive directions.
• You can configure a port as a destination port for only one monitor session.
• You can monitor the port channel as a source in the transmit direction.
• You cannot monitor vEth as a source in the transmit direction.
• Traffic monitoring for Cisco UCS 6300 Interconnects
• Cisco UCS 6300 Fabric Interconnect supports port-based mirroring.
• Cisco UCS 6300 Fabric Interconnect supports VLAN SPAN only in the receive direction.
• Ethernet SPAN is a port based on the Cisco UCS 6300 Fabric Interconnect.
• Traffic monitoring for Cisco UCS 6200 Interconnects
• Cisco UCS 6200 and 6324 support monitoring traffic in the transmit direction for up to two sources per fabric interconnect.
• Cisco UCS 6200 SPAN traffic is rate-limited by the SPAN destination port speed. This can be either 1 or 10 Gbps.
Note
(For 6200 and 6324 Fabric Interconnects) You can monitor or use SPAN on port channels only for ingress traffic.
Traffic Monitoring Across Fibre Channel
You can monitor Fibre Channel traffic using either a Fibre Channel traffic analyzer or an Ethernet traffic analyzer. When Fibre Channel traffic is monitored with an Ethernet traffic monitoring session, at an Ethernet destination port, the destination traffic is FCoE. The Cisco UCS 6300 Fabric Interconnect supports FC SPAN only on the ingress side. A Fibre Channel port on a Cisco UCS 6248 Fabric Interconnect cannot be configured as a source port.
A Fibre Channel traffic monitoring session can monitor any source and destination ports listed in Table 12-3.
![]()
Table 12-3 UCS Fiber Channel Traffic Monitoring Ports

When configuring or activating traffic monitoring, consider the following points:
• Traffic monitoring sessions: A traffic monitoring session is disabled by default when created. To begin monitoring traffic, first activate the session. A traffic monitoring session must be unique on any fabric interconnect within the Cisco UCS pod. Create each monitoring session with a unique name and unique VLAN source. To monitor traffic from a server, add all vNICs from the service profile corresponding to the server.
• Maximum number of supported active traffic monitoring sessions per fabric interconnect: You can create and store up to 16 traffic monitoring sessions, but only four can be active at the same time. For each Cisco UCS 6454 and 6300 Fabric Interconnect, you can monitor only up to four traffic directions. The receive and transmit directions each count as one monitoring session, while the bidirectional monitoring session is counted as two. For example:
• Four active sessions: If each session is configured to monitor traffic in only one direction
• Two active sessions: If each session is configured to monitor traffic bidirectionally
• Three active sessions: If one session is unidirectional and the second session is bidirectional
Note
Traffic monitoring can impose a significant load on your system resources. To minimize the load, select sources that carry as little unwanted traffic as possible and disable traffic monitoring when it is not needed.
• vNIC: Because a traffic monitoring destination is a single physical port, a traffic monitoring session can monitor only a single fabric. To monitor uninterrupted vNIC traffic across a fabric failover, create two sessions, one per fabric, and connect two analyzers. Add the vNIC as the traffic source using the exact same name for both sessions. If you change the port profile of a virtual machine, any associated vNICs being used as source ports are removed from monitoring, and you must reconfigure the monitoring session. If a traffic monitoring session was configured on a dynamic vNIC under a release earlier than the Cisco UCS Manager Release 2.0, you must reconfigure the traffic monitoring session after upgrading. Cisco UCS 6200 supports traffic monitoring from a vNIC in the transmit direction. However, Cisco UCS 6454 does not support traffic monitoring traffic from a vNIC in the transmit direction.
• vHBA: A vHBA can be a source for either an Ethernet or Fibre Channel monitoring session, but it cannot be a source for both simultaneously. When a vHBA is set as the SPAN source, the SPAN destination receives only VN-tagged frames. It does not receive direct FC frames. Cisco UCS 6200 supports traffic monitoring from a vHBA in the transmit direction. However, Cisco UCS 6454 does not support traffic monitoring traffic from a vHBA in the transmit direction.
The following steps show how to create an Ethernet traffic monitoring session:
Step 1. In the Navigation pane, click LAN, then from the LAN tab, expand LAN > Traffic Monitoring Sessions > Fabric_Interconnect_Name.
Step 2. Click Add to open the Create Traffic Monitoring Session dialog. Then complete the fields in Table 12-4.
Table 12-4 Ethernet Traffic Monitoring Session Fields

Step 3. Click OK (see Figure 12-11).
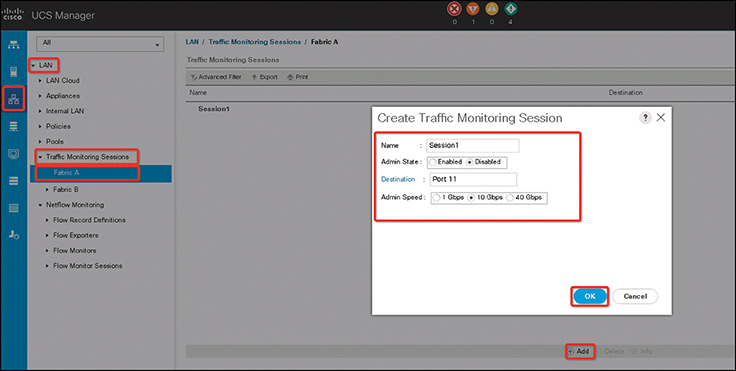
Figure 12-11 Creating a UCS Ethernet Traffic Monitoring Session
The following steps show how to create a Fibre Channel traffic monitoring session:
Step 1. In the Navigation pane, click SAN. Then expand SAN > Traffic Monitoring Sessions > Fabric_Interconnect_Name.
Step 2. Right-click Fabric_Interconnect_Name and choose Create Traffic Monitoring Session.
Step 3. In the Create Traffic Monitoring Session dialog box, complete the fields shown in Table 12-5.
Table 12-5 SAN Traffic Monitoring Session Fields

Step 4. Click OK (see Figure 12-12).

Figure 12-12 Creating UCS SAN Traffic Monitoring Session
The following steps show how to add traffic sources to a monitoring session. You can choose multiple sources from more than one source type to be monitored by a traffic monitoring session. The available sources depend on the components configured in the Cisco UCS domain.
Note
This procedure describes how to add sources for Ethernet traffic monitoring sessions. To add sources for a Fibre Channel monitoring session, select the SAN tab instead of the LAN tab in step 2.
Step 1. Make sure that a traffic monitoring session must be created.
Step 2. In the Navigation pane, click LAN. Then expand LAN > Traffic Monitoring Sessions > Fabric_Interconnect_Name.
Step 3. Expand Fabric_Interconnect_Name and click the monitor session that you want to configure. Then in the Work pane, click the General tab.
Step 4. In the Sources area, expand the section for the type of traffic source that you want to add.
Step 5. To see the components that are available for monitoring, click the + button to open the Add Monitoring Session Source dialog box.
Step 6. Select a source component and click OK. You can repeat the preceding three steps as needed to add multiple sources from multiple source types. Then click Save to save the changes (see Figure 12-13).

Figure 12-13 Adding Source Port (vNIC) to an Existing Traffic Monitoring Session
The following steps show how to activate and deactivate a traffic monitoring session.
Note
This procedure describes how to activate an Ethernet traffic monitoring session. To activate a Fibre Channel monitoring session, select the SAN tab instead of the LAN tab in step 1.
Step 1. In the Navigation pane, click LAN. Then expand LAN > Traffic Monitoring Sessions > Fabric_Interconnect_Name.
Step 2. Expand Fabric_Interconnect_Name and click the monitor session that you want to activate or deactivate.
Step 3. In the Work pane, click the General tab. Then in the Properties area, click the Enabled or Disabled radio button for Admin State.
Step 4. Click Save Changes (see Figure 12-14).

Figure 12-14 Activating a Traffic Monitoring Session
Cisco Intersight
Cisco Intersight provides intelligent cloud-based infrastructure management with embedded analytics for the Cisco Unified Computing System (UCS) and Cisco HyperFlex platforms.
Intersight provides management as a service and is designed to be easy to implement and scale. Cisco UCS and Cisco HyperFlex systems are fully programmable infrastructures with a unified API, as illustrated in Figure 12-15. Cisco Intersight is API driven, so the platform and the connected systems are DevOps-enabled to facilitate continuous delivery. Users from operations and development teams can access the platform through portals that are designed for various personas.
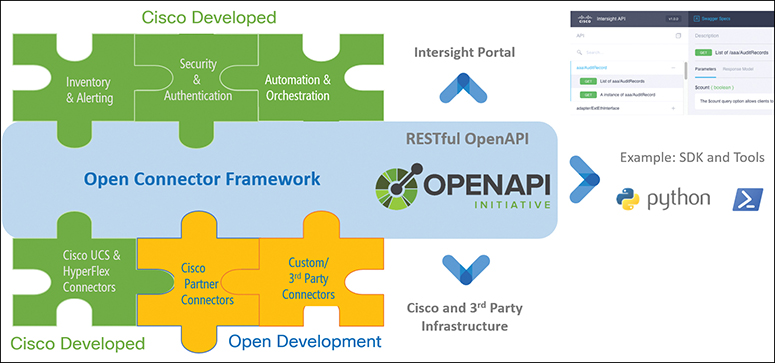
Figure 12-15 Intersight Programmable Infrastructure
This platform enables IT organizations to analyze, simplify, and automate their environments in ways that were not possible with prior generations of tools. This capability empowers organizations to deliver applications faster, so they can support new business initiatives.
Cisco UCS and Cisco HyperFlex platforms use model-based management to provision servers and the associated storage and fabric automatically, regardless of form factor. Cisco Intersight works in conjunction with the Cisco UCS Manager and Cisco Integrated Management Controller. By simply associating a model-based configuration with a resource through server profiles, your IT staff can consistently align policy, server personality, and workloads. These policies can be created once and used by IT staff with minimal effort to deploy servers. The result is improved productivity and compliance and lower risk of failures due to inconsistent configuration.
Cisco Intersight will be integrated with data center and hybrid-cloud platforms and services to securely deploy and manage infrastructure resources across data center and edge environments. In addition, Cisco will provide future integrations to third-party operations tools to allow customers to use their existing solutions more effectively.
Cisco Intersight offers flexible deployment either as Software as a Service (SaaS) on Intersight.com or running on your premises with the Cisco Intersight virtual appliance. The virtual appliance provides users with the benefits of Cisco Intersight while allowing more flexibility for those with additional data locality and security requirements.
![]()
Intersight Management as a Service
Cisco Intersight builds on the Cisco UCS and Cisco HyperFlex platforms to provide an intuitive infrastructure with cloud-powered intelligence. Instead of managing from your own on-site system management console, you can use Cisco’s cloud-based management platform at Intersight.com or through the Cisco Intersight virtual appliance. This capability allows you to focus on managing your systems rather than your management tools. It also allows you to take advantage of new features as they become available from Cisco. In addition, Cisco Intersight allows you to manage systems both in your data center and at remote edge and branch office locations.
Following are Cisco Intersight features and benefits:
• Unified management
• Simplify Cisco UCS and Cisco HyperFlex management with a single management platform.
• Increase scale across data centers and remote locations without additional complexity.
• Use a single dashboard to monitor Cisco UCS and Cisco HyperFlex systems.
• The Cisco UCS Manager, Cisco IMC software, Cisco HyperFlex Connect, and Cisco UCS Director tunneling allow access to element managers that do not have local network access.
• Configuration, provisioning, and server profiles
• Treat Cisco UCS servers and storage as infrastructure resources that can be allocated and reallocated among application workloads for more dynamic and efficient use of server capacity.
• Create multiple server profiles with just a few clicks or through the available API, automating the provisioning process.
• Clone profiles to quickly provision Cisco UCS C-Series servers in standalone mode.
• Create, deploy, and manage your Cisco HyperFlex configurations.
• Ensure consistency and eliminate configuration drift, maintaining standardization across many systems.
• Inventory information and status
• Display and report inventory information for Cisco UCS and Cisco HyperFlex systems.
• Use global search to rapidly identify systems based on names, identifiers, and other information.
• Use tagging to associate custom attributes with systems.
• Monitor Cisco UCS and Cisco HyperFlex server alerts and health status across data centers and remote locations.
• View your Cisco HyperFlex configurations.
• Track and manage firmware versions across all connected Cisco UCS and Cisco HyperFlex systems.
• Track and manage software versions and automated patch updates for all claimed Cisco UCS Director software installations.
• Enhanced support experience
• Get automated alerts about failure notifications.
• Automate the generation and forwarding of technical support files to the Cisco Technical Assistance Center to accelerate the troubleshooting process.
• Open API
• A RESTful API supports the OpenAPI Specification (OAS) to provide full programmability and deep integrations systems.
• The Python and PowerShell SDKs enable integrations with Ansible, Chef, Puppet, and other DevOps and IT Operations Management (ITOM) tools.
• Seamless integration and upgrades
• Upgrades are available for Cisco UCS, Cisco HyperFlex systems, and Cisco UCS Director software running supported firmware and software versions.
• Upgrades to Cisco Intersight are delivered automatically without requiring the resources of traditional management tool upgrades and disruption to your operations.
![]()
Intersight as a Telemetry Data Collection
To support the complex environments created by modern applications and the dramatically increasing number of endpoints, enterprises require analytics integrated tightly with their operations management tools. To enable these analytics capabilities, Cisco UCS servers, Cisco HyperFlex systems, and Cisco UCS Director software are configured to automatically connect and transmit to Cisco Intersight certain telemetry information (including server serial numbers and IP addresses, the types of software installed on an endpoint, and feature use data; see Figure 12-16). This telemetry information will be used to power the Cisco Intersight recommendation engine. The Cisco Intersight recommendation engine will use the telemetry information to proactively review customer metadata to identify potential issues in customers’ environments to prevent problems and improve system uptime in the future.

Figure 12-16 Intersight Dashboard
Cisco Intersight Supported Software
Cisco Intersight supports Cisco UCS and Cisco HyperFlex platforms with the software versions listed in Table 12-6.
Table 12-6 Supported Software

![]()
Cisco Intersight Licensing
Cisco Intersight uses a subscription-based license with multiple editions. Customers can purchase a subscription duration of one, three, or five years and choose the Cisco UCS server volume tier they need for the selected subscription duration.
Cisco UCS server, Cisco HyperFlex system, and Cisco UCS Director software automatically include a Cisco Intersight Base edition at no additional cost when customers access the Cisco Intersight portal and claim the device. In addition, customers can purchase the Cisco Intersight Essentials edition using the Cisco ordering tool (see Table 12-7).
![]()
Table 12-7 Cisco Intersight License Types

![]()
The following steps show the procedure for adding UCS to Cisco Intersight:
Step 1. Log in to Cisco Intersight using the Chrome browser (see Figure 12-17).
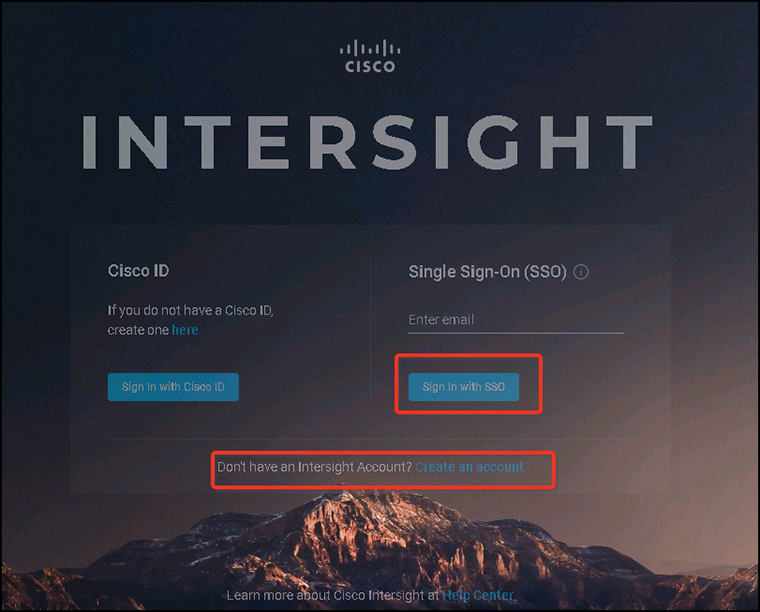
Figure 12-17 Logging In to Cisco Intersight
Step 2. To add Cisco UCS to Intersight, you need the UCS Manager device ID and device claim code. To get these, you need to log in to the UCS Manager then expand Admin > Device Connecter > Connection (see Figure 12-18).
Note
The Device claim code is a token, and its value changes about every 60 seconds. You need to make sure you have the latest code.
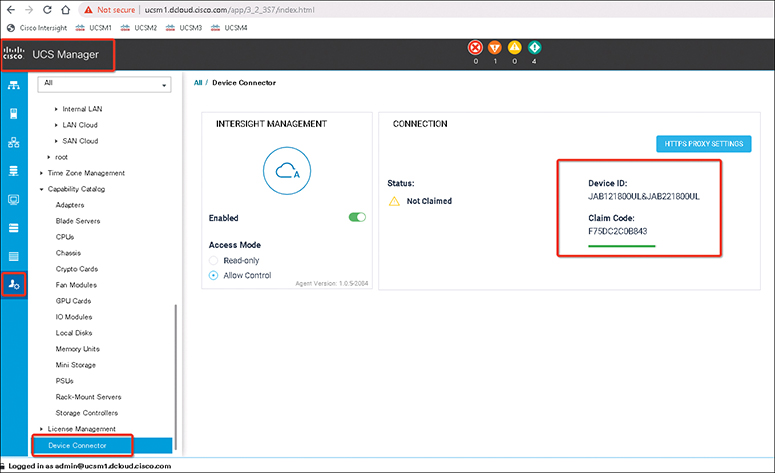
Figure 12-18 UCS Manager Device ID and Device Claim Code
Step 3. To add a new UCS device, on the Devices page, click Claim a New Device (see Figure 12-19). You also need to get the UCS device ID and device claim code (from step 2). Then click Direct Claim.


Figure 12-19 Adding UCS Manager for Intersight Management
Step 4. Verify the device is added and connected to Cisco Insight from the Device page (see Figure 12-20).

Figure 12-20 List of UCS Devices Managed by Intersight
Step 5. Customize the Intersight Dashboard by adding Widgets to or removing them from the portal (see Figure 12-21).

Figure 12-21 Main Intersight Dashboard
Step 6. Verify the server’s inventory and alerts (see Figure 12-22). Make sure all servers are listed and can be managed from Intersight dashboard.

Figure 12-22 An Intersight Device’s Health and Status Information
Exam Preparation Tasks
As mentioned in the section “How to Use This Book” in the Introduction, you have a couple of choices for exam preparation: the exercises here, Chapter 20, “Final Preparation,” and the exam simulation questions in the Pearson Test Prep Software Online.
Review All Key Topics
Review the most important topics in the chapter, noted with the key topic icon in the outer margin of the page. Table 12-8 lists a reference to these key topics and the page numbers on which each is found.
![]()
Table 12-8 Key Topics for Chapter 12

Define Key Terms
Define the following key terms from this chapter and check your answers in the Glossary.
Extensible Markup Language (XML)
application programming interface (API)
UCS Manager (UCSM)
Cisco Integrated Management Controller (CIMC)
nonvolatile random-access memory (NVRAM)
trusted platform module (TPM)
virtual interface card (VIC)
virtual storage-area network (VSAN)
Software as a Service (SaaS)
software development kit (SDK)
DevOps
dual in-line memory module (DIMM)
system event log (SEL)
Cisco NX-OS
Cisco Nexus
References
Cisco UCS Manager Administration Management Guide 4.0: https://www.cisco.com/c/en/us/td/docs/unified_computing/ucs/ucs-manager/GUI-User-Guides/Admin-Management/4-0/b_Cisco_UCS_Admin_Mgmt_Guide_4-0/b_Cisco_UCS_Admin_Mgmt_Guide_4-0_chapter_01.html
Cisco Intersight Data Sheet: https://www.cisco.com/c/en/us/products/collateral/servers-unified-computing/intersight/datasheet-c78-739433.html
Cisco Intersight Help Center: https://intersight.com/help