Chapter 1. Introduction
In 1987, Robert M. Solow, an economist at the Massachusetts Institute of Technology, received the Nobel Prize in economics for his work in determining the sources of economic growth. Professor Solow concluded that the bulk of an economy’s growth is the result of technological advances.
It is reasonable to conclude that the growth of an industry is also dependent on technological advances. This is especially true in the chemical industry, which is entering an era of more complex processes: higher pressure, more reactive chemicals, and exotic chemistry.
More complex processes require more complex safety technology. Many industrialists even believe that the development and application of safety technology is actually a constraint on the growth of the chemical industry.
As chemical process technology becomes more complex, chemical engineers will need a more detailed and fundamental understanding of safety. H. H. Fawcett said, “To know is to survive and to ignore fundamentals is to court disaster.”1 This book sets out the fundamentals of chemical process safety.
Since 1950, significant technological advances have been made in chemical process safety. Today, safety is equal in importance to production and has developed into a scientific discipline that includes many highly technical and complex theories and practices. Examples of the technology of safety include
• Hydrodynamic models representing two-phase flow through a vessel relief
• Dispersion models representing the spread of toxic vapor through a plant after a release, and
• Mathematical techniques to determine the various ways that processes can fail and the probability of failure
Recent advances in chemical plant safety emphasize the use of appropriate technological tools to provide information for making safety decisions with respect to plant design and operation.
The word “safety” used to mean the older strategy of accident prevention through the use of hard hats, safety shoes, and a variety of rules and regulations. The main emphasis was on worker safety. Much more recently, “safety” has been replaced by “loss prevention.” This term includes hazard identification, technical evaluation, and the design of new engineering features to prevent loss. The subject of this text is loss prevention, but for convenience, the words “safety” and “loss prevention” will be used synonymously throughout.
Safety, hazard, and risk are frequently used terms in chemical process safety. Their definitions are
• Safety or loss prevention: the prevention of accidents through the use of appropriate technologies to identify the hazards of a chemical plant and eliminate them before an accident occurs.
• Hazard: a chemical or physical condition that has the potential to cause damage to people, property, or the environment.
• Risk: a measure of human injury, environmental damage, or economic loss in terms of both the incident likelihood and the magnitude of the loss or injury.
Chemical plants contain a large variety of hazards. First, there are the usual mechanical hazards that cause worker injuries from tripping, falling, or moving equipment. Second, there are chemical hazards. These include fire and explosion hazards, reactivity hazards, and toxic hazards.
As will be shown later, chemical plants are the safest of all manufacturing facilities. However, the potential always exists for an accident of catastrophic proportions. Despite substantial safety programs by the chemical industry, headlines of the type shown in Figure 1-1 continue to appear in the newspapers.

Figure 1-1. Headlines are indicative of the public’s concern over chemical safety.
1-1. Safety Programs
A successful safety program requires several ingredients, as shown in Figure 1-2. These ingredients are
• System
• Attitude
• Fundamentals
• Experience
• Time
• You
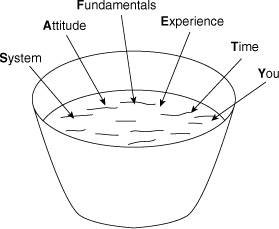
Figure 1-2. The ingredients of a successful safety program.
First, the program needs a system (1) to record what needs to be done to have an outstanding safety program, (2) to do what needs to be done, and (3) to record that the required tasks are done. Second, the participants must have a positive attitude. This includes the willingness to do some of the thankless work that is required for success. Third, the participants must understand and use the fundamentals of chemical process safety in the design, construction, and operation of their plants. Fourth, everyone must learn from the experience of history or be doomed to repeat it. It is especially recommended that employees (1) read and understand case histories of past accidents and (2) ask people in their own and other organizations for their experience and advice. Fifth, everyone should recognize that safety takes time. This includes time to study, time to do the work, time to record results (for history), time to share experiences, and time to train or be trained. Sixth, everyone (you) should take the responsibility to contribute to the safety program. A safety program must have the commitment from all levels within the organization. Safety must be given importance equal to production.
The most effective means of implementing a safety program is to make it everyone’s responsibility in a chemical process plant. The older concept of identifying a few employees to be responsible for safety is inadequate by today’s standards. All employees have the responsibility to be knowledgeable about safety and to practice safety.
It is important to recognize the distinction between a good and an outstanding safety program.
• A good safety program identifies and eliminates existing safety hazards.
• An outstanding safety program has management systems that prevent the existence of safety hazards.
A good safety program eliminates the existing hazards as they are identified, whereas an outstanding safety program prevents the existence of a hazard in the first place.
The commonly used management systems directed toward eliminating the existence of hazards include safety reviews, safety audits, hazard identification techniques, checklists, and proper application of technical knowledge.
1-2. Engineering Ethics
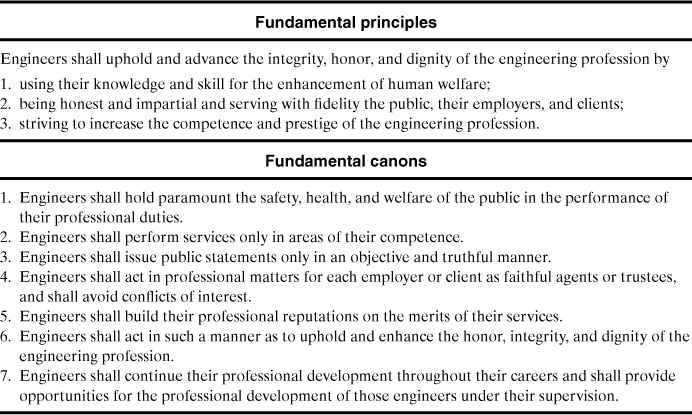
Most engineers are employed by private companies that provide wages and benefits for their services. The company earns profits for its shareholders, and engineers must provide a service to the company by maintaining and improving these profits. Engineers are responsible for minimizing losses and providing a safe and secure environment for the company’s employees. Engineers have a responsibility to themselves, fellow workers, family, community, and the engineering profession. Part of this responsibility is described in the Engineering Ethics statement developed by the American Institute of Chemical Engineers (AICHE), shown in Table 1-1.
Table 1-1. American Institute of Chemical Engineers Code of Professional Ethics
1-3. Accident and Loss Statistics
Accident and loss statistics are important measures of the effectiveness of safety programs. These statistics are valuable for determining whether a process is safe or whether a safety procedure is working effectively.
Many statistical methods are available to characterize accident and loss performance. These statistics must be used carefully. Like most statistics they are only averages and do not reflect the potential for single episodes involving substantial losses. Unfortunately, no single method is capable of measuring all required aspects. The three systems considered here are
• Fatal accident rate (FAR), and
• Fatality rate, or deaths per person per year
All three methods report the number of accidents and/or fatalities for a fixed number of workers during a specified period.
OSHA stands for the Occupational Safety and Health Administration of the United States government. OSHA is responsible for ensuring that workers are provided with a safe working environment. Table 1-2 contains several OSHA definitions applicable to accident statistics.
Table 1-2. Glossary of Terms Used by OSHA and Industry to Represent Work-Related Lossesa, b

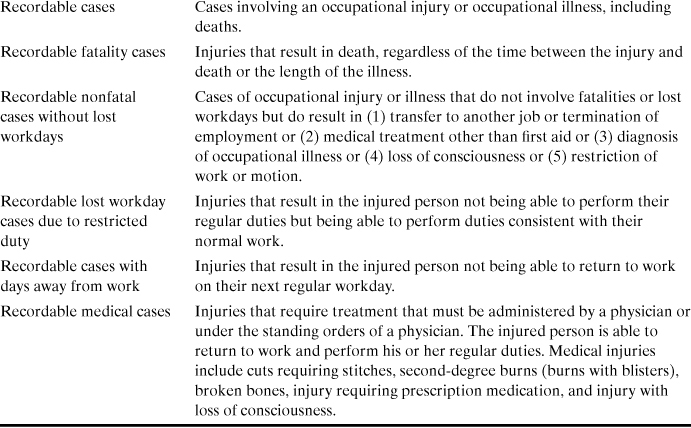
a Injury Facts, 1999 ed. (Chicago: National Safety Council, 1999), p. 151.
b OSHA regulations, 29 CFR 1904.12.
The OSHA incidence rate is based on cases per 100 worker years. A worker year is assumed to contain 2000 hours (50 work weeks/year × 40 hours/week). The OSHA incidence rate is therefore based on 200,000 hours of worker exposure to a hazard. The OSHA incidence rate is calculated from the number of occupational injuries and illnesses and the total number of employee hours worked during the applicable period. The following equation is used:
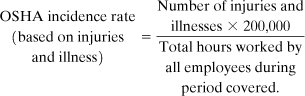
An incidence rate can also be based on lost workdays instead of injuries and illnesses. For this case
The definition of a lost workday is given in Table 1-2.
The OSHA incidence rate provides information on all types of work-related injuries and illnesses, including fatalities. This provides a better representation of worker accidents than systems based on fatalities alone. For instance, a plant might experience many small accidents with resulting injuries but no fatalities. On the other hand, fatality data cannot be extracted from the OSHA incidence rate without additional information.
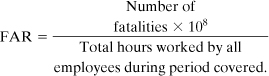
The FAR is used mostly by the British chemical industry. This statistic is used here because there are some useful and interesting FAR data available in the open literature. The FAR reports the number of fatalities based on 1000 employees working their entire lifetime. The employees are assumed to work a total of 50 years. Thus the FAR is based on 108 working hours. The resulting equation is
The last method considered is the fatality rate or deaths per person per year. This system is independent of the number of hours actually worked and reports only the number of fatalities expected per person per year. This approach is useful for performing calculations on the general population, where the number of exposed hours is poorly defined. The applicable equation is

Both the OSHA incidence rate and the FAR depend on the number of exposed hours. An employee working a ten-hour shift is at greater total risk than one working an eight-hour shift. A FAR can be converted to a fatality rate (or vice versa) if the number of exposed hours is known. The OSHA incidence rate cannot be readily converted to a FAR or fatality rate because it contains both injury and fatality information.
A process has a reported FAR of 2. If an employee works a standard 8-hr shift 300 days per year, compute the deaths per person per year.
Deaths per person per year = (8 hr/day) x (300 days/yr) x (2 deaths/108 hr)
= 4.8 x 10⁻⁵.
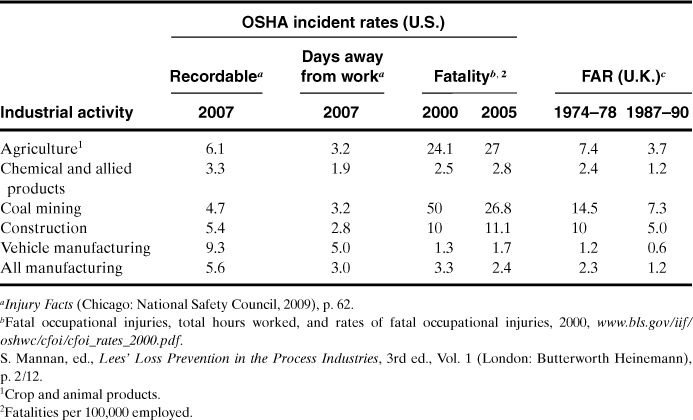
Typical accident statistics for various industries are shown in Table 1-3. A FAR of 1.2 is reported in Table 1-3 for the chemical industry. Approximately half these deaths are due to ordinary industrial accidents (falling down stairs, being run over), the other half to chemical exposures.2
Table 1-3. Accident Statistics for Selected Industries
The FAR figures show that if 1000 workers begin employment in the chemical industry, 2 of the workers will die as a result of their employment throughout all of their working lifetimes. One of these deaths will be due to direct chemical exposure. However, 20 of these same 1000 people will die as a result of nonindustrial accidents (mostly at home or on the road) and 370 will die from disease. Of those that perish from disease, 40 will die as a direct result of smoking.3
Table 1-4 lists the FARs for various common activities. The table is divided into voluntary and involuntary risks. Based on these data, it appears that individuals are willing to take a substantially greater risk if it is voluntary. It is also evident that many common everyday activities are substantially more dangerous than working in a chemical plant.
Table 1-4. Fatality Statistics for Common Nonindustrial Activitiesa,b

a Frank P. Lees, Loss Prevention in the Process Industries (London: Butterworths, 1986), p. 178.
b Frank P. Lees, Loss Prevention in the Process Industries, 2nd ed. (London: Butterworths, 1996), p. 9/96.
For example, Table 1-4 indicates that canoeing is much more dangerous than traveling by motorcycle, despite general perceptions otherwise. This phenomenon is due to the number of exposed hours. Canoeing produces more fatalities per hour of activity than traveling by motorcycle. The total number of motorcycle fatalities is larger because more people travel by motorcycle than canoe.
If twice as many people used motorcycles for the same average amount of time each, what will happen to (a) the OSHA incidence rate, (b) the FAR, (c) the fatality rate, and (d) the total number of fatalities?
a. The OSHA incidence rate will remain the same. The number of injuries and deaths will double, but the total number of hours exposed will double as well.
b. The FAR will remain unchanged for the same reason as in part a.
c. The fatality rate, or deaths per person per year, will double. The fatality rate does not depend on exposed hours.
d. The total number of fatalities will double.
If all riders used their motorcycles twice as much, what will happen to (a) the OSHA incidence rate, (b) the FAR, (c) the fatality rate, and (d) the total number of fatalities?
a. The OSHA incidence rate will remain the same. The same reasoning applies as for Example 1-2, part a.
b. The FAR will remain unchanged for the same reason as in part a.
c. The fatality rate will double. Twice as many fatalities will occur within this group.
d. The number of fatalities will double.
A friend states that more rock climbers are killed traveling by automobile than are killed rock climbing. Is this statement supported by the accident statistics?
The data from Table 1-4 show that traveling by car (FAR = 57) is safer than rock climbing (FAR = 4000). Rock climbing produces many more fatalities per exposed hour than traveling by car. However, the rock climbers probably spend more time traveling by car than rock climbing. As a result, the statement might be correct but more data are required.
Recognizing that the chemical industry is safe, why is there so much concern about chemical plant safety? The concern has to do with the industry’s potential for many deaths, as, for example, in the Bhopal, India, tragedy. Accident statistics do not include information on the total number of deaths from a single incident. Accident statistics can be somewhat misleading in this respect. For example, consider two separate chemical plants. Both plants have a probability of explosion and complete devastation once every 1000 years. The first plant employs a single operator. When the plant explodes, the operator is the sole fatality. The second plant employs 10 operators. When this plant explodes all 10 operators succumb. In both cases the FAR and OSHA incidence rate are the same; the second accident kills more people, but there are a correspondingly larger number of exposed hours. In both cases the risk taken by an individual operator is the same.4
It is human nature to perceive the accident with the greater loss of life as the greater tragedy. The potential for large loss of life gives the perception that the chemical industry is unsafe.
Loss data5 published for losses after 1966 and in 10-year increments indicate that the total number of losses, the total dollar amount lost, and the average amount lost per incident have steadily increased. The total loss figure has doubled every 10 years despite increased efforts by the chemical process industry to improve safety. The increases are mostly due to an expansion in the number of chemical plants, an increase in chemical plant size, and an increase in the use of more complicated and dangerous chemicals.
Property damage and loss of production must also be considered in loss prevention. These losses can be substantial. Accidents of this type are much more common than fatalities. This is demonstrated in the accident pyramid shown in Figure 1-3. The numbers provided are only approximate. The exact numbers vary by industry, location, and time. “No Damage” accidents are frequently called “near misses” and provide a good opportunity for companies to determine that a problem exists and to correct it before a more serious accident occurs. It is frequently said that “the cause of an accident is visible the day before it occurs.” Inspections, safety reviews, and careful evaluation of near misses will identify hazardous conditions that can be corrected before real accidents occur.
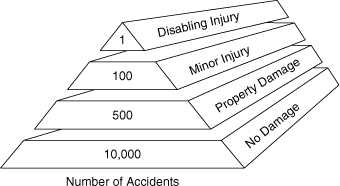
Figure 1-3. The accident pyramid.
Safety is good business and, like most business situations, has an optimal level of activity beyond which there are diminishing returns. As shown by Kletz,6 if initial expenditures are made on safety, plants are prevented from blowing up and experienced workers are spared. This results in increased return because of reduced loss expenditures. If safety expenditures increase, then the return increases more, but it may not be as much as before and not as much as achieved by spending money elsewhere. If safety expenditures increase further, the price of the product increases and sales diminish. Indeed, people are spared from injury (good humanity), but the cost is decreased sales. Finally, even higher safety expenditures result in uncompetitive product pricing: The company will go out of business. Each company needs to determine an appropriate level for safety expenditures. This is part of risk management.
From a technical viewpoint, excessive expenditures for safety equipment to solve single safety problems may make the system unduly complex and consequently may cause new safety problems because of this complexity. This excessive expense could have a higher safety return if assigned to a different safety problem. Engineers need to also consider other alternatives when designing safety improvements.
It is also important to recognize the causes of accidental deaths, as shown in Table 1-5. Because most, if not all, company safety programs are directed toward preventing injuries to employees, the programs should include off-the-job safety, especially training to prevent accidents with motor vehicles.
Table 1-5. All Accidental Deathsa
a Injury Facts, 2009, p. 2.
When organizations focus on the root causes of worker injuries, it is helpful to analyze the manner in which workplace fatalities occur (see Figure 1-4). Although the emphasis of this book is the prevention of chemical-related accidents, the data in Figure 1-4 show that safety programs need to include training to prevent injuries resulting from transportation, assaults, mechanical and chemical exposures, and fires and explosions.
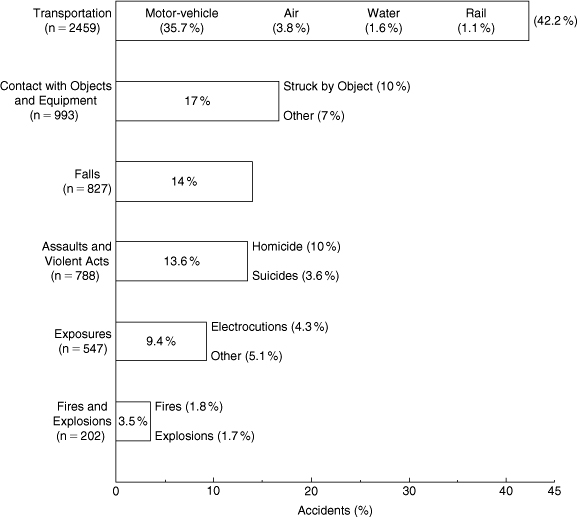
Figure 1-4. The manner in which workplace fatalities occurred in 2006. The total number of workplace fatalities was 5840; this includes the above plus 14 for bodily reaction and exertion, and 10 nonclassified. Data source: Injury Facts, 2009, p. 56.
1-4. Acceptable Risk
We cannot eliminate risk entirely. Every chemical process has a certain amount of risk associated with it. At some point in the design stage someone needs to decide if the risks are “acceptable.” That is, are the risks greater than the normal day-to-day risks taken by individuals in their nonindustrial environment? Certainly it would require a substantial effort and considerable expense to design a process with a risk comparable to being struck by lightning (see Table 1-4). Is it satisfactory to design a process with a risk comparable to the risk of sitting at home? For a single chemical process in a plant composed of several processes, this risk may be too high because the risks resulting from multiple exposures are additive.7
Engineers must make every effort to minimize risks within the economic constraints of the process. No engineer should ever design a process that he or she knows will result in certain human loss or injury, despite any statistics.
1-5. Public Perceptions
The general public has great difficulty with the concept of acceptable risk. The major objection is due to the involuntary nature of acceptable risk. Chemical plant designers who specify the acceptable risk are assuming that these risks are satisfactory to the civilians living near the plant. Frequently these civilians are not aware that there is any risk at all.
The results of a public opinion survey on the hazards of chemicals are shown in Figure 1-5. This survey asked the participants if they would say chemicals do more good than harm, more harm than good, or about the same amount of each. The results show an almost even three-way split, with a small margin to those who considered the good and harm to be equal.

Figure 1-5. Results from a public opinion survey asking the question, “Would you say chemicals do more good than harm, more harm than good, or about the same amount of each?” Source: The Detroit News.
Some naturalists suggest eliminating chemical plant hazards by “returning to nature.” One alternative, for example, is to eliminate synthetic fibers produced by chemicals and use natural fibers such as cotton. As suggested by Kletz,8 accident statistics demonstrate that this will result in a greater number of fatalities because the FAR for agriculture is higher.
List six different products produced by chemical engineers that are of significant benefit to mankind.
Penicillin, gasoline, synthetic rubber, paper, plastic, concrete.
1-6. The Nature of the Accident Process
Chemical plant accidents follow typical patterns. It is important to study these patterns in order to anticipate the types of accidents that will occur. As shown in Table 1-6, fires are the most common, followed by explosion and toxic release. With respect to fatalities, the order reverses, with toxic release having the greatest potential for fatalities.
Table 1-6. Three Types of Chemical Plant Accidents

Economic loss is consistently high for accidents involving explosions. The most damaging type of explosion is an unconfined vapor cloud explosion, where a large cloud of volatile and flammable vapor is released and dispersed throughout the plant site followed by ignition and explosion of the cloud. An analysis of the largest chemical plant accidents (based on worldwide accidents and 1998 dollars) is provided in Figure 1-6. As illustrated, vapor cloud explosions account for the largest percentage of these large losses. The “other” category of Figure 1-6 includes losses resulting from floods and windstorms.

Figure 1-6. Types of loss for large hydrocarbon-chemical plant accidents. Data from The 100 Largest Losses, 1972–2001.
Toxic release typically results in little damage to capital equipment. Personnel injuries, employee losses, legal compensation, and cleanup liabilities can be significant.
Figure 1-7 presents the causes of losses for these largest accidents. By far the most frequent cause is mechanical failures, such as pipe failures due to corrosion, erosion, and high pressures, and seal/gasket failures. Failures of this type are usually due to poor maintenance or the poor utilization of the principles of inherent safety (Section 1-7) and process safety management (Section 3-1). Pumps, valves, and control equipment will fail if not properly maintained. The second largest cause is operator error. For example, valves are not opened or closed in the proper sequence or reactants are not charged to a reactor in the correct order. Process upsets caused by, for example, power or cooling water failures account for 3% of the losses.

Figure 1-7. Causes of losses for largest hydrocarbon-chemical plant accidents. Data from The 100 Largest Losses, 1972–2001.
Human error is frequently used to describe a cause of losses. Almost all accidents, except those caused by natural hazards, can be attributed to human error. For instance, mechanical failures could all be due to human error as a result of improper maintenance or inspection. The term “operator error,” used in Figure 1-7, includes human errors made on-site that led directly to the loss.
Figure 1-8 presents a survey of the type of hardware associated with large accidents. Piping system failure represents the bulk of the accidents, followed by storage tanks and reactors. An interesting result of this study is that the most complicated mechanical components (pumps and compressors) are minimally responsible for large losses.
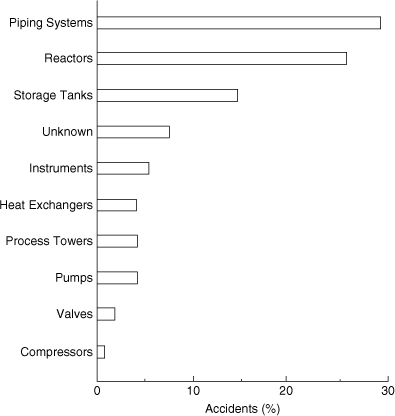
Figure 1-8. Hardware associated with the largest hydrocarbon-chemical plant accidents. Data from The 100 Largest Losses, 1972–2001.
The loss distribution for the hydrocarbon and chemical industry over 5-year intervals is shown in Figure 1-9. The number and magnitude of the losses increase over each consecutive 10-year period for the past 30 years. This increase corresponds to the trend of building larger and more complex plants.

Figure 1-9. Loss distribution for the largest hydrocarbon-chemical plant accidents over a 30-year period. Data from The 100 Largest Losses, 1972–2001.
The lower losses between 1992 and 1996 are likely the temporary result of governmental regulations that were implemented in the United States during this time; that is, on February 24, 1992, OSHA published its final rule “Process Safety Management of Highly Hazardous Chemicals (PSM).” This rule became effective on May 26, 1992. As shown, however, the lower losses between 1992 and 1996 were probably a start-up benefit of PSM because in the last 5-year period (1997-01) the losses went up again.
Accidents follow a three-step process. The following chemical plant accident illustrates these steps.
A worker walking across a high walkway in a process plant stumbles and falls toward the edge. To prevent the fall, he grabs a nearby valve stem. Unfortunately, the valve stem shears off and flammable liquid begins to spew out. A cloud of flammable vapor rapidly forms and is ignited by a nearby truck. The explosion and fire quickly spread to nearby equipment. The resulting fire lasts for six days until all flammable materials in the plant are consumed, and the plant is completely destroyed.
This disaster occurred in 19699 and led to an economic loss of $4,161,000. It demonstrates an important point: Even the simplest accident can result in a major catastrophe.
Most accidents follow a three-step sequence:
• Initiation (the event that starts the accident)
• Propagation (the event or events that maintain or expand the accident), and
• Termination (the event or events that stop the accident or diminish it in size)
In the example the worker tripped to initiate the accident. The accident was propagated by the shearing of the valve and the resulting explosion and growing fire. The event was terminated by consumption of all flammable materials.
Safety engineering involves eliminating the initiating step and replacing the propagation steps with termination events. Table 1-7 presents a few ways to accomplish this. In theory, accidents can be stopped by eliminating the initiating step. In practice this is not effective: It is unrealistic to expect elimination of all initiations. A much more effective approach is to work on all three areas to ensure that accidents, once initiated, do not propagate and will terminate as quickly as possible.
Table 1-7. Defeating the Accident Process

The following accident report has been filed.10
Failure of a threaded 1½″ drain connection on a rich oil line at the base of an absorber tower in a large (1.35 MCF/D) gas producing plant allowed the release of rich oil and gas at 850 psi and –40°F. The resulting vapor cloud probably ignited from the ignition system of engine-driven recompressors. The 75′ high × 10′ diameter absorber tower eventually collapsed across the pipe rack and on two exchanger trains. Breaking pipelines added more fuel to the fire. Severe flame impingement on an 11,000-horsepower gas turbine–driven compressor, waste heat recovery, and super-heater train resulted in its near total destruction.
Identify the initiation, propagation, and termination steps for this accident.
Initiation: Failure of threaded 1½″ drain connection
Propagation: Release of rich oil and gas, formation of vapor cloud, ignition of vapor cloud by recompressors, collapse of absorber tower across pipe rack
Termination: Consumption of combustible materials in process
As mentioned previously, the study of case histories is an especially important step in the process of accident prevention. To understand these histories, it is helpful to know the definitions of terms that are commonly used in the descriptions (see Table 1-8).
Table 1-8. Definitions for Case Historiesa
a Center for Chemical Process Safety (CCPS), Guidelines for Consequence Analysis.
1-7. Inherent Safety
An inherently safe plant11,12 relies on chemistry and physics to prevent accidents rather than on control systems, interlocks, redundancy, and special operating procedures to prevent accidents. Inherently safer plants are tolerant of errors and are often the most cost effective. A process that does not require complex safety interlocks and elaborate procedures is simpler, easier to operate, and more reliable. Smaller equipment, operated at less severe temperatures and pressures, has lower capital and operating costs.
In general, the safety of a process relies on multiple layers of protection. The first layer of protection is the process design features. Subsequent layers include control systems, interlocks, safety shutdown systems, protective systems, alarms, and emergency response plans. Inherent safety is a part of all layers of protection; however, it is especially directed toward process design features. The best approach to prevent accidents is to add process design features to prevent hazardous situations. An inherently safer plant is more tolerant of operator errors and abnormal conditions.
Although a process or plant can be modified to increase inherent safety at any time in its life cycle, the potential for major improvements is the greatest at the earliest stages of process development. At these early stages process engineers and chemists have the maximum degree of freedom in the plant and process specifications, and they are free to consider basic process alternatives, such as changes to the fundamental chemistry and technology.
The following four words are recommended to describe inherent safety:
• Minimize (intensification)
• Substitute (substitution)
• Moderate (attenuation and limitation of effects)
• Simplify (simplification and error tolerance)
The types of inherent safety techniques that are used in the chemical industry are illustrated in Table 1-9 and are described more fully in what follows.
Table 1-9. Inherent Safety Techniques

Minimizing entails reducing the hazards by using smaller quantities of hazardous substances in the reactors, distillation columns, storage vessels, and pipelines. When possible, hazardous materials should be produced and consumed in situ. This minimizes the storage and transportation of hazardous raw materials and intermediates.
Vapor released from spills can be minimized by designing dikes so that flammable and toxic materials will not accumulate around leaking tanks. Smaller tanks also reduce the hazards of a release.
While minimization possibilities are being investigated, substitutions should also be considered as an alternative or companion concept; that is, safer materials should be used in place of hazardous ones. This can be accomplished by using alternative chemistry that allows the use of less hazardous materials or less severe processing conditions. When possible, toxic or flammable solvents should be replaced with less hazardous solvents (for example, water-based paints and adhesives and aqueous or dry flowable formulations for agricultural chemicals).
Another alternative to substitution is moderation, that is, using a hazardous material under less hazardous conditions. Less hazardous conditions or less hazardous forms of a material include (1) diluting to a lower vapor pressure to reduce the release concentration, (2) refrigerating to lower the vapor pressure, (3) handling larger particle size solids to minimize dust, and (4) processing under less severe temperature or pressure conditions.
Containment buildings are sometimes used to moderate the impact of a spill of an especially toxic material. When containment is used, special precautions are included to ensure worker protection, such as remote controls, continuous monitoring, and restricted access.
Simpler plants are friendlier than complex plants because they provide fewer opportunities for error and because they contain less equipment that can cause problems. Often, the reason for complexity in a plant is the need to add equipment and automation to control the hazards. Simplification reduces the opportunities for errors and misoperation. For example, (1) piping systems can be designed to minimize leaks or failures, (2) transfer systems can be designed to minimize the potential for leaks, (3) process steps and units can be separated to prevent the domino effect, (4) fail-safe valves can be added, (5) equipment and controls can be placed in a logical order, and (6) the status of the process can be made visible and clear at all times.
The design of an inherently safe and simple piping system includes minimizing the use of sight glasses, flexible connectors, and bellows, using welded pipes for flammable and toxic chemicals and avoiding the use of threaded pipe, using spiral wound gaskets and flexible graphitetypeg gaskets that are less prone to catastrophic failures, and using proper support of lines to minimize stress and subsequent failures.
1-8. Seven Significant Disasters
The study of case histories provides valuable information to chemical engineers involved with safety. This information is used to improve procedures to prevent similar accidents in the future.
The seven most cited accidents (Flixborough, England; Bhopal, India; Seveso, Italy; Pasadena, Texas; Texas City, Texas; Jacksonville, Florida; and Port Wentworth, Georgia) are presented here. All these accidents had a significant impact on public perceptions and the chemical engineering profession that added new emphasis and standards in the practice of safety. Chapter 14 presents case histories in considerably more detail.
The Flixborough accident is perhaps the most documented chemical plant disaster. The British government insisted on an extensive investigation.
Flixborough, England
The accident at Flixborough, England, occurred on a Saturday in June 1974. Although it was not reported to any great extent in the United States, it had a major impact on chemical engineering in the United Kingdom. As a result of the accident, safety achieved a much higher priority in that country.
The Flixborough Works of Nypro Limited was designed to produce 70,000 tons per year of caprolactam, a basic raw material for the production of nylon. The process uses cyclohexane, which has properties similar to gasoline. Under the process conditions in use at Flixborough (155°C and 7.9 atm), the cyclohexane volatilizes immediately when depressurized to atmospheric conditions.
The process where the accident occurred consisted of six reactors in series. In these reactors cyclohexane was oxidized to cyclohexanone and then to cyclohexanol using injected air in the presence of a catalyst. The liquid reaction mass was gravity-fed through the series of reactors. Each reactor normally contained about 20 tons of cyclohexane.
Several months before the accident occurred, reactor 5 in the series was found to be leaking. Inspection showed a vertical crack in its stainless steel structure. The decision was made to remove the reactor for repairs. An additional decision was made to continue operating by connecting reactor 4 directly to reactor 6 in the series. The loss of the reactor would reduce the yield but would enable continued production because unreacted cyclohexane is separated and recycled at a later stage.
The feed pipes connecting the reactors were 28 inches in diameter. Because only 20-inch pipe stock was available at the plant, the connections to reactor 4 and reactor 6 were made using flexible bellows-type piping, as shown in Figure 1-10. It is hypothesized that the bypass pipe section ruptured because of inadequate support and overflexing of the pipe section as a result of internal reactor pressures. Upon rupture of the bypass, an estimated 30 tons of cyclohexane volatilized and formed a large vapor cloud. The cloud was ignited by an unknown source an estimated 45 seconds after the release.
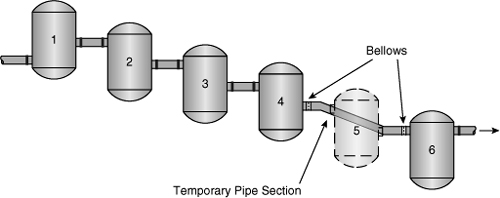
Figure 1-10. A failure of a temporary pipe section replacing reactor 5 caused the Flixborough accident.
The resulting explosion leveled the entire plant facility, including the administrative offices. Twenty-eight people died, and 36 others were injured. Eighteen of these fatalities occurred in the main control room when the ceiling collapsed. Loss of life would have been substantially greater had the accident occurred on a weekday when the administrative offices were filled with employees. Damage extended to 1821 nearby houses and 167 shops and factories. Fifty-three civilians were reported injured. The resulting fire in the plant burned for over 10 days.
This accident could have been prevented by following proper safety procedures. First, the bypass line was installed without a safety review or adequate supervision by experienced engineering personnel. The bypass was sketched on the floor of the machine shop using chalk!
Second, the plant site contained excessively large inventories of dangerous compounds. This included 330,000 gallons of cyclohexane, 66,000 gallons of naphtha, 11,000 gallons of toluene, 26,400 gallons of benzene, and 450 gallons of gasoline. These inventories contributed to the fires after the initial blast. Finally, the bypass modification was substandard in design. As a rule, any modifications should be of the same quality as the construction of the remainder of the plant.
Bhopal, India
The Bhopal, India, accident, on December 3, 1984, has received considerably more attention than the Flixborough accident. This is due to the more than 2000 civilian casualties that resulted.
The Bhopal plant is in the state of Madhya Pradesh in central India. The plant was partially owned by Union Carbide and partially owned locally.
The nearest civilian inhabitants were 1.5 miles away when the plant was constructed. Because the plant was the dominant source of employment in the area, a shantytown eventually grew around the immediate area.
The plant produced pesticides. An intermediate compound in this process is methyl isocyanate (MIC). MIC is an extremely dangerous compound. It is reactive, toxic, volatile, and flammable. The maximum exposure concentration of MIC for workers over an 8-hour period is 0.02 ppm (parts per million). Individuals exposed to concentrations of MIC vapors above 21 ppm experience severe irritation of the nose and throat. Death at large concentrations of vapor is due to respiratory distress.
MIC demonstrates a number of dangerous physical properties. Its boiling point at atmospheric conditions is 39.1°C, and it has a vapor pressure of 348 mm Hg at 20°C. The vapor is about twice as heavy as air, ensuring that the vapors will stay close to the ground once released.
MIC reacts exothermically with water. Although the reaction rate is slow, with inadequate cooling the temperature will increase and the MIC will boil. MIC storage tanks are typically refrigerated to prevent this problem.
The unit using the MIC was not operating because of a local labor dispute. Somehow a storage tank containing a large amount of MIC became contaminated with water or some other substance. A chemical reaction heated the MIC to a temperature past its boiling point. The MIC vapors traveled through a pressure relief system and into a scrubber and flare system installed to consume the MIC in the event of a release. Unfortunately, the scrubber and flare systems were not operating, for a variety of reasons. An estimated 25 tons of toxic MIC vapor was released. The toxic cloud spread to the adjacent town, killing over 2000 civilians and injuring an estimated 20,000 more. No plant workers were injured or killed. No plant equipment was damaged.
The exact cause of the contamination of the MIC is not known. If the accident was caused by a problem with the process, a well-executed safety review could have identified the problem. The scrubber and flare system should have been fully operational to prevent the release. Inventories of dangerous chemicals, particularly intermediates, should also have been minimized.
The reaction scheme used at Bhopal is shown at the top of Figure 1-11 and includes the dangerous intermediate MIC. An alternative reaction scheme is shown at the bottom of the figure and involves a less dangerous chloroformate intermediate. Another solution is to redesign the process to reduce the inventory of hazardous MIC. One such design produces and consumes the MIC in a highly localized area of the process, with an inventory of MIC of less than 20 pounds.
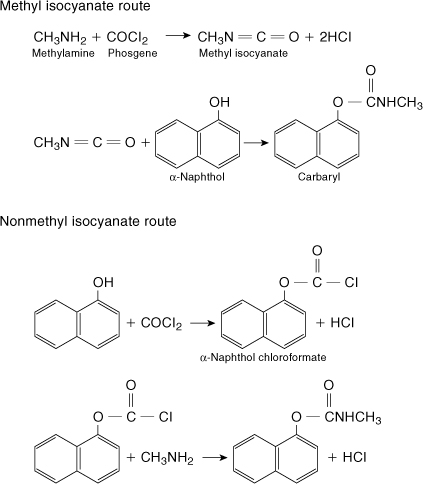
Figure 1-11. The upper reaction is the methyl isocyanate route used at Bhopal. The lower reaction suggests an alternative reaction scheme using a less hazardous intermediate. Adapted from Chemical and Engineering News (Feb. 11, 1985), p. 30.
Seveso, Italy
Seveso is a small town of approximately 17,000 inhabitants, 15 miles from Milan, Italy. The plant was owned by the Icmesa Chemical Company. The product was hexachlorophene, a bactericide, with trichlorophenol produced as an intermediate. During normal operation, a small amount of TCDD (2,3,7,8-tetrachlorodibenzoparadioxin) is produced in the reactor as an undesirable side-product.
TCDD is perhaps the most potent toxin known to humans. Animal studies have shown TCDD to be fatal in doses as small as 10–9 times the body weight. Because TCDD is also insoluble in water, decontamination is difficult. Nonlethal doses of TCDD result in chloracne, an acne-like disease that can persist for several years.
On July 10, 1976, the trichlorophenol reactor went out of control, resulting in a higher than normal operating temperature and increased production of TCDD. An estimated 2 kg of TCDD was released through a relief system in a white cloud over Seveso. A subsequent heavy rain washed the TCDD into the soil. Approximately 10 square miles were contaminated.
Because of poor communications with local authorities, civilian evacuation was not started until several days later. By then, over 250 cases of chloracne were reported. Over 600 people were evacuated, and an additional 2000 people were given blood tests. The most severely contaminated area immediately adjacent to the plant was fenced, the condition it remains in today.
TCDD is so toxic and persistent that for a smaller but similar release of TCDD in Duphar, India, in 1963 the plant was finally disassembled brick by brick, encased in concrete, and dumped into the ocean. Less than 200 g of TCDD was released, and the contamination was confined to the plant. Of the 50 men assigned to clean up the release, 4 eventually died from the exposure.
The Seveso and Duphar accidents could have been avoided if proper containment systems had been used to contain the reactor releases. The proper application of fundamental engineering safety principles would have prevented the two accidents. First, by following proper procedures, the initiation steps would not have occurred. Second, by using proper hazard evaluation procedures, the hazards could have been identified and corrected before the accidents occurred.
Pasadena, Texas
A massive explosion in Pasadena, Texas, on October 23, 1989, resulted in 23 fatalities, 314 injuries, and capital losses of over $715 million. This explosion occurred in a high-density polyethylene plant after the accidental release of 85,000 pounds of a flammable mixture containing ethylene, isobutane, hexane, and hydrogen. The release formed a large gas cloud instantaneously because the system was under high pressure and temperature. The cloud was ignited about 2 minutes after the release by an unidentified ignition source.
The damage resulting from the explosion made it impossible to reconstruct the actual accident scenario. However, evidence showed that the standard operating procedures were not appropriately followed.
The release occurred in the polyethylene product takeoff system, as illustrated in Figure 1-12. Usually the polyethylene particles (product) settle in the settling leg and are removed through the product takeoff valve. Occasionally, the product plugs the settling leg, and the plug is removed by maintenance personnel. The normal—and safe—procedure includes closing the DEMCO valve, removing the air lines, and locking the valve in the closed position. Then the product takeoff valve is removed to give access to the plugged leg.
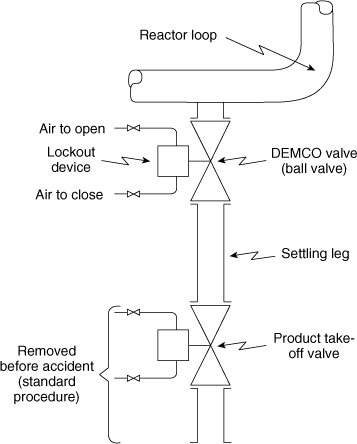
Figure 1-12. Polyethylene plant settling leg and product takeoff system.
The accident investigation evidence showed that this safe procedure was not followed; specifically, the product takeoff valve was removed, the DEMCO valve was in the open position, and the lockout device was removed. This scenario was a serious violation of well-established and well-understood procedures and created the conditions that permitted the release and subsequent explosion.
The OSHA investigation13 found that (1) no process hazard analysis had been performed in the polyethylene plant, and as a result, many serious safety deficiencies were ignored or overlooked; (2) the single-block (DEMCO) valve on the settling leg was not designed to fail to a safe closed position when the air failed; (3) rather than relying on a single-block valve, a double block and bleed valving arrangement or a blind flange after the single-block valve should have been used; (4) no provision was made for the development, implementation, and enforcement of effective permit systems (for example, line opening); and (5) no permanent combustible gas detection and alarm system was located in the region of the reactors.
Other factors that contributed to the severity of this disaster were also cited: (1) proximity of high-occupancy structures (control rooms) to hazardous operation, (2) inadequate separation between buildings, and (3) crowded process equipment.
Texas City, Texas
A petroleum refinery had large explosions on March 23, 2005, that killed 15 workers and injured about 18014. The explosions were the result of a sudden release of flammable liquid and vapor from an open vent stack in the refinery’s isomerization (ISOM) unit. The ISOM unit converts pentane and hexane into isopentane and isohexane (gasoline additive). The unit works by heating the pentane and hexane in the presence of a catalyst. This unit includes a splitter tower and associated process equipment, which is used to prepare the hydrocarbon feed of the isomerization reactor.
This accident was during the startup of this ISOM process unit. In this startup, hydrocarbons were pumped into the splitter tower for three hours without any liquid being removed and transferred to storage (which should have happened). As a result, the 164-foot-tall tower was overfilled. The resulting high pressure activated three pressure relief valves, and the liquid was discharged to a vented blowdown drum. The blowdown drum overfilled with hydrocarbons, producing a geyser-like release from the vented stack. The flammable hydrocarbons pooled on the ground, releasing vapors that ignited, resulting in multiple explosions and fires. Many of those killed were working in or around two contractor office trailers located near a blowdown drum.
The CSB investigation identified the following major findings: (1) the occupied trailers were sited in an unsafe location (all 15 fatalities occurred in or around two contractor trailers); (2) the ISOM unit should not have been started up because there were existing and known problems that should have been repaired before a startup (known equipment malfunctions included a level indicator and alarm, and a control valve); and (3) previously there were at least four other serious releases of flammables out of this blowdown drum vent, and even though these serious near-misses revealed the existing hazard, no effective investigations were conducted nor were appropriate design changes made (a properly designed flare system would have burned these effluents to prevent this unsafe release of the flammable liquid and combustible vapors).
Jacksonville, Florida
CSB investigated an accident15 that occurred in a chemical manufacturing plant (gasoline additive) on December 19, 2007. A powerful explosion and fire killed 4 employees and injured 32, including 4 employees and 28 members of the public who were working in surrounding businesses. This plant blended and sold printing solvents and started to manufacture methylcyclopentadienyl manganese tricarbonyl (MCMT) in a 2500-gallon batch reactor in January of 2004.
The accident occurred while the plant was producing its 175th batch of MCMT. The process included two exothermic reactions, the first a necessary step in the production of MCMT, and the second an unwanted side reaction that occurs at about 390°F, which is slightly higher than the normal operating temperature. The reactor cooling failed (line blockage or valve failure), and the temperature increased, setting off both runaway reactions uncontrollably. About ten minutes after the initial cooling failure, the reactor burst and its contents exploded due to the uncontrolled high temperatures and pressures. The pressure burst the reactor and the reactor’s contents exploded with a TNT equivalent to 1400 pounds of TNT. Debris from the reactor was found up to one mile away, and the explosion damaged buildings within one-quarter mile of the facility.
CSB found that (1) the cooling system was susceptible to only single-point failures due to the lack of design redundancy, (2) the reactor relief system was incapable of relieving the pressure from the runaway reactions, and (3) despite a number of previous and similar near-misses the company employees failed to recognize the hazards of the runaway reactions associated with this manufacturing process (even though the two owners of the company had undergraduate degrees in chemistry and chemical engineering).
The CSB recommendations in this accident investigation report focused on improving the education of chemical engineering students on the hazards of reactive chemicals.
Port Wentworth, Georgia
On February 7, 2008, a series of sugar dust explosions at a sugar manufacturing facility resulted in 14 fatalities and 36 injuries.16 This refinery converted raw sugarcane into granulated sugar. A system of screw and belt conveyors and bucket elevators transported granulated sugar from the refinery to storage silos, and to specialty sugar processing areas.
A recently installed steel cover panel on the belt conveyor allowed explosive concentrations of sugar dust to accumulate inside the enclosure. The first dust explosion occurred in this enclosed steel belt conveyor located below the sugar silos. An overheated bearing in the steel belt conveyor was the most likely ignition source. This primary explosion dispersed sugar dust that had accumulated on the floors and elevator horizontal surfaces, propagating more explosions throughout the buildings. Secondary dust explosions occurred throughout the packing buildings, parts of the refinery, and the loading buildings. The pressure waves from the explosions heaved thick concrete floors and collapsed brick walls, blocking stairwell and other exit routes.
The CSB investigation identified three major causes: (1) The conveying equipment was not designed to minimize the release of sugar dust and eliminate all ignition sources in the work areas; (2) housekeeping practices were poor; and (3) the company failed to correct the ongoing and known hazardous conditions, despite the well-known and broadly published hazards associated with combustible dusts.
Prior to this Port Wentworth accident, CSB undertook a study17 in 2005 concerning the extent of the industrial dust explosion problem. They identified 200 fires and explosions due to dusts over a 25-year period that took 100 lives and caused 600 injuries. The tragic event in Port Wentworth demonstrates that dust explosions in industry continue to be a problem.
Suggested Reading
General Aspects of Chemical Process Safety
Robert M. Bethea, Explosion and Fire at Pasadena, Texas (New York: American Institute of Chemical Engineers, 1996).
Howard H. Fawcett and William S. Wood, eds., Safety and Accident Prevention in Chemical Operations, 2nd ed. (New York: Wiley, 1982), ch. 1.
Dennis C. Hendershot, “A History of Process Safety and Loss Prevention in the American Institute of Chemical Engineers,” Process Safety Progress, (June 2009), 28(2): 105–113.
S. Mannan, ed. Lees’ Loss Prevention in the Process Industries, 3rd ed. (London: Butterworth-Heinemann, 2005).
Bhopal
Chemical and Engineering News (Feb. 11, 1985), p. 14.
A. Sam West, Dennis Hendershot, John F. Murphy, and Ronald Willey, “Bhopal’s Impact on the Chemical Industry,” Process Safety Progress, (Dec. 2004), 23(4): 229–230.
Ronald J. Willey, Dennis C. Hendershot, and Scott Berger, “The Accident in Bhopal: Observations 20 Years Later,” Process Safety Progress, (Sept. 2007), 26(3): 180–184.
Seveso
Chemical and Engineering News (Aug. 23, 1976), p. 27.
Dennis C. Hendershot and John F. Murphy, “Expanding Role of the Loss Prevention Professional: Past, Present, and Future,” Process Safety Progress, (March 2007), 26(1): 18–26.
Walter B. Howard, “Seveso: Cause; Prevention,” Plant/Operations Progress (Apr. 1985), 4(2): 103–104.
J. Sambeth, “What Really Happened at Seveso,” Chemical Engineering (May 16, 1983), pp. 44–47.
Flixborough
Robert M. Bethea, Process Safety Management with Case Histories: Flixborough, Pasadena, and Other Incidents (New York: American Institute of Chemical Engineers, 1994).
Dennis C. Hendershot and John F. Murphy, “Expanding Role of the Loss Prevention Professional: Past, Present, and Future,” Process Safety Progress (Mar. 2007), 26(1): 18–26.
Trevor A. Kletz, “The Flixborough Explosion—Ten Years Later,” Plant/Operations Progress (July 1984), 3(3): 133–135.
S. Mannan, ed. Lees’ Loss Prevention in the Process Industries, 3rd ed., vol. 3, Appendix 2, Pages 1–18. (London: Butterworth-Heinemann, 2005).
General Case Histories
T. Kletz, Learning from Accidents, 3rd ed. (Boston: Butterworth-Heinemann, 2001).
T. Kletz, What Went Wrong? Case Histories of Process Plant Disasters and How They Could Have Been Avoided, 5th ed. (Boston: Butterworth-Heinemann, 2009).
Problems
1-1. An employee works in a plant with a FAR of 4. If this employee works a 4-hr shift, 200 days per year, what is the expected deaths per person per year?
1-2. Three process units are in a plant. The units have FARs of 0.5, 0.3, and 1.0, respectively.
a. What is the overall FAR for the plant, assuming worker exposure to all three units simultaneously?
b. Assume now that the units are far enough apart that an accident in one would not affect the workers in another. If a worker spends 20% of his time in process area 1, 40% in process area 2, and 40% in process area 3, what is his overall FAR?
1-3. Assuming that a car travels at an average speed of 50 miles per hour, how many miles must be driven before a fatality is expected?
1-4. A worker is told her chances of being killed by a particular process are 1 in every 500 years. Should the worker be satisfied or alarmed? What is the FAR (assuming normal working hours) and the deaths per person per year? What should her chances be, assuming an average chemical plant?
1-5. A plant employs 1500 full-time workers in a process with a FAR of 5. How many industrial-related deaths are expected each year?
1-6. Consider Example 1-4. How many hours must be traveled by car for each hour of rock climbing to make the risk of fatality by car equal to the risk of fatality by rock climbing?
1-7. Identify the initiation, propagation, and termination steps for the following accident reports.18 Suggest ways to prevent and contain the accidents.
a. A contractor accidentally cut into a 10-in propane line operating at 800 psi at a natural gas liquids terminal. The large vapor cloud estimated to cover an area of 44 acres was ignited about 4–5 min later by an unknown source. Liquid products from 5 of 26 salt dome caverns fed the fire with an estimated 18,000–30,000 gal of LPGs for almost 6 hr before being blocked in and the fires extinguished. Both engine-driven fire pumps failed, one because intense radiated heat damaged its ignition wires and the other because the explosion broke a sight glass fuel gauge, spilling diesel fuel, which ignited, destroying the fire pump engine.
b. An alkylation unit was being started up after shutdown because of an electrical outage. When adequate circulation could not be maintained in a deisobutanizer heater circuit, it was decided to clean the strainer. Workers had depressurized the pipe and removed all but three of the flange bolts when a pressure release blew a black material from the flange, followed by butane vapors. These vapors were carried to a furnace 100 ft away, where they ignited, flashing back to the flange. The ensuing fire exposed a fractionation tower and horizontal receiver drums. These drums exploded, rupturing pipelines, which added more fuel. The explosions and heat caused loss of insulation from the 8-ft × 122-ft fractionator tower, causing it to weaken and fall across two major pipelines, breaking piping—which added more fuel to the fire. Extinguishment, achieved basically by isolating the fuel sources, took 2½ hours.
The fault was traced to a 10-in valve that had been prevented from closing the last ¾-inch by a fine powder of carbon and iron oxide. When the flange was opened, this powder blew out, allowing liquid butane to be released.
1-8. The airline industry claims commercial airline transport has fewer deaths per mile than any other means of transportation. Do the accident statistics support this claim? In 1984 the airline industry posted 4 deaths per 10,000,000 passenger miles. What additional information is required to compute a FAR? a fatality rate?
1-9. A university has 1200 full-time employees. In a particular year this university had 38 reportable lost-time injuries with a resulting 274 lost workdays. Compute the OSHA incidence rate based on injuries and lost workdays.
1-10. Based on workplace fatalities (Figure 1-4) and assuming you are responsible for a safety program of an organization, what would you emphasize?
1-11. Based on the causes of the largest losses (Figure 1-7), what would you emphasize in a safety program?
1-12. After reviewing the answers to Problems 1-10 and 1-11, can inherent safety help?
1-13. What conclusions can you derive from Figure 1-9?
1-14. What is the worst thing that could happen to you as a chemical engineer in industry?
1-15. An explosion has occurred in your plant and an employee has been killed. An investigation shows that the accident was the fault of the dead employee, who manually charged the wrong ingredient to a reactor vessel. What is the appropriate response from the following groups?
a. The other employees who work in the process area affected.
b. The other employees elsewhere in the plant site.
c. Middle management.
d. Upper management.
e. The president of the company.
f. The union.
1-16. You have just begun work at a chemical plant. After several weeks on the job you determine that the plant manager runs the plant with an iron fist. He is a few years away from retirement after working his way up from the very bottom. Also, a number of unsafe practices are performed at the plant, including some that could lead to catastrophic results. You bring up these problems to your immediate supervisor, but he decides to do nothing for fear that the plant manager will be upset. After all, he says, “We’ve operated this plant for 40 years without an accident.” What would you do in this situation?
1-17. a. You walk into a store and after a short while you decide to leave, preferring not to do any business there. What did you observe to make you leave? What conclusions might you reach about the attitudes of the people who manage and operate this store?
b. You walk into a chemical plant and after a short while you decide to leave, fearing that the plant might explode at any moment. What did you observe to make you leave? What conclusions might you reach about the attitudes of the people who manage and operate this chemical plant?
Comment on the similarities of parts a and b.
1-18. A large storage tank is filled manually by an operator. The operator first opens a valve on a supply line and carefully watches the level on a level indicator until the tank is filled (a long time later). Once the filling is complete, the operator closes the valve to stop the filling. Once a year the operator is distracted and the tank is overfilled. To prevent this, an alarm was installed on the level gauge to alert the operator to a high-level condition. With the installation of the alarm, the tank now overfills twice per year. Can you explain?
1-19. Careful numbering of process equipment is important to avoid confusion. On one unit the equipment was numbered J1001 upward. When the original allocation of numbers ran out the new equipment was numbered JA1001 upward. An operator was verbally told to prepare pump JA1001 for repairs. Unfortunately, he prepared pump J1001 instead, causing an upset in the plant. What happened?
1-20. A cover plate on a pump housing is held in place by eight bolts. A pipefitter is instructed to repair the pump. The fitter removes all eight bolts only to find the cover plate stuck on the housing. A screwdriver is used to pry off the cover. The cover flies off suddenly, and toxic liquid sprays throughout the work area. Clearly the pump unit should have been isolated, drained, and cleaned before repair. There is, however, a better procedure for removing the cover plate. What is this procedure?
1-21. The liquid level in a tank 10 m in height is determined by measuring the pressure at the bottom of the tank. The level gauge was calibrated to work with a liquid having a specific gravity of 0.9. If the usual liquid is replaced with a new liquid with a specific gravity of 0.8, will the tank be overfilled or underfilled? If the actual liquid level is 8 m, what is the reading on the level gauge? Is it possible that the tank will overflow without the level gauge indicating the situation?
1-22. One of the categories of inherent safety is simplification/error tolerance. What instrumentation could you add to the tank described in Problem 1-21 to eliminate problems?
1-23. Pumps can be shut-in by closing the valves on the inlet and outlet sides of the pump. This can lead to pump damage and/or a rapid increase in the temperature of the liquid shut inside the pump. A particular pump contains 4 kg of water. If the pump is rated at 1 HP, what is the maximum temperature increase expected in the water in °C/hr? Assume a constant water heat capacity of 1 kcal/kg/°C. What will happen if the pump continues to operate?
1-24. Water will flash into vapor almost explosively if heated under certain conditions.
a. What is the ratio in volume between water vapor at 300 K and liquid water at 300 K at saturated conditions?
b. Hot oil is accidentally pumped into a storage vessel. Unfortunately, the tank contains residual water, which flashes into vapor and ruptures the tank. If the tank is 10 m in diameter and 5 m high, how many kilograms of water at 300 K are required to produce enough water vapor to pressurize the tank to 8 in of water gauge pressure, the burst pressure of the tank?
1-25. Another way of measuring accident performance is by the LTIR, or lost-time injury rate. This is identical to the OSHA incidence rate based on incidents in which the employee is unable to continue their normal duties. A plant site has 1200 full-time employees working 40 hr/week and 50 weeks/yr. If the plant had 2 lost-time incidents last year, what is the LTIR?
1-26. A car leaves New York City and travels the 2800-mi distance to Los Angeles at an average speed of 50 mph. An alternative travel plan is to fly on a commercial airline for 4½hr. What are the FARs for the two methods of transportation? Which travel method is safer, based on the FAR?
1-27. A column was used to strip low-volatile materials from a high-temperature heat transfer fluid. During a maintenance procedure, water was trapped between two valves. During normal operation, one valve was opened and the hot oil came in contact with the cold water. The result was almost sudden vaporization of the water, followed by considerable damage to the column. Consider liquid water at 25°C and 1 atm. How many times does the volume increase if the water is vaporized at 100°C and 1 atm?
1-28. Large storage tanks are designed to withstand low pressures and vacuums. Typically they are constructed to withstand no more than 8 in of water gauge pressure and 2.5 in of water gauge vacuum. A particular tank is 30 ft in diameter.
a. If a 200-lb person stands in the middle of the tank roof, what is the resulting pressure (in inches of water gauge) if the person’s weight is distributed across the entire roof?
b. If the roof was flooded with 8 in of water (equivalent to the maximum pressure), what is the total weight (in pounds) of the water?
c. A large storage tank was sucked in when the vent to the outside became plugged and the operator turned on the pump to empty the tank. How did this happen?
Note: A person can easily blow to a pressure of greater than 20 in of water gauge.
1-29. A 50-gal drum with bulged ends is found in the storage yard of your plant. You are unable to identify the contents of the drum. Develop a procedure to handle this hazard. There are many ways to solve this problem. Please describe just one approach.
1-30. The plant has been down for extensive maintenance and repair. You are in charge of bringing the plant up and on-line. There is considerable pressure from the sales department to deliver product. At about 4 A.M. a problem develops. A slip plate or blind has accidentally been left in one of the process lines. An experienced maintenance person suggests that she can remove the slip plate without depressurizing the line. She said that she routinely performed this operation years ago. Since you are in charge, what would you do?
1-31. Gasoline tank trucks are load restricted in that the tank must never be between 20% and 80% full when traveling. Or it must be below 20% and above 80%. Why?
1-32. In 1891 the copper industry in Michigan employed 7702 workers. In that year there were 28 fatalities in the mines. Estimate the FAR for this year, assuming that the workers worked 40-hour weeks and 50 weeks per year. Compare the result to the published FAR for the chemical industry.
1-33. The Weather Channel reports that, on average, about 42 Americans are killed by lightning each year. The current population of the U.S. is about 300 million people. Which accident index is suitable for this information: FAR, OSHA incident rate, or deaths per person per year? Why? Calculate the value of the selected index and compare it to published values.
1-34. The CSB video “Preventing Harm from Sodium Hydrosulfide” presents an incident involving sodium hydrosulfide (NaSH) and hydrogen sulfide (H2S). Go on-line and find at least two material safety data sheets (MSDS) for both of these chemicals. Tabulate the following physical properties for these chemicals at room temperature and pressure, if available: physical state density, PEL, TLV, and vapor pressure. List any other concerns that might be apparent from the MSDS. Which of these properties are of major concern in using these chemicals?