![]()
Effective Network Management
Chapter 10 introduced the management plane. That chapter focused on the management plane and supporting commands on the router itself. This chapter looks more at enterprise network management. This includes aggregation of log and SNMP data into central tools that are used to monitor and manage the infrastructure.
When an IT professional asks for help troubleshooting a problem, the most common response is, “Did you check the logs?” In a large number of cases, information in the log points a network engineer directly to the problem. This also depends on what is logged. Let’s look at an example where you are trying to troubleshoot the loss of connectivity to a segment. Assume that you got as far as IOU16 and you think it has something to do with the problem. The log on IOU16 implies that there is a problem with OSPF.
IOU16#show logging
<output omitted>
*May 30 18:43:10.442: %OSPF-5-ADJCHG: Process 100, Nbr 122.1.1.5 on Ethernet0/0.516 from FULL to DOWN, Neighbor Down: Dead timer expired
*May 30 18:46:03.042: %LDP-5-NBRCHG: LDP Neighbor 122.1.1.5:0 (2) is DOWN (Session KeepAlive Timer expired)
To get more information, you should turn on debug. You could turn on logging to the console with debugging enabled, but that can overwhelm the console. Another option is to send debug information to the log files.
IOU16(config)#logging buffered debugging
IOU16(config)#exit
IOU16#debug ip ospf 100 hello
OSPF hello debugging is on for process 100

IOU5(config)#logging buffered debugging
IOU5(config)#exit
IOU5#debug ip ospf hello
Now that you have configured debugging, you can look at the logs to see if you see a problem. In this case, it points you directly to the problem. Someone configured mismatched hello parameters.
*May 30 19:14:49.171: OSPF-100 HELLO Et0/0.516: Mismatched hello parameters from 10.16.0.22
*May 30 19:14:49.171: OSPF-100 HELLO Et0/0.516: Dead R 40 C 240, Hello R 10 C 60 Mask R 255.255.255.252 C 255.255.255.252
A problem with viewing the local log files is that the interface is limited and you can only look at one device at a time. Pushing to a syslog server can resolve these issues. To send data to a syslog server, use the logging command. If you want to send debugging events to syslog, you need to increase logging to include them. If you do this, be careful not to debug so much that it overwhelms the network or creates a cycle where sending a message creates a new message.
IOU5(config)#logging 10.1.1.1
IOU5(config)#logging trap debugging
IOU5(config)#

IOU16(config)#logging 10.1.1.1
IOU16(config)#logging trap debugging
IOU16(config)#
There are numerous syslog servers available. The most basic server is the syslog daemon built into Linux. However, by itself, it doesn’t provide much functionality. For Windows, a common syslog server is Solarwind’s Kiwi syslog server. For the example topology, you are using Splunk to receive and parse the syslog data. Splunk 6 has the ability to find pattern in data that it can use to create reusable queries, the ability to create graphs based on queries, and to perform ad hoc searches. In the example, you have OSPF hello debugging turned on for two routers. Let’s search for all hosts with a name starting with IOU and OSPF in the log message. Figure 18-1 shows how to query Splunk for any records that are from a host whose name starts with IOU and includes the string OSPF.

Figure 18-1. Splunk search
When you search on OSPF and look at the automatically generated patterns, you can see that Splunk identified a pattern for mismatched hello parameters (see Figure 18-2).
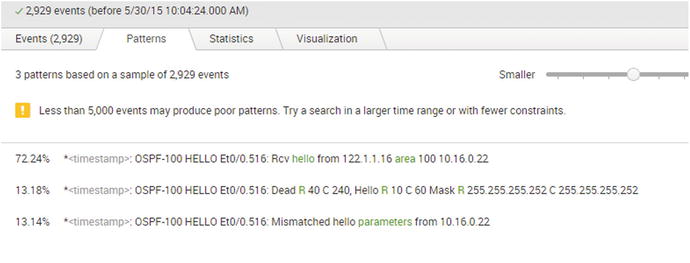
Figure 18-2. Splunk patterns
This is just a basic overview of a query that can be done in Splunk. Splunk can be used to generate complex queries. It automatically attempts to extract fields that can be used in building queries. When a field is required that isn’t automatically extracted, users can create their own patterns to create a field.
Up until now in the example, you were looking for information on a problem that you were troubleshooting. The value of event management services like Splunk really comes from the ability to find issues before they have a noticeable impact. Dashboards and alerts can help serve this purpose in Splunk. These functionalities can alarm administrators or show spikes in graphs when an event meets certain criteria or breaks the normal pattern.
Simple Network Management Protocol
Even though event log management tools help provide structure to log files, they are still limited. SNMP provides structure and granularity that doesn’t exist with basic logging. The structure for SNMP is defined in Management Information Bases (MIBs), which allows tools to query SNMP-enabled devices on specific object IDs, and SNMP-enabled devices to send traps on specific object IDs. For example, if an interface goes down, syslog could create a message that would need to be parsed for relevant information. However, SNMP could send a trap referencing the object with attributes set to show the change in link state. Since the structure is defined, the SNMP manager doesn’t need to attempt to parse based on content. It can rely on the structure provided by the MIB to accurately display the events.
SNMP also provides scalability that isn’t possible with log files. You wouldn’t want log files sending all the information about the health and status of the router on regular intervals. With SNMP, it is feasible for network managers to pull health and status information as needed, and receive traps when certain thresholds are passed. Think of an example of link utilization. A syslog message could be generated when a link hits a configured utilization, but it still needs to be parsed and the available information would be limited to the content of the message. With SNMP, after the trap is received, the SNMP manager could frequently query the interface to provide more detailed information.
Similar to how SNMP management tools can selectively read any object on an SNMP-enabled network device, the network device can be configured to selectively send traps. The selection of traps to send is configured using the snmp-server enable traps [notification-type] [notification-option] command.
Router1(config)#snmp-server enable traps ?
  aaa_server       Enable SNMP AAA Server traps
  atm              Enable SNMP atm traps
  auth-framework   Enable SNMP CISCO-AUTH-FRAMEWORK-MIB traps
  bfd              Allow SNMP BFD traps
  bgp              Enable BGP traps
  bstun            Enable SNMP BSTUN traps
  bulkstat         Enable Data-Collection-MIB Collection notifications
  ccme             Enable SNMP ccme traps
  cef              Enable SNMP CEF traps
  cnpd             Enable NBAR Protocol Discovery traps
  config           Enable SNMP config traps
  config-copy      Enable SNMP config-copy traps
  config-ctid      Enable SNMP config-ctid traps
  cpu              Allow cpu related traps
  dial             Enable SNMP dial control traps
  diameter         Allow Diameter related traps
  dlsw             Enable SNMP dlsw traps
  dnis             Enable SNMP DNIS traps
  ds1              Enable SNMP DS1 traps
  dsp              Enable SNMP dsp traps
  eigrp            Enable SNMP EIGRP traps
  entity           Enable SNMP entity traps
  ethernet         Enable SNMP Ethernet traps
  event-manager    Enable SNMP Embedded Event Manager traps
  firewall         Enable SNMP Firewall traps
  flowmon          Enabel SNMP flowmon notifications
  frame-relay      Enable SNMP frame-relay traps
  fru-ctrl         Enable SNMP entity FRU control traps
  gdoi             Enable SNMP GDOI traps
  hsrp             Enable SNMP HSRP traps
  ike              Enable IKE traps
  ipmobile         Enable SNMP ipmobile traps
  ipmulticast      Enable SNMP ipmulticast traps
  ipsec            Enable IPsec traps
  ipsla            Enable SNMP IP SLA traps
  isdn             Enable SNMP isdn traps
  isis             Enable IS-IS traps
  l2tun            Enable SNMP L2 tunnel protocol traps
  memory           Enable SNMP Memory traps
  mpls             Enable SNMP MPLS traps
  msdp             Enable SNMP MSDP traps
  mvpn             Enable Multicast Virtual Private Networks traps
  nhrp             Enable SNMP NHRP traps
  ospf             Enable OSPF traps
  ospfv3           Enable OSPFv3 traps
  pim              Enable SNMP PIM traps
  pppoe            Enable SNMP pppoe traps
  pw               Enable SNMP PW traps
  resource-policy  Enable CISCO-ERM-MIB notifications
  rf               Enable all SNMP traps defined in CISCO-RF-MIB
  rsvp             Enable RSVP flow change traps
  snmp             Enable SNMP traps
  srst             Enable SNMP srst traps
  stun             Enable SNMP STUN traps
  syslog           Enable SNMP syslog traps
  trustsec-sxp     Enable SNMP CISCO-TRUSTSEC-SXP-MIB traps
  tty              Enable TCP connection traps
  voice            Enable SNMP voice traps
  vrfmib           Allow SNMP vrfmib traps
  vrrp             Enable SNMP vrrp traps
  waas             Enable WAAS traps
  xgcp             Enable XGCP protocol traps
As you can see, there is a long list of events that can generate traps. Some of these traps offer granularity of configuration, while others are all or nothing. As you can see in the following snippet, OSPF has a rich set of notification options, whereas EIGRP doesn’t have any.
Router1(config)#snmp-server enable traps eigrp ?
  <cr>

Router1(config)#snmp-server enable traps ospf ?
  cisco-specific  Cisco specific traps
  errors          Error traps
  lsa             Lsa related traps
  rate-limit      Trap rate limit values
  retransmit      Packet retransmit traps
  state-change    State change traps
  <cr>
Router1(config)#snmp-server enable traps ospf lsa ?
  lsa-maxage     Lsa aged to maxage
  lsa-originate  New lsa originated
  <cr>
You can also control traps within an interface. For example, if you don’t want to trap on the link status of an interface, you can disable the link-status trap. This is useful for non-critical interfaces, because it prevents the network device from alarming the network manager every time the link status changes.
Router1(config)#int eth0/1
! Disable the trap
Router1(config-if)#no snmp trap link-status
Router1(config-if)#do show run int eth0/1
Building configuration...

Current configuration : 90 bytes
!
interface Ethernet0/1
 ip address 10.1.1.1 255.255.255.0
 no snmp trap link-status
end

! Reenable the trap
Router1(config-if)#snmp trap link-status
For the following examples, you use a simple two-router network connected to a Zenoss virtual machine, as shown in Figure 18-3.
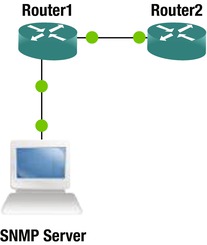
Figure 18-3. SNMP trap example network
In this example, you are using SNMPv2 to send traps to the SNMP server at 172.16.1.2.
Router1(config)#snmp-server community public ro
Router1(config)# snmp-server host 172.16.1.2 traps version 2c public
! Type question mark at the end of this line.  Notice how you can filter on types of traps that can be sent to a specified SNMP server.
Router1(config)# snmp-server host 172.16.1.2 traps version 2c public ?
  aaa_server               Allow SNMP AAA traps
  atm                      Allow SNMP atm traps
  auth-framework           Allow SNMP CISCO-AUTH-FRAMEWORK-MIB traps
  bfd                      Allow SNMP BFD traps
<output trunctated>
Router1(config)#snmp-server trap-source Ethernet 0/0
Router1(config)#snmp-server enable traps config
Now you need to configure the SNMP server to communicate with the router. In this last example, you used “public” as the read-only community string. Since that is the default in Zenoss, it was able to automatically find the device in a network scan. The network manager executed a network walk of the device, which showed that it is a Cisco router with IOS 15.4, and it pulled interface information from the router.
In this example, you use ping with a range of sizes to generate traffic on the interface between Router1 and Router2.
Router1#ping
Protocol [ip]:
Target IP address: 10.1.1.2
Repeat count [5]:
Datagram size [100]: 1000
Timeout in seconds [2]:
Extended commands [n]: n
Sweep range of sizes [n]: y
Sweep min size [36]:
Sweep max size [18024]: 1500
Sweep interval [1]:
After letting this run for several minutes, you can see traffic starting to show up on the graph in Zenoss. Notice that Ethernet0/1 in Figure 18-4 shows a warning symbol. This is because the throughput is above the default threshold in Zenoss.

Figure 18-4. Zenoss interface monitoring
Earlier, we mentioned that the structure of SNMP is one of its advantages. However, this relies on the SNMP manager and the managed device sharing MIBs. In the example, you configured snmp-server enable traps config, but didn’t add the MIB to Zenoss. That doesn’t mean it ignored the information. Instead, when a config trap was received, it showed an unknown trap with the object ID 1.3.6.1.4.1.9.9.43.2.0.1. Notice how the trap is reflected in Figure 18-5. Even without matching MIBs, you can search the Internet when you see an unknown trap to discover what caused it. The solution to this problem is simple: you should install the appropriate MIBs. With Zenoss, this can be done by installing the Cisco Devices Zenpack.

Figure 18-5. Traps in Zenoss
Now, you will configure OSPF on Router1 and Router2, and configure traps for LSA origination and neighbor state changes. After configuring OSPF, you can see a trap in Zenoss for LSA origination.
Router1(config)#snmp-server enable traps ospf lsa lsa-originate
Router1(config)#snmp-server enable traps ospf state-change
Router1(config)#int eth0/1
Router1(config-if)#ip ospf 1 area 0
Router1(config-if)#interface Loopback0
Router1(config-if)#ip add 1
*May 31 22:07:02.978: %LINEPROTO-5-UPDOWN: Line protocol on Interface Loopback0, changed state to up
Router1(config-if)#ip add 1.1.1.1 255.255.255.255
Router1(config-if)#ip ospf 1 area 0

Router2(config-if)#int eth0/0
Router2(config-if)#ip ospf 1 area 0
Router2(config-if)#
*May 31 22:04:17.365: %OSPF-5-ADJCHG: Process 1, Nbr 172.16.1.1 on Ethernet0/0 from LOADING to FULL, Loading Done
In addition to enabling traps, some protocols or metrics have configurable thresholds. In the following example, you set the CPU threshold extremely low so that you can attempt to trigger a trap. When the CPU utilization goes above the rising threshold, it generates a trap, and then it sends another trap when it goes below the falling threshold.
Router1(config)#process cpu threshold type total rising 2 interval 5 falling 1  interval 5
Router1(config)#snmp-server enable traps cpu threshold
A few other common software suites that include SNMP management are Nagios, Solarwinds, and HP Operations Manager. Nagios is popular because it has an open source version and an enterprise version. This allows users to familiarize themselves with the project, and then make an easy transition to the enterprise version when their environment outgrows the open source version. They provide an interactive demo to allow users to explore Nagios in a preconfigured environment. The demo can be found at http://demos.nagios.com.
The Solarwinds suite is the Swiss army knife of network management tools. One of the components of the Solarwinds suite is the Orion Network Performance Monitor (NPM). A demo of this product is available at http://oriondemo.solarwinds.com. Solarwinds NPM provides a wealth of information. The landing page for this demo is shown in Figure 18-6.

Figure 18-6. Orion NPM demo
From the demo, you can see how it alerts and provides information about links and hosts. As you drill down through different views, you can not only see the status of network devices, but see network maps that illustrate saturation points. The drawback of the system is the cost and the server resource requirements for the system.
Service Level Agreements and Embedded Event Manager
In addition to the logs and SNMP traps that are intrinsically part of IOS, you can write custom event handlers.
The IP SLA feature allows tracking of reachability, jitter, and delay. The actions based on IP SLA state can be used to change routing, change first hop redundancy priority, or send an SNMP trap. In Chapter 10, you saw an example of an IP SLA that modified a route based on reachability of a remote host. In this example, you look at custom logging with IP SLA using the network depicted in Figure 18-7.
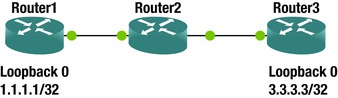
Figure 18-7. IP SLA example network
You are using an IP SLA test that requires a responder, so you must configure it on the destination router. The TCP connect test is useful to ensure that there aren’t any network issues that will prevent the TCP handshake. In some cases, an ICMP echo test will pass, even when there are problems that will prevent TCP connections.
Router1(config)#ip sla 1
Router1(config-ip-sla)#tcp-connect 3.3.3.3 9999
Router1(config-ip-sla-tcp)#frequency 60
Router1(config-ip-sla-tcp)#timeout 200
Router1(config-ip-sla-tcp)#threshold 100

Router1(config-ip-sla-tcp)#exit

! Set up responder on Router3
Router3(config)#ip sla responder
Router3(config)#ip sla responder tcp-connect ipaddress 3.3.3.3 port 9999

! Schedule SLA on Router1 to run indefinately
Router1(config)#ip sla schedule 1 life forever start-time now

! Verify that Router1 is getting responses
Router1#show ip sla summary
IPSLAs Latest Operation Summary
Codes: * active, ^ inactive, ~ pending

ID         Type        Destination       Stats       Return      Last
                                         (ms)        Code        Run
-----------------------------------------------------------------------
*1         tcp-connect 3.3.3.3           RTT=1       OK          48 seconds ago

! Configure Router1 to send SNMP traps on IP SLA state changes

Router1(config)#ip sla logging traps
Router1(config)#ip sla reaction-configuration 1 react connectionLoss action-type trapAndTrigger threshold-type immediate
Router1(config)#snmp-server enable traps ipsla

! Now, lets verify that the router is sending traps
Router1#debug snmp packets
! Make 3.3.3.3 unreachable by routing it to null0
Router1(config)#ip route 3.3.3.3 255.255.255.255 null 0

! We can see the console log messages and the SNMP trap packets that the router is generating
Router1(config)#
*Jun  2 10:07:32.024: %RTT-4-OPER_CLOSS: condition occurred, entry number = 1
*Jun  2 10:07:32.025: SNMP: Queuing packet to 192.168.12.2
*Jun  2 10:07:32.025: SNMP: V1 Trap, ent rttMonNotificationsPrefix, addr 192.168.12.1, gentrap 6, spectrap 1
 rttMonCtrlAdminTag.1 =
 rttMonHistoryCollectionAddress.1 = 03 03  03 03
 rttMonCtrlOperConnectionLostOccurred.1 = 1
*Jun  2 10:07:32.027: SNMP: Queuing packet to 192.168.12.2
*Jun  2 10:07:32.027: SNMP: V1 Trap, ent rttMonNotificationsPrefix, addr 192.168.12.1, gentrap 6, spectrap 5
 rttMonCtrlAdminTag.1 =
 rttMonHistoryCollectionAddress.1 = 03 03  03 03
 rttMonReactVar.1 = 8
 rttMonReactOccurred.1 = 1
 rttMonReactValue.1 = 1
 rttMonReactThresholdRising.1 = 0
 rttMonReactThresholdFalling.1 = 0
 rttMonEchoAdminLSPSelector.1 =
00 00  00 00   00 00  00 0A    B5 2D  30 E0   B3 43  5D C0
80 14  2F B4   2C D1  47 B3    75 8D  DA 0B
*Jun  2 10:07:32.032: SNMP: Queuing packet to 192.168.12.2
*Jun  2 10:07:32.032: SNMP: V1 Trap, ent rttMonNotificationsPrefix, addr 192.168.12.1, gentrap 6, spectrap 5
 rttMonCtrlAdminLongTag.1 =
 rttMonHistoryCollectionAddress.1 = 03 03  03 03
 rttMonReactVar.1 = 8
 rttMonReactOccurred.1 = 1
 rttMonReactValue.1 = 1
 rttMonReactThresholdRising.1 = 0
 rttMonReactThresholdFalling.1 = 0
 rttMonEchoAdminLSPSelector.1 =
00 00  00 00   00 00  00 0B    B5 2D  30 E0   B3 43  5D C0
00 00  00 00   00 00  00 0A    B5 2D  30 E0
Router1(config)# exit
*Jun  2 10:07:32.036: %RTT-3-IPSLATHRESHOLD: IP SLAs(1): Threshold Occurred for connectionLoss

! Looking in the log file shows that the even was also sent to syslog
Router1#show log | include RTT
*Jun  2 10:07:32.024: %RTT-4-OPER_CLOSS: condition occurred, entry number = 1
*Jun  2 10:07:32.036: %RTT-3-IPSLATHRESHOLD: IP SLAs(1): Threshold Occurred for connectionLoss
For more granularity of control, Cisco’s EEM can be used to monitor events and make configuration changes to a device, send emails, send SNMP traps, or write to the event log when an event is triggered.
Let’s continue the IP SLA example by integrating it with EEM.
! Remove the null route from the previous example
Router1(config)#no ip route 3.3.3.3 255.255.255.255 null 0

! In our example we will monitor the SNMP OID for the ICMP RTT SLA
Router1(config)#ip sla 2
Router1(config-ip-sla)#icmp-echo 3.3.3.3
Router1(config-ip-sla-echo)#threshold 100
Router1(config-ip-sla-echo)#timeout 500
Router1(config-ip-sla-echo)#frequency 10
Router1(config-ip-sla-echo)#exit
Router1(config)#ip sla schedule 2 start-time now life forever

Router1(config)#event manager applet SLA_Connect_Failure
! The last value in the OID is the SLA number
Router1(config-applet) event snmp oid 1.3.6.1.4.1.9.9.42.1.2.9.1.6.2 get-type exact entry-op eq entry-val 1 exit-op eq exit-val 2 poll-interval 5
Router1(config-applet)#action 1.0 syslog msg "Failed to ping to 3.3.3.3"
! Additional actions can be added. They are processed in order by a character comparison.  This means 11.0 is less than 9.0, because the 11.0 starts with lower character the 9.0.
Router1(config-applet)#exit

! Add null route
Router1(config)#ip route 3.3.3.3 255.255.255.255 null 0
Router1(config)# exit
! We see our custom log message in the console log.  It will also be sent to buffer or an external syslog, if configured.
*Jun  2 10:40:13.051: %HA_EM-6-LOG: SLA_Connect_Failure: Failed to ping to 3.3.3.3

! Here we can see that the policy triggered
Router1# show event manager statistics  policy

                                       Average        Maximum
No.  Class     Triggered   Suppressed  Run Time       Run Time       Name
-------------------------------------------------------------------------------
1    applet    1           0           0.001          0.001          SLA_Connect_Failure
 event {} snmp
sFlow and Netflow were discussed in Chapter 10. This chapter focuses on what a Netflow tool looks like and why it is valuable.
Netflow tools are commonly used to analyze problems with uneven balancing between links. Think of a scenario where you have several links leaving a site. This could either be in a link aggregation group or completely separate paths. The SNMP link utilization metric shows that some links are close to 100% utilized, while others are less than 20% utilized. The SNMP link utilization data doesn’t allow for granular analysis. This is where Netflow comes into play. With Netflow, one can see statistics about the flows, which include source and destination addresses and ports. Netflow data is also useful to look for problems in Quality of Service policies and to look for noisy applications.
Many of the network management suites include management of syslog, SNMP, and the display of Netflow data. There are also stand-alone tools for displaying Netflow. The following are some of the freely available tools:
- Caida NetraMet
- Flow Tools Flow Viewer
- Flowd
- IPFlow
- NetFlow Monitor
- NTop
- Panoptis
- Plixer Scrutinizer
- Stager
Even though “free” is enticing, total cost of ownership is always a consideration. The burden of using several independent tools can make an enterprise solution with a high procurement cost more attractive.
For the rest of the discussion on Netflow analysis, you will use the Orion demo from Solarwinds. Let’s continue with the example of link utilization. Assume that you got an alert that the throughput on Gigabit 0/1.2022 has exceeded the threshold. Drilling down on that link in the Netflow tool results in the output shown in Figure 18-8, which shows that conversations from a pair of addresses are taking up 78% of the link.

Figure 18-8. Orion Netflow
As you can see in Figure 18-9, drilling down further shows that the traffic is web traffic with a random source port and a destination port of 80. Assume that this port is part of a port channel. If the hashing is set to use only the source and destination addresses, the conversations will have an affinity to one link. In this case, changing the distribution to use layer 4 information will improve the flow distribution.
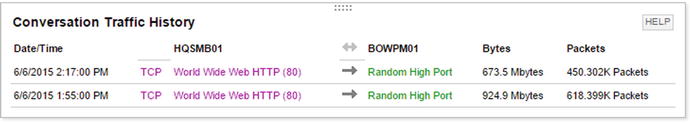
Figure 18-9. Orion Netflow conversation history
Let’s assume that you are expecting layer 3 equal cost multipathing (ECMP). The hashing algorithm used by CEF can hit the same polarization problem as seen in layer 2 port channels. The analysis will be essentially the same and the solution will be similar, except you will be changing ip cef load-sharing algorithm instead of port-channel load-balance.
One additional step in the analysis of diverse paths at layer 3 is to ensure that the paths are installed in the routing tables. In some cases, you might want path affinity, but you still want to distribute the load across multiple links. The data provided from Netflow can help you design traffic engineering such that habitually large conversations are distributed across the links appropriately.
The next case discusses is Quality of Service (QoS) analysis and design. Netflow and sFlow statistics can show the amount of data transiting an interface, grouped by the class of service. Figure 18-10 shows an example where approximately 40% of the traffic is either voice or video. This data can be used to develop the QoS policy for the device. What would you do if users are complaining about network performance for web applications? Using the sFlow data you see that the default class is getting 18.98% of the bandwidth. Digging further, you see that there are a significant number of drops. At this point, you need to make a design decision.
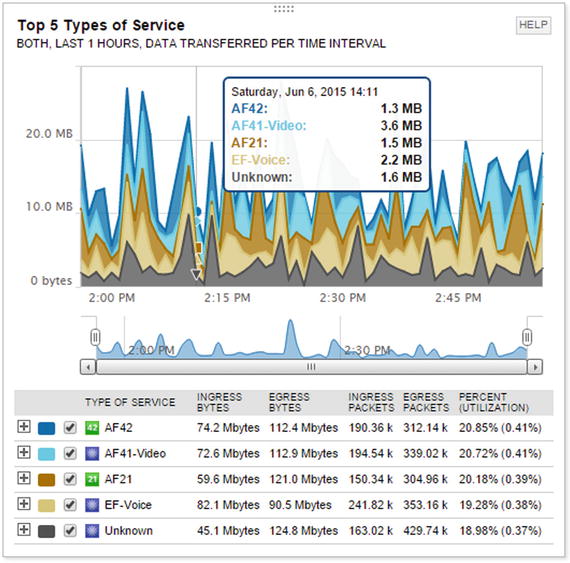
Figure 18-10. Quality of Service
The Quality of Service decision for a link is often based on modeling application flows. When a new application is introduced to the network, it is useful to get an idea about its flows. This is another use of Netflow data. For this example, assume that you installed a server, BOWPM01, and you want to look at its conversations, protocols, and the network paths it uses. Searching for the endpoint BOWPM01 shows that the Netflow collectors at BOWAN and HQWAN have information about it. Drilling into either collector will show conversations that transited those devices, including protocol and endpoint information. Figure 18-11 shows the data from the perspective of BOWAN.
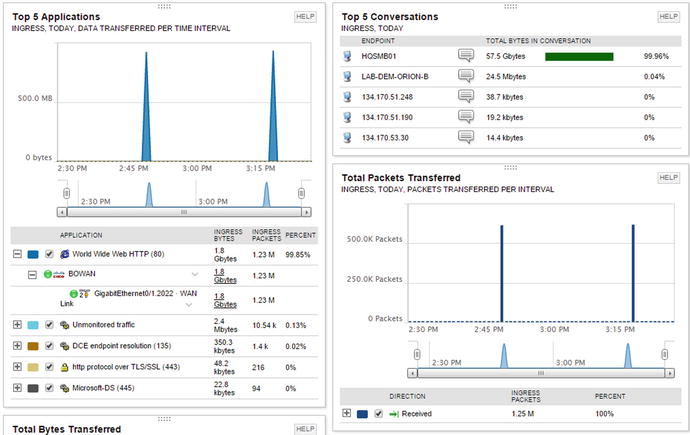
Figure 18-11. Netflow application modeling
The use of Netflow data doesn’t need to be targeting. The graphs that show Top N utilization can help find noisy applications and hosts. The built-in graphs show the top five conversations, the top ten applications, and the top ten endpoints. The endpoints don’t necessarily need to be in your network, as long as the conversation transits one of your Netflow collectors.
Figure 18-12 shows that YouTube.com is a top endpoint in the demo network. If users of the network don’t have a work-related reason to visit that site, and the bandwidth to the Internet links are congested, it might be useful to restrict the flow to that source. However, more analysis should be done before taking such actions. In the case of YouTube.com, DNS might have resolved the IPs to YouTube.com, but some of the hosts might actually be other Google servers that you don’t want to restrict.

Figure 18-12. Top endpoints
Intrusion Detection and Prevention Systems
Intrusions can often be detected by using signatures at the packet level or by analyzing composite data in tools, such as some of the management tools discussed in this chapter.
Dedicated sensors that capture traffic that transits the network are good choices for IDS components. Sourcefire was a leading vendor for intrusion detection. Its appliances were based on the open source application Snort. Now that it has been acquired by Cisco, the products are being integrated with Cisco’s next generation of firewalls and malware protection appliances.
A basic network intrusion detection sensor is usually signature based. Signatures look for patterns that match an exploit, but do not match normal traffic. Signature-based intrusion detection systems can quickly match data flows against their signature database, and then take action on the result. For example, an inline Intrusion Detection System Service Module (ISDM-2) can process 500 Mbps of traffic in inline mode and 600 Mbps in passive mode. The difference between inline and passive is whether the system holds a packet while it is making a decision or if it just inspects a copy of the packet. An advantage of inline detection is that it can stop the malicious packet and not just send an alarm or reset.
The ISDM-2 is convenient in that it integrates directly into a Catalyst 6500 chassis, but it can’t compare to the cutting edge of appliances. The FirePOWER intrusion prevention systems that are based on Sourcefire technology boast a throughput up to 60 Gpbs. Cisco also boasts that the FirePOWER appliance has anomaly detection capabilities, even though you can’t expect the same performance with anomaly detection as with signature detection. This is because anomaly detection isn’t matching on exact patterns. Instead, it is looking for events that break the normal pattern.
Another possible intrusion detection sensor is a router itself. However, using a router as an intrusion detection system is usually a poor design choice, due to the resource utilization required for intrusion detection. For the purposes of example, you will use a router like a sensor. In this example, you are using Network-Based Application Recognition (NBAR) to match patterns. NBAR is a tool for QoS, but QoS policies can be used to thwart intrusion attempt. If you are following along in this example with virtual routers, and you see traceback errors, it is likely because of insufficient memory. On GNS3, there is an option to override the default RAM size. You are using 512 MB of virtual RAM.
In this example, you are looking for web traffic coming from the 10.0.0.0/24 with a packet size of 1000 bytes. If you explore the options for matching protocols, you can see that there are many more options.
! Match the source IP address
Router1(config)#ip access-list standard FROM_10_0_0_0
Router1(config-std-nacl)#permit 10.0.0.0 0.0.0.255
Router1(config-std-nacl)#exit

Router1(config)#class-map match-all BAD_HTTP
! Match the predefined access list.
Router1(config-cmap)#match access-group name FROM_10_0_0_0
Router1(config-cmap)#match protocol http
Router1(config-cmap)#match packet length min 1000 max 1000
Router1(config-cmap)#exit

! Now we need to do something with the class map
! We could rate limit matches, set the DSCP, or drop them
! In this example, we are dropping the matches
Router1(config)#policy-map DROP_BAD
Router1(config-pmap)#class BAD_HTTP
Router1(config-pmap-c)#drop
Router1(config-pmap-c)#exit
! Allow everythign else in default class
Router1(config-pmap)#class class-default
Router1(config-pmap-c)#exit
Router1(config-pmap)#exit

! Now we need to bind it to an interface or the control plane
Router1(config)#interface Ethernet 0/0
Router1(config-if)#service-policy input DROP_BAD
Some platforms also support Flexible Packet Matching (FPM). FPM allows you to search for regular expression anywhere in the packet. It also allows you constrain where it can match. FPM gives a router the flexibility to write complex rules, but remember that it comes at the cost of performance. FPM is configured in class maps and it can be combined with other techniques, such as protocol and access list matches.
Management and Design of Management Data
An issue with remotely monitoring systems is the flow of data for management. Some network devices have a designated port for out-of-band management, but many forward monitoring and management information over the data path. This can lead to security issues and bandwidth issues.
When designing the flow of management data, it is best to really look at your requirements and your resources. The approach of logging everything and then sorting through it later can provide the best forensic capabilities. If you don’t have the bandwidth or storage space to support it, then you need to decide what you really need to log or trap. In the case of SNMP pulls from a NMS, it is common to pull a device every 5 minutes for health and status. If that is causing too much of a burden on the devices and network, you should look at increasing the interval span.
A decent general rule for logging is to log the information that provides the most useful information. Think about the case of an edge switch that services user desktops. Do you really need to know every time a desktop port goes up or down, or whether information about the uplink is sufficient? On a distribution device, if you were limited to either logging EIGRP neighbor changes or port state changes, which would you pick? Assuming all of the important ports are have EIGRP neighbors, the EIGRP message would provide the most information.
If you aren’t able to design an architecture for management and monitoring that ensures that bandwidth demands don’t exceed the availability, you can use shaping and policing to restrict management flows. In addition to shaping, some protocols, such as EIGRP, have built-in controls to limit bandwidth utilization.
Two ways to throttle management and control plane traffic are with Control Plane Policing (CoPP) and through service policies bound to an interface. Policing the control plane is useful for data destined to the network device. Policies on an interface are good for traffic transiting the device.
Let’s look at an example of CoPP. In this example, you drop any packets destined to the Telnet port. You limit ICMP to 8000 bps. You police 1,000,000 bps to routing protocols, but you transmit even when it exceeds the threshold. You limit all other control plane traffic to 16000 bps.
! Create required access lists
Router1(config)#ip access-list extended TELNET
Router1(config-ext-nacl)#permit tcp any eq telnet any
Router1(config-ext-nacl)#permit tcp any any eq telnet
Router1(config-ext-nacl)#exit
Router1(config)#ip access-list extended ICMP
Router1(config-ext-nacl)#permit icmp any any
Router1(config-ext-nacl)#exit
Router1(config)#ip access-list extended ROUTING
Router1(config-ext-nacl)#permit eigrp any any
Router1(config-ext-nacl)#permit tcp any any eq bgp
Router1(config-ext-nacl)#permit tcp any eq bgp any
Router1(config-ext-nacl)#exit
! Create class maps
Router1(config)#class-map TELNET
Router1(config-cmap)#match access-group name TELNET
Router1(config-cmap)#exit
Router1(config)#class-map ICMP
Router1(config-cmap)#match access-group name ICMP
Router1(config-cmap)#exit
Router1(config)#class-map ROUTING
Router1(config-cmap)#match access-group name ROUTING
Router1(config-cmap)#exit
Router1(config)#

! Create policy maps
Router1(config)#policy-map COPP
Router1(config-pmap)#class TELNET
Router1(config-pmap-c)#drop
Router1(config-pmap-c)#exit
Router1(config-pmap)#class ICMP
Router1(config-pmap-c)#police 8000 conform-action transmit exceed-action drop
Router1(config-pmap-c-police)#exit
Router1(config-pmap-c)#exit
Router1(config-pmap)#class ROUTING
Router1(config-pmap-c)# police 1000000 conform-action transmit exceed-action transmit
Router1(config-pmap-c-police)#exit
Router1(config-pmap-c)#exit
Router1(config-pmap)#class class-default
Router1(config-pmap-c)#police 16000 conform-action transmit exceed-action drop
Router1(config-pmap-c-police)#exit
Router1(config-pmap-c)#exit
Router1(config-pmap)#exit

! Now we need to bind the polict map to the control plane
Router1(config)#control-plane
Router1(config-cp)#service-policy input COPP
Router1(config-cp)#exit
Router1(config)#
*Jun  7 14:14:12.183: %CP-5-FEATURE: Control-plane Policing feature enabled on Control plane aggregate path
For traffic leaving the router, here is an example of traffic shaping. You use the same class maps, but create a new policy map.
Router1(config)#policy-map SHAPER
Router1(config-pmap)#class ICMP
! This will match all ICMP going through the router since the access list specifies any source and any destination
Router1(config-pmap-c)#shape average 8000
Router1(config-pmap-c)#class ROUTING
Router1(config-pmap-c)#shape average 1000000
Router1(config-pmap)#class class-default
! This is all unmarked traffic on the interface.
! We should give it the rest of the bandwidth
Router1(config-pmap-c)#bandwidth remaining percent 100
Router1(config-pmap-c)#interface Eth0/0
Router1(config-if)#service-policy output SHAPER
Access lists on interfaces are useful for securing flows to and through a network device. One thing you must keep in mind is that the default behavior of an access list is to deny anything that isn’t explicitly permitted. If you are trying to secure traffic to a router, you should specify the traffic to the router that should be permitted, deny all other traffic destined to an interface on the router, and then explicitly permit all transit traffic. If you don’t specifically permit the transit traffic, it will be denied by the implicit deny at the end of the access list. It is also essential to fully understand which flows are going to the router. If you are uncertain, you can log denies, but that should be a temporary measure. You also need to remember that a router may have multiple interfaces, including loopback interfaces, which may need to be included in an access list. In the following example, you permit protocols that should be allowed to the router using any destination, and then you explicitly deny the addresses on the router for everything else. In reality, this access list is too permissive and you would need to ascertain more detailed source and destination information before making the access list.
! Set up an object group for the local addreses
Router1(config)#object-group network LOCAL_IP
Router1(config-network-group)#host 1.1.1.1
Router1(config-network-group)#host 192.168.12.1
Router1(config-network-group)#host 192.168.13.1
Router1(config-network-group)#exit
Router1(config)#ip access-list extended PROTECT_ME
Router1(config-ext-nacl)#permit icmp any any
Router1(config-ext-nacl)#permit eigrp any any
Router1(config-ext-nacl)#permit ospf any any
Router1(config-ext-nacl)#permit tcp any eq bgp any
Router1(config-ext-nacl)#permit tcp any any eq bgp
Router1(config-ext-nacl)#permit pim any any
Router1(config-ext-nacl)#permit igmp any any
Router1(config-ext-nacl)#permit tcp any any eq 22
Router1(config-ext-nacl)#permit tcp any eq 22 any
Router1(config-ext-nacl)#permit udp any any eq syslog
Router1(config-ext-nacl)#permit udp any any eq snmptrap
Router1(config-ext-nacl)#permit udp any any eq snmp
Router1(config-ext-nacl)#permit udp any eq snmp any
! Now deny everything else to the router
Router1(config-ext-nacl)#deny ip any object-group LOCAL_IP
! Now permit everything else
Router1(config-ext-nacl)#permit ip any any
Router1(config-ext-nacl)#exit

! Bind to the access list to an interface
Router1(config)#interface ethernet 0/0
Router1(config-if)#ip access-group PROTECT_ME in
Router1(config-if)#ip access-group PROTECT_ME out
To even further protect the management plane, you can use virtual routing and forwarding (VRF). VRFs is discussed further in Chapter 23 with MPLS, but for now you just need to understand that it creates a separation in the routing and forwarding tables. When you create a VRF on a router, interfaces are isolated from those in other VRFs or in the default routing table.
Router1(config)#vrf definition MANAGEMENT
Router1(config-vrf)#rd 1:1
Router2(config-vrf)# address-family ipv4
Router1(config-vrf-af)#int loopback0
Router1(config-if)#vrf forwarding MANAGEMENT
% Interface Loopback0 IPv4 disabled and address(es) removed due to disabling VRF MANAGEMENT
Router1(config-if)#ip add 1.1.1.1 255.255.255.255
Router1(config-if)#exit
Router1(config)#exit
Notice that the connected interface Loopback0 isn’t showing up in the global address table. You need to specify the VRF to see its routing table.
Router1#show ip route
Codes: L - local, C - connected, S - static, R - RIP, M - mobile, B - BGP
       D - EIGRP, EX - EIGRP external, O - OSPF, IA - OSPF inter area
       N1 - OSPF NSSA external type 1, N2 - OSPF NSSA external type 2
       E1 - OSPF external type 1, E2 - OSPF external type 2
       i - IS-IS, su - IS-IS summary, L1 - IS-IS level-1, L2 - IS-IS level-2
       ia - IS-IS inter area, * - candidate default, U - per-user static route
       o - ODR, P - periodic downloaded static route, H - NHRP, l - LISP
       a - application route
       + - replicated route, % - next hop override

Gateway of last resort is not set

      192.168.12.0/24 is variably subnetted, 2 subnets, 2 masks
C        192.168.12.0/24 is directly connected, Ethernet0/0
L        192.168.12.1/32 is directly connected, Ethernet0/0
Router1#
Router1#show ip route vrf MANAGEMENT

Routing Table: MANAGEMENT
Codes: L - local, C - connected, S - static, R - RIP, M - mobile, B - BGP
       D - EIGRP, EX - EIGRP external, O - OSPF, IA - OSPF inter area
       N1 - OSPF NSSA external type 1, N2 - OSPF NSSA external type 2
       E1 - OSPF external type 1, E2 - OSPF external type 2
       i - IS-IS, su - IS-IS summary, L1 - IS-IS level-1, L2 - IS-IS level-2
       ia - IS-IS inter area, * - candidate default, U - per-user static route
       o - ODR, P - periodic downloaded static route, H - NHRP, l - LISP
       a - application route
       + - replicated route, % - next hop override

Gateway of last resort is not set

      1.0.0.0/32 is subnetted, 1 subnets
C        1.1.1.1 is directly connected, Loopback0
Router1#
By simply defining a VRF, you have only succeeded at isolating an interface. To be useful, you need to connect the VRF to other routers. You can do this either through VRF-lite or with MPLS. In this example, you configure a VLAN subinterface as a member of the MANAGEMENT VRF. By doing this on all routers in the network, you can create a management network with a separate address space and routing tables. Then you can safely block anything except transit traffic on the data plane routing interfaces.
Router1(config-if)#int eth0/0.10
Router1(config-subif)#encapsulation dot1Q 10
Router1(config-subif)#vrf forwarding MANAGEMENT
Router1(config-subif)#ip add 10.0.0.1 255.255.255.0
! Using different OSPF process as non-VRF interface
Router1(config-subif)#ip ospf 2 area 0
Exercises
For the exercises in this chapter, you will use two routers, configured as shown in Figure 18-13. Before starting on the first exercise, configure the loopback interfaces and the Ethernet interfaces. Configure EIGRP in named mode and verify that each router has an EIGRP route to the other router’s loopback.

Figure 18-13. Chapter exercises
Configure syslog on Router1 to send logging messages to 10.2.2.2. Use the default protocol, but add a zero to the end of the default destination port. Use the loopback interface as the source for syslog messages. Configure syslog to only log messages with a severity of “informational” or higher.
Configure EIGRP to log neighbor changes.
Verify logging with debug. Shut down Ethernet0/0 on Router2, and then reenable it after EIGRP goes down. This should cause an EIGRP neighbor relationship message. You will not actually have a syslog server. You are only verifying that the router attempted to generate a syslog message.
Configure Router1 to send SNMP traps to 192.168.12.2. Use SNMPv3 with username Apress and password Password. Set authentication, but not privacy for the SNMP traps. Enable traps only for EIGRP. Source traps from Loopback0.
Verify the task by causing the EIGRP neighbor relationship to break and then reestablish while you are debugging SNMP packets.
Create a policy to protect the control plane of Router1. Allow SSH with a rate limit of 16000 bps. Allow EIGRP to use 8000 bps. Drop all other traffic on the control plane.
Verify that EIGRP routing is still working, but that ICMP fails from Router2 to Router1.
Exercise Answers
The solution to the exercises is provided in this section. Where applicable, the configuration is provided with explanation.
Initial Configuration
Before starting the lab exercises, you need to set up the basic network. The following configuration snippets provide one solution for the initial configuration of the routers.
Router1
interface Loopback0
 ip address 10.1.1.1 255.255.255.255
interface Ethernet0/0
 ip address 192.168.12.1 255.255.255.0
router eigrp Apress
 !
 address-family ipv4 unicast autonomous-system 100
  !
  topology base
  exit-af-topology
  network 0.0.0.0
 exit-address-family
Router2
interface Loopback0
 ip address 10.2.2.2 255.255.255.255
interface Ethernet0/0
 ip address 192.168.12.2 255.255.255.0
router eigrp Apress
 !
 address-family ipv4 unicast autonomous-system 100
  !
  topology base
  exit-af-topology
  network 0.0.0.0
 exit-address-family
syslog
This exercise asked to send syslog messages using the default protocol, but change the default port by appending a zero to the port number. That would make the destination port UDP 5140.
Router1(config)#logging host 10.2.2.2 transport udp port 5140
Router1(config)#logging source-interface Loopback 0
Router1(config)#logging trap informational

Router1(config)#router eigrp Apress
Router1(config-router)#address-family ipv4 unicast autonomous-system 100
Router1(config-router-af)#eigrp log-neighbor-changes
To verify logging using debug, let’s define an access list, then debug packets against that list.
Router1(config)#access-list 100 permit udp any any eq 5140
Router1(config)#end
Router1#debug ip packet 100 detail
Now shut down Eth0/0 on Router2. Once you see that EIGRP went down, reenable the interface and observe the result on Router1.
Router2(config)#int eth0/0
Router2(config-if)#shut
Router2(config-if)#no shut
On Router1, you can see that it attempted to send a syslog message to the destination.
Router1#
*Jun  7 19:55:36.313: %DUAL-5-NBRCHANGE: EIGRP-IPv4 100: Neighbor 192.168.12.2 (Ethernet0/0) is up: new adjacency
*Jun  7 19:55:37.388: IP: s=10.1.1.1 (local), d=10.2.2.2, len 150, local feature
*Jun  7 19:55:37.388:     UDP src=52019, dst=5140, Logical MN local(14), rtype 0, forus FALSE, sendself FALSE, mtu 0, fwdchk FALSE
*Jun  7 19:55:37.388: FIBipv4-packet-proc: route packet from (local) src 10.1.1.1 dst 10.2.2.2
*Jun  7 19:55:37.389: FIBfwd-proc: Default:0.0.0.0/0 process level forwarding
*Jun  7 19:55:37.389: FIBfwd-proc: depth 0 first_idx 0 paths 1 long 0(0)
*Jun  7 19:55:37.389: FIBfwd-proc: try path 0 (of 1) v4-sp first short ext 0(-1)
*Jun  7 19:55:37.389: FIBfwd-proc: v4-sp valid
*Jun  7 19:55:37.389: FIBfwd-proc:  no nh type 8  - deag
Router1#
*Jun  7 19:55:37.389: FIBfwd-proc: ip_pak_table 0 ip_nh_table 65535 if none nh none deag 1 chg_if 0 via fib 0 path type special prefix
*Jun  7 19:55:37.389: FIBfwd-proc: Default:0.0.0.0/0 not enough info to forward via fib (none none)
*Jun  7 19:55:37.389: FIBipv4-packet-proc: packet routing failed
*Jun  7 19:55:37.389: IP: s=10.1.1.1 (local), d=10.2.2.2, len 150, unroutable
*Jun  7 19:55:37.389:     UDP src=52019, dst=5140
Router1#
Now disable debugging.
Router1#undebug all
All possible debugging has been turned off
SNMP
The task for this exercise is to configure SNMPv3 with a destination of 192.168.12.2. The following snippets show the configuration and verification required for this task.
Router1(config)#snmp-server group ApressGroup v3 auth
Router1(config)#snmp-server user Apress ApressGroup v3 auth sha Password
Router1(config)#snmp-server host 192.168.12.2 version 3 auth Apress
Router1(config)#snmp-server enable traps eigrp
Router1(config)#snmp-server trap-source Loopback0
Router1(config)#exit

Router1#debug snmp packets
SNMP packet debugging is on

Router2(config)#int eth0/0
Router2(config-if)#shut
Router2(config-if)#no shut
Now, you look at the SNMP messages sent by Router1.
Router1#
sysUpTime.0 = 271350
 snmpTrapOID.0 = cEigrpNbrDownEvent
 cEigrpPeerAddr.0.100.0 = 192.168.12.2
 cEigrpPeerAddrType.0.100.0 = 1
*Jun  7 20:12:44.608: SNMP: Packet sent via UDP to 192.168.12.2
Router1#
Service Policy
This is a straightforward, yet unrealistic policy. First, you define the classes.
Router1(config)#ip access-list extended SSH
Router1(config-ext-nacl)#permit tcp any any eq 22
Router1(config-ext-nacl)#class-map SSH
! You could also match on protocol instead of by an access list, but the access list is less procesor intensive.
Router1(config-cmap)#match access-group name SSH
Router1(config-cmap)#ip access-list extended EIGRP
Router1(config-ext-nacl)#permit eigrp any any
Router1(config-ext-nacl)#class-map EIGRP
Router1(config-cmap)#match access-group name EIGRP
Router1(config-cmap)#exit
Router1(config)#class-map Rubbish
Router1(config-cmap)#match not access-group name SSH
Router1(config-cmap)#match not access-group name EIGRP
Next, you set the policy.
Router1(config-cmap)#policy-map COPP
Router1(config-pmap)#class SSH
Router1(config-pmap-c)#police 16000
Router1(config-pmap-c-police)#class EIGRP
Router1(config-pmap-c)#police 8000
Router1(config-pmap)#class Rubbish
Router1(config-pmap-c)#drop
Finally, you bind the policy to the control plane.
Router1(config-pmap-c)#control-plane
Router1(config-cp)#service-policy output COPP
Now, let’s verify from Router2. You can see that ping doesn’t work, but EIGRP is still up.
Router2#ping 192.168.12.1
Type escape sequence to abort.
Sending 5, 100-byte ICMP Echos to 192.168.12.1, timeout is 2 seconds:
.....
Success rate is 0 percent (0/5)

Router2#show ip eigrp neighbors
EIGRP-IPv4 VR(Apress) Address-Family Neighbors for AS(100)
H   Address                 Interface              Hold Uptime   SRTT   RTO  Q  Seq
                                                   (sec)         (ms)       Cnt Num
0   192.168.12.1            Et0/0                    13 00:16:08    9   100  0  18
Router2#
Summary
This chapter revisited the management plane, with an emphasis on tools and best practices. The purpose was to introduce you to a selection of tools that are either freely available or have a robust free demonstrations version. Some best practices for securing and limiting the management and control planes were also covered.