
Chapter 3
Combinatorial Optimization
It is humbling to learn that there are entire classes of optimization problems for which most methods—including those described previously—are utterly useless.
We will pose these problems as maximizations except in Section 3.3, although in nonstatistical contexts minimization is often customary. For statistical applications, recall that maximizing the log likelihood is equivalent to minimizing the negative log likelihood.
Let us assume that we are seeking the maximum of f(θ) with respect to θ = (θ1, . . ., θp), where θ ![]() Θ and Θ consists of N elements for a finite positive integer N. In statistical applications, it is not uncommon for a likelihood function to depend on configuration parameters that describe the form of a statistical model and for which there are many discrete choices, as well as a small number of other parameters that could be easily optimized if the best configuration were known. In such cases, we may view f(θ) as the log profile likelihood of a configuration, θ, that is, the highest likelihood attainable using that configuration. Section 3.1.1 provides several examples.
Θ and Θ consists of N elements for a finite positive integer N. In statistical applications, it is not uncommon for a likelihood function to depend on configuration parameters that describe the form of a statistical model and for which there are many discrete choices, as well as a small number of other parameters that could be easily optimized if the best configuration were known. In such cases, we may view f(θ) as the log profile likelihood of a configuration, θ, that is, the highest likelihood attainable using that configuration. Section 3.1.1 provides several examples.
Each θ ![]() Θ is termed a candidate solution. Let fmax denote the globally maximum value of f(θ) achievable for θ
Θ is termed a candidate solution. Let fmax denote the globally maximum value of f(θ) achievable for θ ![]() Θ, and let the set of global maxima be
Θ, and let the set of global maxima be ![]() . If there are ties, M will contain more than one element. Despite the finiteness of Θ, finding an element of M may be very hard if there are distracting local maxima, plateaus, and long paths toward optima in Θ, and if N is extremely large.
. If there are ties, M will contain more than one element. Despite the finiteness of Θ, finding an element of M may be very hard if there are distracting local maxima, plateaus, and long paths toward optima in Θ, and if N is extremely large.
3.1 Hard Problems and NP-Completeness
Hard optimization problems are generally combinatorial in nature. In such problems, p items may be combined or sequenced in a very large number of ways, and each choice corresponds to one element in the space of possible solutions. Maximization requires a search of this very large space.
For example, consider the traveling salesman problem. In this problem, the salesman must visit each of p cities exactly once and return to his point of origin, using the shortest total travel distance. We seek to minimize the total travel distance over all possible routes (i.e., maximize the negative distance). If the distance between two cities does not depend on the direction traveled between them, then there are (p − 1) !/2 possible routes (since the point of origin and direction of travel are arbitrary). Note that any tour corresponds to a permutation of the integers 1, . . ., p, which specifies the sequence in which the cities are visited.
To consider the difficulty of such problems, it is useful to discuss the number of steps required for an algorithm to solve it, where steps are simple operations like arithmetic, comparisons, and branching. The number of operations depends, of course, on the size of the problem posed. In general the size of a problem may be specified as the number of inputs needed to pose it. The traveling salesman problem is posed by specifying p city locations to be sequenced. The difficulty of a particular size-p problem is characterized by the number of operations required to solve it in the worst case using the best known algorithm.
The number of operations is only a rough notion, because it varies with implementation language and strategy. It is conventional, however, to bound the number of operations using the notation ![]() . If h(p) is polynomial in p, an algorithm is said to be polynomial.
. If h(p) is polynomial in p, an algorithm is said to be polynomial.
Although the actual running time on a computer depends on the speed of the computer, we generally equate the number of operations and the execution time by relying on the simplifying assumption that all basic operations take the same amount of time (one unit). Then we may make meaningful comparisons of algorithm speeds even though the absolute scale is meaningless.
Consider two problems of size p = 20. Suppose that the first problem can be solved in polynomial time [say ![]() operations], and the solution requires 1 minute on your office computer. Then the size-21 problem could be solved in just a few seconds more. The size-25 problem can be solved in 1.57 minutes, size 30 in 2.25 minutes, and size 50 in 6.25 minutes. Suppose the second problem is
operations], and the solution requires 1 minute on your office computer. Then the size-21 problem could be solved in just a few seconds more. The size-25 problem can be solved in 1.57 minutes, size 30 in 2.25 minutes, and size 50 in 6.25 minutes. Suppose the second problem is ![]() and requires 1 minute for size 20. Then it would take 21 minutes for size 21, 12.1 years (6,375,600 minutes) for size 25, 207 million years for size 30, and 2.4 × 1040 years for size 50. Similarly, if an
and requires 1 minute for size 20. Then it would take 21 minutes for size 21, 12.1 years (6,375,600 minutes) for size 25, 207 million years for size 30, and 2.4 × 1040 years for size 50. Similarly, if an ![]() traveling salesman problem of size 20 could be solved in 1 minute, it would require far longer than the lifetime of the universe to determine the optimal path for the traveling salesman to make a tour of the 50 U.S. state capitals. Furthermore, obtaining a computer that is 1000 times faster would barely reduce the difficulty. The conclusion is stark: Some optimization problems are simply too hard. The complexity of a polynomial problem—even for large p and high polynomial order—is dwarfed by the complexity of a quite small nonpolynomial problem.
traveling salesman problem of size 20 could be solved in 1 minute, it would require far longer than the lifetime of the universe to determine the optimal path for the traveling salesman to make a tour of the 50 U.S. state capitals. Furthermore, obtaining a computer that is 1000 times faster would barely reduce the difficulty. The conclusion is stark: Some optimization problems are simply too hard. The complexity of a polynomial problem—even for large p and high polynomial order—is dwarfed by the complexity of a quite small nonpolynomial problem.
The theory of problem complexity is discussed in [214, 497]. For us to discuss this issue further, we must make a formal distinction between optimization (i.e., search) problems and decision (i.e., recognition) problems. Thus far, we have considered optimization problems of the form: “Find the value of θ ![]() Θ that maximizes f(θ).” The decision counterpart to this is: “Is there a θ
Θ that maximizes f(θ).” The decision counterpart to this is: “Is there a θ ![]() Θ for which f(θ) > c, for a fixed number c?” Clearly there is a close relationship between these two versions of the problem. In principle, we could solve the optimization problem by repeatedly solving the decision problem for strategically chosen values of c.
Θ for which f(θ) > c, for a fixed number c?” Clearly there is a close relationship between these two versions of the problem. In principle, we could solve the optimization problem by repeatedly solving the decision problem for strategically chosen values of c.
Decision problems that can be solved in polynomial time [e.g., ![]() operations for p inputs and constant k] are generally considered to be efficiently solvable [214]. These problems belong to the class denoted P. Once any polynomial–time algorithm has been identified for a problem, the order of the polynomial is often quickly reduced to practical levels [497]. Decision problems for which a given solution can be checked in polynomial time are called NP problems. Clearly a problem in P is in NP. However, there seem to be many decision problems, like the traveling salesman problem, that are much easier to check than they are to solve. In fact, there are many NP problems for which no polynomial–time solution has ever been developed. Many NP problems have been proven to belong to a special class for which a polynomial algorithm found to solve one such problem could be used to solve all such problems. This is the class of NP-complete problems. There are other problems at least as difficult, for which a polynomial algorithm—if found—would be known to provide a solution to all NP-complete problems, even though the problem itself is not proven to be NP-complete. These are NP-hard problems. There are also many combinatorial decision problems that are difficult and probably NP-complete or NP-hard although they haven't been proven to be in these classes. Finally, optimization problems are no easier than their decision counterparts, and we may classify optimization problems using the same categories listed above.
operations for p inputs and constant k] are generally considered to be efficiently solvable [214]. These problems belong to the class denoted P. Once any polynomial–time algorithm has been identified for a problem, the order of the polynomial is often quickly reduced to practical levels [497]. Decision problems for which a given solution can be checked in polynomial time are called NP problems. Clearly a problem in P is in NP. However, there seem to be many decision problems, like the traveling salesman problem, that are much easier to check than they are to solve. In fact, there are many NP problems for which no polynomial–time solution has ever been developed. Many NP problems have been proven to belong to a special class for which a polynomial algorithm found to solve one such problem could be used to solve all such problems. This is the class of NP-complete problems. There are other problems at least as difficult, for which a polynomial algorithm—if found—would be known to provide a solution to all NP-complete problems, even though the problem itself is not proven to be NP-complete. These are NP-hard problems. There are also many combinatorial decision problems that are difficult and probably NP-complete or NP-hard although they haven't been proven to be in these classes. Finally, optimization problems are no easier than their decision counterparts, and we may classify optimization problems using the same categories listed above.
It has been shown that if there is a polynomial algorithm for any NP-complete problem, then there are polynomial algorithms for all NP-complete problems. The utter failure of scientists to develop a polynomial algorithm for any NP-complete problem motivates the popular conjecture that there cannot be any polynomial algorithm for any NP-complete problem. Proof (or counterexample) of this conjecture is one of the great unsolved problems in mathematics.
This leads us to the realization that there are optimization problems that are inherently too difficult to solve exactly by traditional means. Many problems in bioinformatics, experimental design, and nonparametric statistical modeling, for example, require combinatorial optimization.
3.1.1 Examples
Statisticians have been slow to realize how frequently combinatorial optimization problems are encountered in mainstream statistical model-fitting efforts. Below we give two examples. In general, when fitting a model requires optimal decisions about the inclusion, exclusion, or arrangement of a number of parameters in a set of possible parameters, combinatorial optimization problems arise frequently.
Example 3.1 (Genetic Mapping) Genetic data for individuals and groups of related individuals are often analyzed in ways that present highly complex combinatorial optimization problems. For example, consider the problem of locating genes on a chromosome, known as the genetic mapping problem.
The genes, or more generally genetic markers, of interest in a chromosome can be represented as a sequence of symbols. The position of each symbol along the chromosome is called its locus. The symbols indicate genes or genetic markers, and the particular content stored at a locus is an allele.
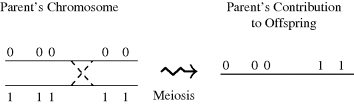
Diploid species like humans have pairs of chromosomes and hence two alleles at any locus. An individual is homozygous at a locus if the two alleles are identical at this locus; otherwise the individual is heterozygous. In either case, each parent contributes one allele at each locus of an offspring's chromosome pair. There are two possible contributions from any parent, because the parent has two alleles at the corresponding locus in his/her chromosome pair. Although each parent allele has a 50% chance of being contributed to the offspring, the contributions from a particular parent are not made independently at random. Instead, the contribution by a parent consists of a chromosome built during meiosis from segments of each chromosome in the parent's pair of chromosomes. These segments will contain several loci. When the source of the alleles on the contributed chromosome changes from one chromosome of the parent's pair to the other one, a crossover is said to have occurred. Figure 3.1 illustrates a crossover occurring during meiosis, forming the chromosome contributed to the offspring by one parent. This method of contribution means that alleles whose loci are closer together on one of the parent's chromosomes are more likely to appear together on the chromosome contributed by that parent.
Figure 3.1 During meiosis, a crossover occurs between the third and fourth loci. The zeros and ones indicate the origin of each allele in the contributed chromosome. Only one parental contribution is shown, for simplicity.
When the alleles at two loci of a parent's chromosome appear jointly on the contributed chromosome more frequently than would be expected by chance alone, they are said to be linked. When the alleles at two different loci of a parent's chromosome do not both appear in the contributed chromosome, a recombination has occurred between the loci. The frequency of recombinations determines the degree of linkage between two loci: Infrequent recombination corresponds to strong linkage. The degree of linkage, or map distance, between two loci corresponds to the expected number of crossovers between the two loci.
A genetic map of p markers consists of an ordering of their loci and a list of distances or probabilities of recombination between adjacent loci. Assign to each locus a label, ![]() , for
, for ![]() = 1, . . ., p. The ordering component of the map, denoted θ = (θ1, . . ., θp), describes the arrangement of the p locus labels in order of their positions along the chromosome, with θj =
= 1, . . ., p. The ordering component of the map, denoted θ = (θ1, . . ., θp), describes the arrangement of the p locus labels in order of their positions along the chromosome, with θj =![]() if the locus labeled
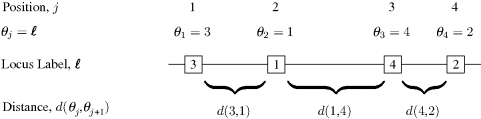
if the locus labeled ![]() lies at the jth position along the chromosome. Thus, θ is a permutation of the integers 1, . . ., p. The other component of a genetic map is a list of distances between adjacent loci. Denote the probability of recombination between adjacent loci θj and θj+1 as d(θj, θj+1). This amounts to the map distance between these loci. Figure 3.2 illustrates this notation.
lies at the jth position along the chromosome. Thus, θ is a permutation of the integers 1, . . ., p. The other component of a genetic map is a list of distances between adjacent loci. Denote the probability of recombination between adjacent loci θj and θj+1 as d(θj, θj+1). This amounts to the map distance between these loci. Figure 3.2 illustrates this notation.
Figure 3.2 Notation for gene mapping example with p = 4 loci. The loci are labeled in boxes at their positions along the chromosome. The correct sequential ordering of loci is defined by the θj values. Distances between loci are given by d(θj, θj+1) for j = 1, . . ., 3.
Such a map can be estimated by observing the alleles at the p loci for a sample of n chromosomes generated during the meiosis from a parent that is heterozygous at all p loci. Each such chromosome can be represented by a sequence of zeros and ones, indicating the origin of each allele in the contributed parent. For example, the chromosome depicted on the right side of Figure 3.1 can be denoted 00011, because the first three alleles originate from the first chromosome of the parent and the final two alleles originate from the second chromosome of the parent.
Let the random variable ![]() denote the origin of the allele in the locus labeled θj for the ith chromosome generated during meiosis. The dataset consists of observations,
denote the origin of the allele in the locus labeled θj for the ith chromosome generated during meiosis. The dataset consists of observations, ![]() , of these random variables. Thus, a recombination for two adjacent markers has been observed in the ith case if
, of these random variables. Thus, a recombination for two adjacent markers has been observed in the ith case if ![]() , and no recombination has been observed if
, and no recombination has been observed if ![]() . If recombination events are assumed to occur independently in each interval, the probability of a given map is
. If recombination events are assumed to occur independently in each interval, the probability of a given map is
(3.1) 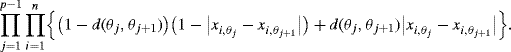
Given an ordering θ, the MLEs for the recombination probabilities are easily found to be
(3.2) ![]()
Given d(θj, θj+1), the number of recombinations between the loci in positions j and j + 1 is ![]() , which has a Bin(n, d(θj, θj+1)) distribution. We can compute the profile likelihood for θ by adding the log likelihoods of the p − 1 sets of adjacent loci and replacing each d(θj, θj+1) by its conditional maximum likelihood estimate
, which has a Bin(n, d(θj, θj+1)) distribution. We can compute the profile likelihood for θ by adding the log likelihoods of the p − 1 sets of adjacent loci and replacing each d(θj, θj+1) by its conditional maximum likelihood estimate ![]() . Let
. Let ![]() compute these maximum likelihood estimates for any θ. Then the profile likelihood for θ is
compute these maximum likelihood estimates for any θ. Then the profile likelihood for θ is
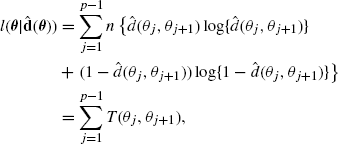
where T(θj, θj+1) is defined to be zero if ![]() is zero or one. Then the maximum likelihood genetic map is obtained by maximizing (3.3) over all permutations θ. Note that (3.3) constitutes a sum of terms T(θj, θj+1) whose values depend on only two loci. Suppose that all possible pairs of loci are enumerated, and the value T(i, j) is computed for every i and j where 1 ≤ i < j ≤ p. There are p(p − 1)/2 such values of T(i, j). The profile log likelihood can then be computed rapidly for any permutation θ by summing the necessary values of T(i, j).
is zero or one. Then the maximum likelihood genetic map is obtained by maximizing (3.3) over all permutations θ. Note that (3.3) constitutes a sum of terms T(θj, θj+1) whose values depend on only two loci. Suppose that all possible pairs of loci are enumerated, and the value T(i, j) is computed for every i and j where 1 ≤ i < j ≤ p. There are p(p − 1)/2 such values of T(i, j). The profile log likelihood can then be computed rapidly for any permutation θ by summing the necessary values of T(i, j).
However, finding the maximum likelihood genetic map requires maximizing the profile likelihood by searching over all p !/2 possible permutations. This is a variant of the traveling salesman problem, where each genetic marker corresponds to a city and the distance between cities i and j is T(i, j). The salesman's tour may start at any city and terminates in the last city visited. A tour and its reverse are equivalent. There are no known algorithms for solving general traveling salesman problems in polynomial time.
Further details and extensions of this example are considered in [215, 572]. ![]()
Example 3.2 (Variable Selection in Regression) Consider a multiple linear regression problem with p potential predictor variables. A fundamental step in regression is selection of a suitable model. Given a dependent variable Y and a set of candidate predictors x1, x2, . . ., xp, we must find the best model of the form ![]() , where {i1, . . ., is} is a subset of {1, . . ., p} and
, where {i1, . . ., is} is a subset of {1, . . ., p} and ![]() denotes a random error. The notion of what model is best may have any of several meanings.
denotes a random error. The notion of what model is best may have any of several meanings.
Suppose that the goal is to use the Akaike information criterion (AIC) to select the best model [7, 86]. We seek to find the subset of predictors that minimizes the fitted model AIC,
(3.4) ![]()
where N is the sample size, s is the number of predictors in the model, and RSS is the sum of squared residuals. Alternatively, suppose that Bayesian regression is performed, say with the normal-gamma conjugate class of priors β ~ N(μ, σ2V) and ![]() . In this case, one might seek to find the subset of predictors corresponding to the model that maximizes the posterior model probability [527].
. In this case, one might seek to find the subset of predictors corresponding to the model that maximizes the posterior model probability [527].
In either case, the variable selection problem requires an optimization over a space of 2p+1 possible models, since each variable and the intercept may be included or omitted. It also requires estimating the best ![]() for each of the 2p+1 possible models, but this step is easy for any given model. Although a search algorithm that is more efficient than exhaustive search has been developed to optimize some classical regression model selection criteria, it is practical only for fairly small p [213, 465]. We know of no efficient general algorithm to find the global optimum (i.e., the single best model) for either the AIC or the Bayesian goals.
for each of the 2p+1 possible models, but this step is easy for any given model. Although a search algorithm that is more efficient than exhaustive search has been developed to optimize some classical regression model selection criteria, it is practical only for fairly small p [213, 465]. We know of no efficient general algorithm to find the global optimum (i.e., the single best model) for either the AIC or the Bayesian goals. ![]()
3.1.2 Need for Heuristics
The existence of such challenging problems requires a new perspective on optimization. It is necessary to abandon algorithms that are guaranteed to find the global maximum (under suitable conditions) but will never succeed within a practical time limit. Instead we turn to algorithms that can find a good local maximum within tolerable time.
Such algorithms are sometimes called heuristics. They are intended to find a globally competitive candidate solution (i.e., a nearly optimal one), with an explicit trade of global optimality for speed. The two primary features of such heuristics are
These two characteristics embody the heuristic strategy of local search, which we address first.
No single heuristic will work well in all problems. In fact, there is no search algorithm whose performance is better than another when performance is averaged over the set of all possible discrete functions [576, 672]. There is clearly a motivation to adopt different heuristics for different problems. Thus we continue beyond local search to examine simulated annealing, genetic algorithms, and tabu algorithms.
3.2 Local Search
Local search is a very broad optimization paradigm that arguably encompasses all of the techniques described in this chapter. In this section, we introduce some of the its simplest, most generic variations such as k-optimization and random starts local search.
Basic local search is an iterative procedure that updates a current candidate solution θ(t) at iteration t to θ(t+1). The update is termed a move or a step. One or more possible moves are identified from a neighborhood of θ(t), say ![]() . The advantage of local search over global (i.e., exhaustive) search is that only a tiny portion of Θ need be searched at any iteration, and large portions of Θ may never be examined. The disadvantage is that the search is likely to terminate at an uncompetitive local maximum.
. The advantage of local search over global (i.e., exhaustive) search is that only a tiny portion of Θ need be searched at any iteration, and large portions of Θ may never be examined. The disadvantage is that the search is likely to terminate at an uncompetitive local maximum.
A neighborhood of the current candidate solution, ![]() , contains candidate solutions that are near θ(t). Often, proximity is enforced by limiting the number of changes to the current candidate solution used to generate an alternative. In practice, simple changes to the current candidate solution are usually best, resulting in small neighborhoods that are easily searched or sampled. Complex alterations are often difficult to conceptualize, complicated to code, and slow to execute. Moreover, they rarely improve search performance, despite the intuition that larger neighborhoods would be less likely to lead to entrapment at a poor local maximum. If the neighborhood is defined by allowing as many as k changes to the current candidate solution in order to produce the next candidate, then it is a k-neighborhood, and the alteration of those features is called a k-change.
, contains candidate solutions that are near θ(t). Often, proximity is enforced by limiting the number of changes to the current candidate solution used to generate an alternative. In practice, simple changes to the current candidate solution are usually best, resulting in small neighborhoods that are easily searched or sampled. Complex alterations are often difficult to conceptualize, complicated to code, and slow to execute. Moreover, they rarely improve search performance, despite the intuition that larger neighborhoods would be less likely to lead to entrapment at a poor local maximum. If the neighborhood is defined by allowing as many as k changes to the current candidate solution in order to produce the next candidate, then it is a k-neighborhood, and the alteration of those features is called a k-change.
The definition a neighborhood is intentionally vague to allow flexible usage of the term in a wide variety of problems. For the gene mapping problem introduced in Example 3.1, suppose θ(t) is a current ordering of genetic markers. A simple neighborhood might be the set of all orderings that can be obtained by swapping the locations of only two markers on the chromosome whose order is θ(t). In the regression model selection problem introduced in Example 3.2, a simple neighborhood is the set of models that either add or omit one predictor from θ(t).
A local neighborhood will usually contain several candidate solutions. An obvious strategy at each iteration is to choose the best among all candidates in the current neighborhood. This is the method of steepest ascent. To speed performance, one might instead select the first randomly chosen neighbor for which the objective function exceeds its previous value; this is random ascent or next ascent.
If k-neighborhoods are used for a steepest ascent algorithm, the solution is said to be k-optimal. Alternatively, any local search algorithm that chooses θ(t+1) uphill from θ(t) is an ascent algorithm, even if the ascent is not the steepest possible within ![]() .
.
The sequential selection of steps that are optimal in small neighborhoods, disregarding the global problem, is reminiscent of a greedy algorithm. A chess player using a greedy algorithm might look for the best immediate move with total disregard to its future consequences: perhaps moving a knight to capture a pawn without recognizing that the knight will be captured on the opponent's next move. Wise selection of a new candidate solution from a neighborhood of the current candidate must balance the need for a narrow focus enabling quick moves against the need to find a globally competitive solution. To avoid entrapment in poor local maxima, it might be reasonable—every once in a while—to eschew some of the best neighbors of θ(t) in favor of a direction whose rewards are only later realized. For example, when θ(t) is a local maximum, the approach of steepest ascent/mildest descent [306] allows a move to the least unfavorable ![]() (see Section 3.5). There are also a variety of techniques in which a candidate neighbor is selected from
(see Section 3.5). There are also a variety of techniques in which a candidate neighbor is selected from ![]() and a random decision rule is used to decide whether to adopt it or retain θ(t). These algorithms generate Markov chains {θ(t)} (t = 0, 1, . . .) that are closely related to simulated annealing (Section 3.3) and the methods of Chapter 7.
and a random decision rule is used to decide whether to adopt it or retain θ(t). These algorithms generate Markov chains {θ(t)} (t = 0, 1, . . .) that are closely related to simulated annealing (Section 3.3) and the methods of Chapter 7.
Searching within the current neighborhood for a k-change steepest ascent move can be difficult when k is greater than 1 or 2 because the size of the neighborhood increases rapidly with k. For larger k, it can be useful to break the k-change up into smaller parts, sequentially selecting the best candidate solutions in smaller neighborhoods. To promote search diversity, breaking a k-change step into several smaller sequential changes can be coupled with the strategy of allowing one or more of the smaller steps to be suboptimal (e.g., random). Such variable-depth local search approaches permit a potentially better step away from the current candidate solution, even though it will not likely be optimal within the k-neighborhood.
Ascent algorithms frequently converge to local maxima that are not globally competitive. One approach to overcoming this problem is the technique of random starts local search. Here, a simple ascent algorithm is repeatedly run to termination from a large number of starting points. The starting points are chosen randomly. The simplest approach is to select starting points independently and uniformly at random over Θ. More sophisticated approaches may employ some type of stratified sampling where the strata are identified from some pilot runs in an effort to partition Θ into regions of qualitatively different convergence behavior.
It may seem unsatisfying to rely solely on random starts to avoid being fooled by a local maximum. In later sections we introduce methods that modify local search in ways that provide a reasonable chance of finding a globally competitive candidate solution—possibly the global maximum—on any single run. Of course, the strategy of using multiple random starts can be overlaid on any of these approaches to provide additional confidence in the best solution found. Indeed, we recommend that this is always done when feasible.
Example 3.3 (Baseball Salaries) Random starts local search can be very effective in practice because it is simple to code and fast to execute, allowing time for a large number of random starts. Here, we consider its application to a regression model selection problem.
Table 3.1 lists 27 baseball performance statistics, such as batting percentages and numbers of home runs, which were collected for 337 players (no pitchers) in 1991. Players' 1992 salaries, in thousands of dollars, may be related to these variables computed from the previous season. These data, derived from the data in [654], may be downloaded from the website for this book. We use the log of the salary variable as the response variable. The goal is to find the best subset of predictors to predict log salary using a linear regression model. Assuming that the intercept will be included in any model, there are 227 = 134,217,728 possible models in the search space.
Table 3.1 Potential predictors of baseball players' salaries.
| 1. Batting average | 10. Strikeouts (SOs) | 19. Walks per SO |
| 2. On base pct. (OBP) | 11. Stolen bases (SBs) | 20. OBP / errors |
| 3. Runs scored | 12. Errors | 21. Runs per error |
| 4. Hits | 13. Free agencya | 22. Hits per error |
| 5. Doubles | 14. Arbitrationb | 23. HRs per error |
| 6. Triples | 15. Runs per SO | 24. SOs × errors |
| 7. Home runs (HRs) | 16. Hits per SO | 25. SBs × OBP |
| 8. Runs batted in (RBIs) | 17. HRs per SO | 26. SBs × runs |
| 9. Walks | 18. RBIs per SO | 27. SBs × hits |
| a. Free agent, or eligible. | ||
| b. Arbitration, or eligible. | ||
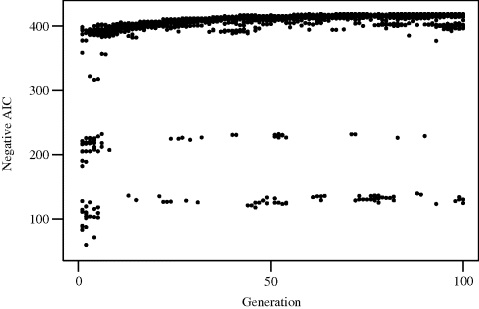
Figure 3.3 illustrates the application of a random starts local search algorithm to minimize the AIC with respect to regression variable selection. The problem can be posed as maximizing the negative of the AIC, thus preserving our preference for uphill search. Neighborhoods were limited to 1-changes generated from the current model by either adding or deleting one predictor. Search was started from 5 randomly selected subsets of predictors (i.e., five starting points), and 14 additional steps were allocated to each start. Each move was made by steepest ascent. Since each steepest ascent step requires searching 27 neighbors, this small example requires 1890 evaluations of the objective function. A comparable limit to objective function evaluations was imposed on examples of other heuristic techniques that follow in the remainder of this chapter.
Figure 3.3 Results of random starts local search by steepest ascent for Example 3.3, for 15 iterations from each of five random starts. Only AIC values between −360 and −420 are shown.
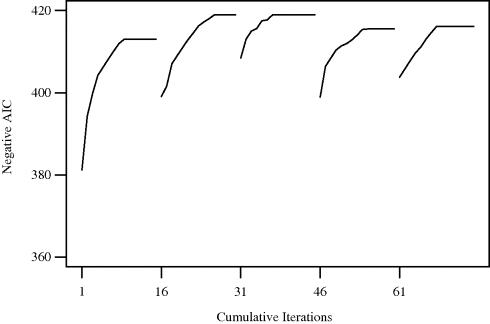
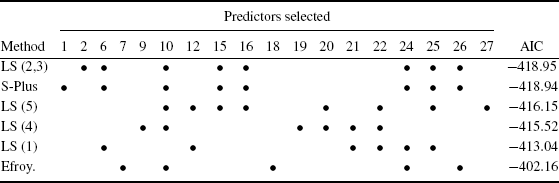
Figure 3.3 shows the value of the AIC for the best model at each step. Table 3.2 summarizes the results of the search. The second and third random starts (labeled LS (2,3)) led to an optimal AIC of −418.95, derived from the model using predictors 2, 3, 6, 8, 10, 13, 14, 15, 16, 24, 25, and 26. The worst random start was the first, which led to an AIC of −413.04 for a model with 10 predictors. For the sake of comparison, a greedy stepwise method (the step() procedure in S-Plus [642]) chose a model with 12 predictors, yielding an AIC of −418.94. The greedy stepwise method of Efroymson [465] chose a model with 9 predictors, yielding an AIC of −402.16; however, this method is designed to find a good parsimonious model using a criterion that differs slightly from the AIC. With default settings, neither of these off-the-shelf algorithms found a model quite as good as the one found with a simple random starts local search. ![]()
Table 3.2 Results of random starts local search model selection for Example 3.3. The bullets indicate inclusion of the corresponding predictor in each model selected, with model labels explained in the text. In addition, all models in this table included predictors 3, 8, 13 and 14.
3.3 Simulated Annealing
Simulated annealing is a popular technique for combinatorial optimization because it is generic and easily implemented in its simplest form. Also, its limiting behavior is well studied. On the other hand, this limiting behavior is not easily realized in practice, the speed of convergence can be maddeningly slow, and complex esoteric tinkering may be needed to substantially improve the performance. Useful reviews of simulated annealing include [75, 641].
Annealing is the process of heating up a solid and then cooling it slowly. When a stressed solid is heated, its internal energy increases and its molecules move randomly. If the solid is then cooled slowly, the thermal energy generally decreases slowly, but there are also random increases governed by Boltzmann's probability. Namely, at temperature τ, the probability density of an increase in energy of magnitude ΔE is exp { − ΔE/kτ} where k is Boltzmann's constant. If the cooling is slow enough and deep enough, the final state is unstressed, where all the molecules are arranged to have minimal potential energy.
For consistency with the motivating physical process, we pose optimization as minimization in this section, so the minimum of f(θ) is sought over θ ![]() Θ. Then it is possible to draw an analogy between the physical cooling process and the process of solving a combinatorial minimization problem [130, 378]. For simulated annealing algorithms, θ corresponds to the state of the material, f(θ) corresponds to its energy level, and the optimal solution corresponds to the θ that has minimum energy. Random changes to the current state (i.e., moves from θ(t) to θ(t+1)) are governed by the Boltzmann distribution given above, which depends on a parameter called temperature. When the temperature is high, acceptance of uphill moves (i.e., moves to a higher energy state) are more likely to be tolerated. This discourages convergence to the first local minimum that happens to be found, which might be premature if the space of candidate solutions has not yet been adequately explored. As search continues, the temperature is lowered. This forces increasingly concentrated search effort near the current local minimum, because few uphill moves will be allowed. If the cooling schedule is determined appropriately, the algorithm will hopefully converge to the global minimum.
Θ. Then it is possible to draw an analogy between the physical cooling process and the process of solving a combinatorial minimization problem [130, 378]. For simulated annealing algorithms, θ corresponds to the state of the material, f(θ) corresponds to its energy level, and the optimal solution corresponds to the θ that has minimum energy. Random changes to the current state (i.e., moves from θ(t) to θ(t+1)) are governed by the Boltzmann distribution given above, which depends on a parameter called temperature. When the temperature is high, acceptance of uphill moves (i.e., moves to a higher energy state) are more likely to be tolerated. This discourages convergence to the first local minimum that happens to be found, which might be premature if the space of candidate solutions has not yet been adequately explored. As search continues, the temperature is lowered. This forces increasingly concentrated search effort near the current local minimum, because few uphill moves will be allowed. If the cooling schedule is determined appropriately, the algorithm will hopefully converge to the global minimum.
The simulated annealing algorithm is an iterative procedure started at time t = 0 with an initial point θ(0) and a temperature τ0. Iterations are indexed by t. The algorithm is run in stages, which we index by j = 0, 1, 2, . . ., and each stage consists of several iterations. The length of the jth stage is mj. Each iteration proceeds as follows:
If the algorithm is not stopped according to a limit on the total number of iterations or a predetermined schedule of τj and mj, one can monitor an absolute or relative convergence criterion (see Chapter 2). Often, however, the stopping rule is expressed as a minimum temperature. After stopping, the best candidate solution found is the estimated minimum.
The function α should slowly decrease the temperature to zero. The number of iterations at each temperature (mj) should be large and increasing in j. Ideally, the function β should scale the mj exponentially in p, but in practice some compromises will be required in order to obtain tolerable computing speed.
Although the new candidate solution is always adopted when it is superior to the current solution, note that it has some probability of being adopted even when it is inferior. In this sense, simulated annealing is a stochastic descent algorithm. Its randomness allows simulated annealing sometimes to escape uncompetitive local minima.
3.3.1 Practical Issues
3.3.1.1 Neighborhoods and Proposals
Strategies for choosing neighborhoods can be very problem specific, but the best neighborhoods are usually small and easily computed.
Consider the traveling salesman problem. Numbering the cities 1, 2, . . ., p, any tour θ can be written as a permutation of these integers. The cities are linked in this order, with an additional link between the final city visited and the original city where the tour began. A neighbor of θ can be generated by removing two nonadjacent links and reconnecting the tour. In this case, there is only one way to obtain a valid tour through reconnection: One of the tour segments must be reversed. For example, the tour 143256 is a neighbor of the tour 123456. Since two links are altered, the process of generating such neighbors is a 2-change, and it yields a 2-neighborhood. Any tour has p(p − 3)/2 unique 2-change neighbors distinct from θ itself. This neighborhood is considerably smaller than the (p − 1) !/2 tours in the complete solution space.
It is critical that the chosen neighborhood structure allows all solutions in Θ to communicate. For θi and θj to communicate, it must be possible to find a finite sequence of solutions θ1, . . ., θk such that ![]() ,
, ![]() , . . .,
, . . ., ![]() , and
, and ![]() . The 2-neighborhoods mentioned above for the traveling salesman problem allow communication between any θi and θj.
. The 2-neighborhoods mentioned above for the traveling salesman problem allow communication between any θi and θj.
The most common proposal density, ![]() , is discrete uniform—a candidate is sampled completely at random from
, is discrete uniform—a candidate is sampled completely at random from ![]() . This has the advantage of speed and simplicity. Other, more strategic methods have also been suggested [281, 282, 659].
. This has the advantage of speed and simplicity. Other, more strategic methods have also been suggested [281, 282, 659].
Rapid updating of the objective function is an important strategy for speeding simulated annealing runs. In the traveling salesman problem, sampling a 2-neighbor at random amounts to selecting two integers from which is derived a permutation of the current tour. Note also for the traveling salesman problem that f(θ∗) can be efficiently calculated for any θ∗ in the 2-neighborhood of θ(t) when f(θ(t)) has already been found. In this case, the new tour length equals the old tour length minus the distance for traveling the two broken links, plus the distance for traveling the two new links. The time to compute this does not depend on problem size p.
3.3.1.2 Cooling Schedule and Convergence
The sequence of stage lengths and temperatures is called the cooling schedule. Ideally, the cooling schedule should be slow.
The limiting behavior of simulated annealing follows from Markov chain theory, briefly reviewed in Chapter 1. Simulated annealing can be viewed as producing a sequence of homogeneous Markov chains (one at each temperature) or a single inhomogeneous Markov chain (with temperature decreasing between transitions). Although these views lead to different approaches to defining limiting behavior, both lead to the conclusion that the limiting distribution of draws has support only on the set of global minima.
To understand why cooling should lead to the desired convergence of the algorithm at a global minimum, first consider the temperature to be fixed at τ. Suppose further that proposing θi from ![]() has the same probability as proposing θj from
has the same probability as proposing θj from ![]() for any pair of solutions θi and θj in Θ. In this case, the sequence of θ(t) generated by simulated annealing is a Markov chain with stationary distribution πτ(θ) ∝ exp { − f(θ)/τ}. This means that lim t→∞P[θ(t) = θ] = πτ(θ). This approach to generating a sequence of random values is called the Metropolis algorithm and is discussed in Section 7.1.
for any pair of solutions θi and θj in Θ. In this case, the sequence of θ(t) generated by simulated annealing is a Markov chain with stationary distribution πτ(θ) ∝ exp { − f(θ)/τ}. This means that lim t→∞P[θ(t) = θ] = πτ(θ). This approach to generating a sequence of random values is called the Metropolis algorithm and is discussed in Section 7.1.
In principle, we would like to run the chain at this fixed temperature long enough that the Markov chain is approximately in its stationary distribution before the temperature is reduced.
Suppose there are M global minima and the set of these solutions is M. Denote the minimal value of f on Θ as fmin. Then the stationary distribution of the chain for a fixed τ is given by
(3.5) ![]()
for each θi ![]() Θ.
Θ.
Now, as τ → 0 from above, the limit of ![]() and 1 if
and 1 if ![]() . Thus
. Thus
(3.6) ![]()
The mathematics to make these arguments precise can be found in [67, 641].
It is also possible to relate the cooling schedule to a bound on the quality of the final solution. If one wishes any iterate to have not more than probability δ in equilibrium of being worse than the global minimum by no more than ![]() , this can be achieved if one cools until τj ≤
, this can be achieved if one cools until τj ≤ ![]() /log {(N − 1)/δ}, where N is the number of points in Θ [426]. In other words, this τj ensures that the final Markov chain configuration will in equilibrium have
/log {(N − 1)/δ}, where N is the number of points in Θ [426]. In other words, this τj ensures that the final Markov chain configuration will in equilibrium have ![]() .
.
If neighborhoods communicate and the depth of the deepest local (and nonglobal) minimum is c, then the cooling schedule given by τ = c/log {1 + i} guarantees asymptotic convergence, where i indexes iterations [292]. The depth of a local minimum is defined to be the smallest increase in the objective function needed to escape from that local minimum into the valley of any other minimum. However, mathematical bounds on the number of iterations required to achieve a high probability of having discovered at least one element of M often exceed the size of Θ itself. In this case, one cannot establish that simulated annealing will find the global minimum more quickly than an exhaustive search [33].
If one wishes the Markov chain generated by simulated annealing to be approximately in its stationary distribution at each temperature before reducing temperature, then the length of the run ideally should be at least quadratic in the size of the solution space [1], which itself is usually exponential in problem size. Clearly, much shorter stage lengths must be chosen if simulated annealing is to require fewer iterations than exhaustive search.
In practice, many cooling schedules have been tried [641]. Recall that the temperature at stage j is τj = α(τj−1) and the number of iterations in stage j is mj = β(mj−1). One popular approach is to set mj = 1 for all j and reduce the temperature very slowly according to α(τj−1) = τj−1/(1 + aτj−1) for a small value of a. A second option is to set α(τj−1) = aτj−1 for a < 1 (usually a ≥ 0.9). In this case, one might increase stage lengths as temperatures decrease. For example, consider β(mj−1) = bmj−1 for b > 1, or β(mj−1) = b + mj−1 for b > 0. A third schedule uses
![]()
where ![]() is the square of the mean objective function cost at the current temperature minus the mean squared cost at the current temperature, and r is some small real number [1]. Using the temperature schedule τ = c/log {1 + i} mentioned above based on theory is rarely practical because it is too slow and the determination of c is difficult, with excessively large guesses for c further slowing the algorithm.
is the square of the mean objective function cost at the current temperature minus the mean squared cost at the current temperature, and r is some small real number [1]. Using the temperature schedule τ = c/log {1 + i} mentioned above based on theory is rarely practical because it is too slow and the determination of c is difficult, with excessively large guesses for c further slowing the algorithm.
Most practitioners require lengthy experimentation to find suitable initial parameter values (e.g., τ0 and m0) and values of the proposed schedules (e.g., a, b, and r). While selection of the initial temperature τ0 is usually problem dependent, some general guidelines may be given. A useful strategy is to choose a positive τ0 value so that ![]() is close to 1 for any pair of solutions θi and θj in Θ. The rationale for this choice is that it provides any point in the parameter space with a reasonable chance of being visited in early iterations of the algorithm. Similarly, choosing mj to be large can produce a more accurate solution, but can result in long computing times. As a general rule of thumb, larger decreases in temperature require longer runs after the decrease. Finally, a good deal of evidence suggests that running simulated annealing long at high temperatures is not very useful. In many problems, the barriers between local minima are sufficiently modest that jumps between them are possible even at fairly low temperatures. Good cooling schedules therefore decrease the temperature rapidly at first.
is close to 1 for any pair of solutions θi and θj in Θ. The rationale for this choice is that it provides any point in the parameter space with a reasonable chance of being visited in early iterations of the algorithm. Similarly, choosing mj to be large can produce a more accurate solution, but can result in long computing times. As a general rule of thumb, larger decreases in temperature require longer runs after the decrease. Finally, a good deal of evidence suggests that running simulated annealing long at high temperatures is not very useful. In many problems, the barriers between local minima are sufficiently modest that jumps between them are possible even at fairly low temperatures. Good cooling schedules therefore decrease the temperature rapidly at first.
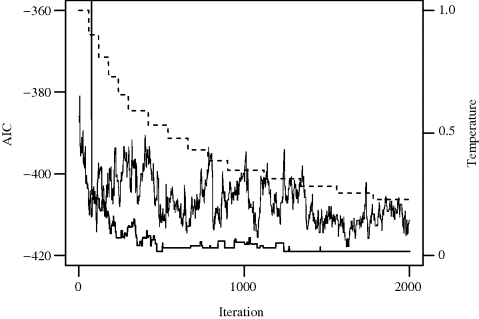
Example 3.4 (Baseball Salaries, Continued) To implement simulated annealing for variable selection via the AIC in the baseball salary regression problem introduced in Example 3.3, we must establish a neighborhood structure, a proposal distribution, and a temperature schedule. The simplest neighborhoods contain 1-change neighbors generated from the current model by either adding or deleting one predictor. We assigned equal probabilities to all candidates in a neighborhood. The cooling schedule had 15 stages, with stage lengths of 60 for the first 5 stages, 120 for the next 5, and 220 for the final 5. Temperatures were decreased according to α(τj−1) = 0.9τj−1 after each stage.
Figure 3.4 shows the values of the AIC for the sequence of candidate solutions generated by simulated annealing, for two different choices of τ0. The bottom curve corresponds to τ0 = 1. In this case, simulated annealing became stuck at particular candidate solutions for distinct periods because the low temperatures allowed little tolerance for uphill moves. In the particular realization shown, the algorithm quickly found good candidate solutions with low AIC values, where it became stuck frequently. However, in other cases (e.g., with a very multimodal objective function), such stickiness may result in the algorithm becoming trapped in a region far from the global minimum. A second run with τ0 = 6 (top solid line) yielded considerable mixing, with many uphill proposals accepted as moves. The temperature schedule for τ0 = 1 is shown by the dotted line and the right axis. Both runs exhibited greater mixing at higher temperatures. When τ0 = 1, the best model found was first identified in the 1274th step and dominated the simulation after that point. This model achieved an AIC of −418.95, and matched the best model found using random starts local search in Table 3.2. When τ0 = 6, the best model found had an AIC of −417.85. This run was clearly unsuccessful, requiring more iterations, cooler temperatures, or both. ![]()
Figure 3.4 Results of two simulated annealing minimizations of the regression model AIC for Example 3.4. The temperature for the bottom curve is shown by the dotted line and the right axis. Only AIC values between −360 and −420 are shown.
3.3.2 Enhancements
There are many variations on simulated annealing that purport to improve performance. Here we list a few ideas in an order roughly corresponding to the steps in the basic algorithm.
The simplest way to start simulated annealing is to start once, anywhere. A strategy employing multiple random starts would have the dual advantages of potentially finding a better candidate solution and allowing confirmation of convergence to the particular optimum found. Purely random starts could be replaced by a stratified set of starting points chosen by strategic preprocessing to be more likely to lead to minima than simple random starts. Such strategies must have high payoffs if they are to be useful, given simulated annealing's generally slow convergence. In some cases, the extra iterations dedicated to various random starts may be better spent on a single long run with longer stage sizes and a slower cooling schedule.
The solution space, Θ, may include constraints on θ. For example, in the genetic mapping problem introduced in Example 3.1, θ must be a permutation of the integers 1, . . ., p when there are p markers. When the process for generating neighbors creates solutions that violate these constraints, substantial time may be wasted fixing candidates or repeatedly sampling from ![]() until a valid candidate is found. An alternative is to relax the constraints and introduce a penalty into f that penalizes invalid solutions. In this manner, the algorithm can be discouraged from visiting invalid solutions without dedicating much time to enforcing constraints.
until a valid candidate is found. An alternative is to relax the constraints and introduce a penalty into f that penalizes invalid solutions. In this manner, the algorithm can be discouraged from visiting invalid solutions without dedicating much time to enforcing constraints.
In the basic algorithm, the neighborhood definition is static and the proposal distribution is the same at each iteration. Sometimes improvements can be obtained by adaptively restricting neighborhoods at each iteration. For example, it can be useful to shrink the size of the neighborhood as time increases to avoid many wasteful generations of distant candidates that are very likely to be rejected at such low temperatures. In other cases, when a penalty function is used in place of constraints, it may be useful to allow only neighborhoods composed of solutions that reduce or eliminate constraint violations embodied in the current θ.
It is handy if f can be evaluated quickly for new candidates. We noted previously that neighborhood definitions can sometimes enable this, as in the traveling salesman problem where a 2-neighborhood strategy led to a simple updating formula for f. Simple approximation of f is sometimes made, often in a problem-specific manner. At least one author suggests monitoring recent iterates and introducing a penalty term in f that discourages revisiting states like those recently visited [201].
Next consider the acceptance probability given in step 2 of the canonical simulated annealing algorithm in Section 3.3. The expression exp {[f(θ(t)) − f(θ∗)]/τj} is motivated by the Boltzmann distribution from statistical thermodynamics. Other acceptance probabilities can be used, however. The linear Taylor series expansion of the Boltzmann distribution motivates ![]() as a possible acceptance probability [352]. To encourage moderate moves away from local minima while preventing excessive small moves, the acceptance probability
as a possible acceptance probability [352]. To encourage moderate moves away from local minima while preventing excessive small moves, the acceptance probability ![]() , where c > 0, has been suggested for certain problems [169].
, where c > 0, has been suggested for certain problems [169].
In general, there is little evidence that the shape of the cooling schedule (linear, polynomial, exponential) matters much, as long as the useful range of temperatures is covered, the range is traversed at roughly the same rate, and sufficient time is spent at each temperature (especially the low temperatures) [169]. Reheating strategies that allow sporadic, systematic, or interactive temperature increases to prevent getting stuck in a local minimum at low temperatures can be effective [169, 256, 378].
After simulated annealing is complete, one might take the final result of one or more runs and polish these with a descent algorithm. In fact, one could refine occasional accepted steps in the same way, instead of waiting until simulated annealing has terminated.
3.4 Genetic Algorithms
Annealing is not the only natural process successfully exploited as a metaphor to solve optimization problems. Genetic algorithms mimic the process of Darwinian natural selection. Candidate solutions to a maximization problem are envisioned as biological organisms represented by their genetic code. The fitness of an organism is analogous to the quality of a candidate solution. Breeding among highly fit organisms provides the best opportunity to pass along desirable attributes to future generations, while breeding among less fit organisms (and rare genetic mutations) ensures population diversity. Over time, the organisms in the population should evolve to become increasingly fit, thereby providing a set of increasingly good candidate solutions to the optimization problem. The pioneering development of genetic algorithms was done by Holland [333]. Other useful references include [17, 138, 200, 262, 464, 531, 533, 661].
We revert now to our standard description of optimization as maximization, where we seek the maximum of f(θ) with respect to θ ![]() Θ. In statistical applications of genetic algorithms, f is often a joint log profile likelihood function.
Θ. In statistical applications of genetic algorithms, f is often a joint log profile likelihood function.
3.4.1 Definitions and the Canonical Algorithm
3.4.1.1 Basic Definitions
In Example 3.1 above, some genetics terminology was introduced. Here we discuss additional terminology needed to study genetic algorithms.
In a genetic algorithm, every candidate solution corresponds to an individual, or organism, and every organism is completely described by its genetic code. Individuals are assumed to have one chromosome. A chromosome is a sequence of C symbols, each of which consists of a single choice from a predetermined alphabet. The most basic alphabet is the binary alphabet, {0, 1}, in which case a chromosome of length C = 9 might look like 100110001. The C elements of the chromosome are the genes. The values that might be stored in a gene (i.e., the elements of the alphabet) are alleles. The position of a gene in the chromosome is its locus.
The information encoded in an individual's chromosome is its genotype. We will represent a chromosome or its genotype as ϑ. The expression of the genotype in the organism itself is its phenotype. For optimization problems, phenotypes are candidate solutions and genotypes are encodings: Each genotype, ϑ, encodes a phenotype, θ, using the chosen allele alphabet.
Genetic algorithms are iterative, with iterations indexed by t. Unlike the methods previously discussed in this chapter, genetic algorithms track more than one candidate solution simultaneously. Let the tth generation consist of a collection of P organisms, ![]() . This population of size P at generation t corresponds to a collection of candidate solutions,
. This population of size P at generation t corresponds to a collection of candidate solutions, ![]() .
.
Darwinian natural selection favors organisms with high fitness. The fitness of an organism ![]() depends on the corresponding
depends on the corresponding ![]() . A high-quality candidate solution has a high value of the objective function and a high fitness. As generations progress, organisms inherit from their parents bits of genetic code that are associated with high fitness if fit parents are predominantly selected for breeding. An offspring is a new organism inserted in the (t + 1)th generation to replace a member of the tth generation; the offspring's chromosome is determined from those of two parent chromosomes belonging to the tth generation.
. A high-quality candidate solution has a high value of the objective function and a high fitness. As generations progress, organisms inherit from their parents bits of genetic code that are associated with high fitness if fit parents are predominantly selected for breeding. An offspring is a new organism inserted in the (t + 1)th generation to replace a member of the tth generation; the offspring's chromosome is determined from those of two parent chromosomes belonging to the tth generation.
To illustrate some of these ideas, consider a regression model selection problem with 9 predictors. Assume that an intercept will be included in any model. The genotype of any model can then be written as a chromosome of length 9. For example, the chromosome ![]() 100110001 is a genotype corresponding the phenotype of a model containing only the fitted parameters for the intercept and predictors 1, 4, 5, and 9.
100110001 is a genotype corresponding the phenotype of a model containing only the fitted parameters for the intercept and predictors 1, 4, 5, and 9.
Another genotype is ![]() 110100110. Notice that
110100110. Notice that ![]() and
and ![]() share some common genes. A schema is any subcollection of genes. In this example, the two chromosomes share the schema 1* 01* * * * *, where * represents a wildcard: The allele in that locus is ignored. (These two chromosomes also share the schemata * * 01* * * * *, 1* 01* 0* * *, and others.) The significance of schemata is that they encode modest bits of genetic information that may be transferred as a unit from parent to offspring. If a schema is associated with a phenotypic feature that induces high values of the objective function, then the inheritance of this schema by individuals in future generations promotes optimization.
share some common genes. A schema is any subcollection of genes. In this example, the two chromosomes share the schema 1* 01* * * * *, where * represents a wildcard: The allele in that locus is ignored. (These two chromosomes also share the schemata * * 01* * * * *, 1* 01* 0* * *, and others.) The significance of schemata is that they encode modest bits of genetic information that may be transferred as a unit from parent to offspring. If a schema is associated with a phenotypic feature that induces high values of the objective function, then the inheritance of this schema by individuals in future generations promotes optimization.
3.4.1.2 Selection Mechanisms and Genetic Operators
Breeding drives most genetic change. The process by which parents are chosen to produce offspring is called the selection mechanism. One simple approach is to select one parent with probability proportional to fitness and to select the other parent completely at random. Another approach is to select each parent independently with probability proportional to fitness. Section 3.4.2.2 describes some of the most frequently used selection mechanisms.
After two parents from the tth generation have been selected for breeding, their chromosomes are combined in some way that allows schemata from each parent to be inherited by their offspring, who become members of generation t + 1. The methods for producing offspring chromosomes from chosen parent chromosomes are genetic operators.
A fundamental genetic operator is crossover. One of the simplest crossover methods is to select a random position between two adjacent loci and split both parent chromosomes at this position. Glue the left chromosome segment from one parent to the right segment from the other parent to form an offspring chromosome. The remaining segments can be combined to form a second offspring or discarded. For example, suppose the two parents are 100110001 and 110100110. If the random split point is between the third and fourth loci, then the potential offspring are 100100110 and 110110001. Note that in this example, both offspring inherit the schema 1* 01* * * * *. Crossover is the key to a genetic algorithm—it allows good features of two candidate solutions to be combined. Some more complicated crossover operators are discussed in Section 3.4.2.3.
Mutation is another important genetic operator. Mutation changes an offspring chromosome by randomly introducing one or more alleles in loci where those alleles are not seen in the corresponding loci of either parent chromosome. For example, if crossover produced 100100110 from the parents mentioned above, subsequent mutation might yield 101100110. Note that the third gene was 0 in both parents and therefore crossover alone was guaranteed to retain the schema * * 0* * * * * *. Mutation, however, provides a way to escape this constraint, thereby promoting search diversification and providing a way to escape from local maxima.
Mutation is usually applied after breeding. In the simplest implementation, each gene has an independent probability, μ, of mutating, and the new allele is chosen completely at random from the genetic alphabet. If μ is too low, many potentially good innovations will be missed; if μ is too high, the algorithm's ability to learn over time will be degraded, because excessive random variation will disturb the fitness selectivity of parents and the inheritance of desirable schemata.
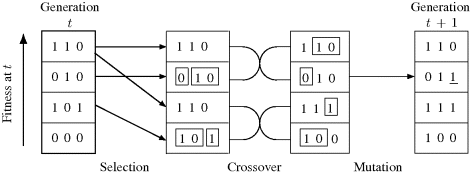
To summarize, genetic algorithms proceed by producing generations of individuals. The (t + 1)th generation is produced as follows. First the individuals in generation t are ranked and selected according to fitness. Then crossover and mutation are applied to these selected individuals to produce generation t + 1. Figure 3.5 is a small example of the production of a generation of four individuals with three chromosomes per individual and binary chromosome encoding. In generation t, individual 110 has the highest fitness among its generation and is chosen twice in the selection stage. In the crossover stage, the selected individuals are paired off so that each pair recombines to generate two new individuals. In the mutation stage, a low mutation rate is applied. In this example, only one mutation occurs. The completion of these steps yields the new generation.
Figure 3.5 An example of generation production in a genetic algorithm for a population of size P = 4 with chromosomes of length C = 3. Crossovers are illustrated by boxing portions of some chromosomes. Mutation is indicated by an underlined gene in the final column.
Example 3.5 (Baseball Salaries, Continued) The results of applying a simple genetic algorithm to the variable selection problem for the baseball data introduced in Example 3.3 are shown in Figure 3.6. One hundred generations of size P = 20 were used. Binary inclusion–exclusion alleles were used for each possible predictor, yielding chromosomes of length C = 27. The starting generation consisted of purely random individuals. A rank-based fitness function was used; see Equation (3.9). One parent was selected with probability proportional to this fitness; the other parent was selected independently, purely at random. Breeding employed simple crossover. A 1% mutation rate was randomly applied independently to each locus.
Figure 3.6 Results of a genetic algorithm for Example 3.5.
The horizontal axis in Figure 3.6 corresponds to generation. The AIC values for all 20 individuals in each generation are plotted. The best model found included predictors 2, 3, 6, 8, 10, 13, 14, 15, 16, 24, 25, and 26, yielding an AIC of −418.95. This matches the best model found using random starts local search (Table 3.2). Darwinian survival of the fittest is clearly illustrated in this figure: The 20 random starting individuals rapidly coalesce into 3 effective subspecies, with the best of these quickly overwhelming the rest and slowly improving thereafter. The best model was first found in generation 60. ![]()
3.4.1.3 Allele Alphabets and Genotypic Representation
The binary alphabet for alleles was introduced in the pioneering work of Holland [333] and continues to be very prevalent in recent research. The theoretical behavior of the algorithm and the relative performance of various genetic operators and other algorithmic variations are better understood for binary chromosomes than for other choices.
For many optimization problems, it is possible to construct a binary encoding of solutions. For example, consider the univariate optimization of f(θ) = 100 − (θ − 4)2 on the range θ ![]() [1, 12.999] = [a1, a2]. Suppose that we represent a number in [a1, a2] as
[1, 12.999] = [a1, a2]. Suppose that we represent a number in [a1, a2] as
where b is a binary number of d digits and the decimal() function converts from base 2 to base 10. If c decimal places of accuracy are required, then d must be chosen to satisfy
(3.8) ![]()
In our example, 14 binary digits are required for accuracy to 3 decimal places, and b = 01000000000000 maps to θ = 4.000 using Equation (3.7).
In some cases, such as the regression model selection problem, a binary-encoded chromosome may be very natural. In others, however, the encoding seems forced, as it does above. For f(θ) = 100 − (θ − 4)2, the chromosome ϑ = 01000000000000 (θ = 4.000) is optimal. However, chromosomes that are genetically close to this, such as 10000000000000 (θ = 7.000) and 00000000000000 (θ = 1.000), have phenotypes that are not close to θ = 4.000. On the other hand, the genotype 00111111111111 has phenotype very close to 4.000 even though the genotype is very different than 01000000000000. Chromosomes that are similar in genotype may have very different phenotypes. Thus, a small mutation may move to a drastically different region of solution space, and a crossover may produce offspring whose phenotypes bear little resemblance to either parent. To resolve such difficulties, a different encoding scheme or modified genetic operators may be required (see Section 3.4.2.3).
An important alternative to binary representation arises in permutation problems of size p, like the traveling salesman problem. In such cases, a natural chromosome is a permutation of the integers 1, . . ., p, for example, ϑ = 752631948 when p = 9. Since such chromosomes must obey the requirement that each integer appear in exactly one locus, some changes to standard genetic operators will be required. Strategies for dealing with permutation chromosomes are discussed in Section 3.4.2.3.
3.4.1.4 Initialization, Termination, and Parameter Values
Genetic algorithms are usually initialized with a first generation of purely random individuals.
The size of the generation, P, affects the speed, convergence behavior, and solution quality of the algorithm. Large values of P are to be preferred, if feasible, because they provide a more diverse genetic pool from which to generate offspring, thereby diversifying the search and discouraging premature convergence. For binary encoding of chromosomes, one suggestion is to choose P to satisfy C ≤ P ≤ 2C, where C is the chromosome length [8]. For permutation chromosomes, the range 2C ≤ P ≤ 20C has been suggested [335]. In most real applications, population sizes have ranged between 10 and 200 [566], although a review of empirical studies suggests that P can often be as small as 30 [531].
Mutation rates are typically very low, in the neighborhood of 1%. Theoretical work and empirical studies have supported a rate of 1/C [464], and another investigation suggested that the rate should be nearly proportional to ![]() [571]. Nevertheless, a fixed rate independent of P and C is a common choice.
[571]. Nevertheless, a fixed rate independent of P and C is a common choice.
The termination criterion for a genetic algorithm is frequently just a maximum number of iterations chosen to limit computing time. One might instead consider stopping when the genetic diversity within chromosomes in the current generation is sufficiently low [17].
3.4.2 Variations
In this section we survey a number of methodological variations that may offer improved performance. These include alterations to the fitness function, selection mechanism, genetic operators, and other aspects of the basic algorithm.
3.4.2.1 Fitness
In a canonical genetic algorithm, the fitness of an organism is often taken to be the objective function value of its phenotype, perhaps scaled by the mean objective function value in its generation. It is tempting to simply equate the objective function value f(θ) to the fitness because the fittest individual then corresponds to the maximum likelihood solution. However, directly equating an organism's fitness to the objective function value for its corresponding phenotype is usually naive in that other choices yield superior optimization performance. Instead, let ϕ(ϑ) denote the value of a fitness function that describes the fitness of a chromosome. The fitness function will depend on the objective function f, but will not equal it. This increased flexibility can be exploited to enhance search effectiveness.
A problem seen in some applications of genetic algorithms is excessively fast convergence to a poor local optimum. This can occur when a few of the very best individuals dominate the breeding and their offspring saturate subsequent generations. In this case, each subsequent generation consists of genetically similar individuals that lack the genetic diversity needed to produce offspring that might typify other, more profitable regions of solution space. This problem is especially troublesome if it occurs directly after initialization, when nearly all individuals have very low fitness. A few chromosomes that are more fit than the rest can then pull the algorithm to an unfavorable local maximum. This problem is analogous to entrapment near an uncompetitive local maximum, which is also a concern for the other search methods discussed earlier in this chapter.
Selective pressure must be balanced carefully, however, because genetic algorithms can be slow to find a very good optimum. It is therefore important to maintain firm selective pressure without allowing a few individuals to cause premature convergence. To do this, the fitness function can be designed to reduce the impact of large variations in f.
A common approach is to ignore the values of ![]() and use only their ranks [18, 532, 660]. For example, one could set
and use only their ranks [18, 532, 660]. For example, one could set
where ri is the rank of ![]() among generation t. This strategy gives the chromosome corresponding to the median quality candidate a selection probability of 1/P, and the best chromosome has probability 2/(P + 1), roughly double that for the median. Rank-based methods are attractive in that they retain a key feature of any successful genetic algorithm—selectivity based on relative fitness—while discouraging premature convergence and other difficulties caused by the actual form of f, which can be somewhat arbitrary [660]. Some less common fitness function formulations involving scaling and transforming f are mentioned in [262].
among generation t. This strategy gives the chromosome corresponding to the median quality candidate a selection probability of 1/P, and the best chromosome has probability 2/(P + 1), roughly double that for the median. Rank-based methods are attractive in that they retain a key feature of any successful genetic algorithm—selectivity based on relative fitness—while discouraging premature convergence and other difficulties caused by the actual form of f, which can be somewhat arbitrary [660]. Some less common fitness function formulations involving scaling and transforming f are mentioned in [262].
3.4.2.2 Selection Mechanisms and Updating Generations
Previously, in Section 3.4.1.2, we mentioned only simple approaches to selecting parents on the basis of fitness. Selecting parents on the basis of fitness ranks (Section 3.4.2.1) is far more common than using selection probabilities proportional to fitness.
Another common approach is tournament selection [204, 263, 264]. In this approach, the set of chromosomes in generation t is randomly partitioned into k disjoint subsets of equal size (perhaps with a few remaining chromosomes temporarily ignored). The best individual in each group is chosen as a parent. Additional random partitionings are carried out until sufficient parents have been generated. Parents are then paired randomly for breeding. This approach ensures that the best individual will breed P times, the median individual will breed once on average, and the worst individual will not breed at all. The approaches of proportional selection, ranking, and tournament selection apply increasing selective pressure, in that order. Higher selective pressure is generally associated with superior performance, as long as premature entrapment in local optima can be avoided [17].
Populations can be partially updated. The generation gap, G, is a proportion of the generation to be replaced by generated offspring [146]. Thus, G = 1 corresponds to a canonical genetic algorithm with distinct, nonoverlapping generations. At the other extreme, G = 1/P corresponds to incremental updating of the population one offspring at a time. In this case, a steady-state genetic algorithm produces one offspring at a time to replace the least fit (or some random relatively unfit) individual [661]. Such a process typically exhibits more variance and higher selective pressure than a standard approach.
When G < 1, performance can sometimes be enhanced with a selection mechanism that departs somewhat from the Darwinian analogy. For example, an elitist strategy would place an exact copy of the current fittest individual in the next generation, thereby ensuring the survival of the best current solution [146]. When G = 1/P, each offspring could replace a chromosome randomly selected from those with below-average fitness [5].
Deterministic selection strategies have been proposed to eliminate sampling variability [19, 464]. We see no compelling need to eliminate the randomness inherent in the selection mechanism.
One important consideration when generating or updating a population is whether to allow duplicate individuals in the population. Dealing with duplicate individuals wastes computing resources, and it potentially distorts the parent selection criterion by giving duplicated chromosomes more chances to produce offspring [138].
3.4.2.3 Genetic Operators and Permutation Chromosomes
To increase genetic mixing, it is possible to choose more than one crossover point. If two crossover points are chosen, the gene sequence between them can be swapped between parents to create offspring. Such multipoint crossover can improve performance [54, 187].
Many other approaches for transferring genes from parents to offspring have been suggested. For example, each offspring gene could be filled with an allele randomly selected from the alleles expressed in that position in the parents. In this case, the parental origins of adjacent genes could be independent [4, 622] or correlated [602], with strength of correlation controlling the degree to which offspring resemble a single parent.
In some problems, a different allele alphabet may be more reasonable. Allele alphabets with many more than two elements have been investigated [13, 138, 524, 534]. For some problems, genetic algorithms using a floating-point alphabet have outperformed algorithms using the binary alphabet [138, 346, 463]. Methods known as messy genetic algorithms employ variable-length encoding with genetic operators that adapt to changing length [265, 266, 267]. Gray coding is another alternative encoding that is particularly useful for real-valued objective functions that have a bounded number of optima [662].
When a nonbinary allele alphabet is adopted, modifications to other aspects of the genetic algorithm, particularly to the genetic operators, is often necessary and even fruitful. Nowhere is this more evident than when permutation chromosomes are used. Recall that Section 3.4.1.3 introduced a special chromosome encoding for permutation optimization problems. For such problems (like the traveling salesman problem), it is natural to write a chromosome as a permutation of the integers 1, . . ., n. New genetic operators are needed then to ensure that each generation contains only valid permutation chromosomes.
For example, let p = 9, and consider the crossover operator. From two parent chromosomes 752631948 and 912386754 and a crossover point between the second and third loci, standard crossover would produce offspring 752386754 and 912631948. Both of these are invalid permutation chromosomes, because both contain some duplicate alleles.
A remedy is order crossover [623]. A random collection of loci is chosen, and the order in which the alleles in these loci appear in one parent is imposed on the same alleles in the other parent to produce one offspring. The roles of the parents can be switched to produce a second offspring. This operator attempts to respect relative positions of alleles. For example, consider the parents 752631948 and 912386754, and suppose that the fourth, sixth, and seventh loci are randomly chosen. In the first parent, the alleles in these loci are 6, 1, and 9. We must rearrange the 6, 1, and 9 alleles in the second parent to impose this order. The remaining alleles in the second parent are * * 238* 754. Inserting 6, 1, and 9 in this order yields 612389754 as the offspring. Reversing the roles of the parents yields a second offspring 352671948.
Many other crossover operators for permutation chromosomes have been proposed [135, 136, 138, 268, 464, 492, 587]. Most are focused on the positions of individual genes. However, for problems like the traveling salesman problem, such operators have the undesirable tendency to destroy links between cities in the parent tours. The desirability of a candidate solution is a direct function of these links. Breaking links is effectively an unintentional source of mutation. Edge-recombination crossover has been proposed to produce offspring that contain only links present in at least one parent [663, 664].
We use the traveling salesman problem to explain edge-recombination crossover. The operator proceeds through the following steps.
Table 3.3 Edge tables showing the cities linked to or from each allele in either parent for each of the first three steps of edge recombination crossover. Beneath each column is the offspring chromosome resulting from each step.
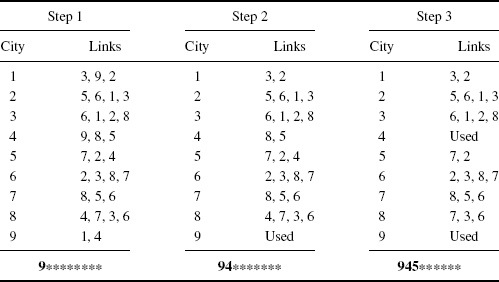
Continuing this process might yield the offspring 945786312 by the following steps: select 7; select 8; select 6; randomly select 3 from the choices of 2 and 3; randomly select 1 from the choices of 1 and 2; select 2.
Note that in each step a city is chosen among those with the fewest links. If, instead, links were chosen uniformly at random, cities would be more likely to be left without a continuing edge. Since tours are circuital, the preference for a city with few links does not introduce any sort of bias in offspring generation.
An alternative edge assembly strategy has been found to be extremely effective in some problems [477].
Mutation of permutation chromosomes is not as difficult as crossover. A simple mutation operator is to randomly exchange two genes in the chromosome [531]. Alternatively, the elements in a short random segment of the chromosome can be randomly permuted [138].
3.4.3 Initialization and Parameter Values
Although traditionally a genetic algorithm is initiated with a generation of purely random individuals, heuristic approaches to constructing individuals with good or diverse fitness have been suggested as an improvement on random starts [138, 531].
Equal sizes for subsequent generations are not required. Population fitness usually improves very rapidly during the early generations of a genetic algorithm. In order to discourage premature convergence and promote search diversity, it may be desirable to use a somewhat large generation size P for early generations. If P is fixed at too large a value, however, the entire algorithm may be too slow for practical use. Once the algorithm has made significant progress toward the optimum, important improving moves most often come from high-quality individuals; low-quality individuals are increasingly marginalized. Therefore, it has been suggested that P may be decreased progressively as iterations continue [677]. However, rank-based selection mechanisms are more commonly employed as an effective way to slow convergence.
It can be also useful to allow a variable mutation rate that is inversely proportional to the population diversity [531]. This provides a stimulus to promote search diversity as generations become less diverse. Several authors suggest other methods for allowing the probabilities of mutation and crossover and other parameters of the genetic algorithm to vary adaptively over time in manners that may encourage search diversity [54, 137, 138, 464].
3.4.4 Convergence
The convergence properties of genetic algorithms are beyond the scope of this chapter, but several important ideas are worth mentioning.
Much of the early analysis about why genetic algorithms work was based on the notion of schemata [262, 333]. Such work is based on a canonical genetic algorithm with binary chromosome encoding, selection of each parent with probability proportional to fitness, simple crossover applied every time parents are paired, and mutation randomly applied to each gene independently with probability μ. For this setting, the schema theorem provides a lower bound on the expected number of instances of a schema in generation t + 1, given that it was present in generation t.
The schema theorem shows that a short, low-order schema (i.e., one specifying only a few nearby alleles) will enjoy increased expected representation in the next generation if the average fitness of chromosomes containing that schema in the generation at time t exceeds the average fitness of all chromosomes in the generation. A longer and/or more complex schema will require higher relative fitness to have the same expectation. Proponents of schema theory argue that convergence to globally competitive candidate solutions can be explained by how genetic algorithms simultaneously juxtapose many short low-order schemata of potentially high fitness, thereby promoting propagation of advantageous schemata.
More recently, the schema theorem and convergence arguments based upon it have become more controversial. Traditional emphasis on the number of instances of a schema that propagate to the next generation and on the average fitness of chromosomes containing that schema is somewhat misguided. What matters far more is which particular chromosomes containing that schema are propagated. Further, the schema theorem overemphasizes the importance of schemata: in fact it applies equally well to any arbitrary subsets of Θ. Finally, the notion that genetic algorithms succeed because they implicitly simultaneously allocate search effort to many schemata-defined regions of Θ has been substantially discredited [647]. An authoritative exposition of the mathematical theory of genetic algorithms is given by Vose [646]. Other helpful treatments include [200, 533].
Genetic algorithms are not the only optimization strategy that can be motivated by analogy to a complex biological system. For example, particle swarm optimization also creates and updates a population of candidate solutions [372, 373, 594]. The locations of these solutions within the search space evolve through simple rules that can be viewed as reflecting cooperation and competition between individuals analogous to the movement of birds in a flock. Over a sequence of iterations, each individual adjusts its location (i.e., candidate solution) based on its own flying experience and those of its companions.
3.5 Tabu Algorithms
A tabu algorithm is a local search algorithm with a set of additional rules that guide the selection of moves in ways that are believed to promote the discovery of a global maximum. The approach employs variable neighborhoods: The rules for identifying acceptable steps change at each iteration. Detailed studies of tabu methods include [254, 255, 257–259].
In a standard ascent algorithm, entrapment in a globally uncompetitive local maximum is likely, because no downhill moves are allowed. Tabu search allows downhill moves when no uphill move can be found in the current neighborhood (and possibly in other situations too), thereby potentially escaping entrapment. An early form of tabu search, called steepest ascent/mildest descent, moved to the least unfavorable neighbor when there was no uphill move [306].
If a downhill step is chosen, care must be taken to ensure that the next step (or a future one) does not simply reverse the downhill move. Such cycling would eliminate the potential long-term benefit of the downhill move. To prevent such cycling, certain moves are temporarily forbidden, or made tabu, based on the recent history of the algorithm.
There are four general types of rules added to local search by tabu search methods. The first is to make certain potential moves temporarily tabu. The others involve aspiration to better solutions, intensification of search in promising areas of solution space, and diversification of search candidates to promote broader exploration of the solution space. These terms will be defined after we discuss tabus.
3.5.1 Basic Definitions
Tabu search is an iterative algorithm initiated at time t = 0 with a candidate solution θ(0). At the tth iteration, a new candidate solution is selected from a neighborhood of θ(t). This candidate becomes θ(t+1). Let H(t) denote the history of the algorithm through time t. It suffices for H(t) to be a selective history, remembering only certain matters necessary for the future operation of the algorithm.
Unlike simple local search, a tabu algorithm generates a neighborhood of the current candidate solution that depends on the search history; denote this by ![]() . Furthermore, the identification of the preferred θ(t+1) in
. Furthermore, the identification of the preferred θ(t+1) in ![]() may depend not only on f but also on the search history. Thus, we may assess neighbors using an augmented objective function,
may depend not only on f but also on the search history. Thus, we may assess neighbors using an augmented objective function, ![]() .
.
A single step from θ(t) to θ(t+1) can be characterized by many attributes. Attributes will be used to describe moves or types of moves that will be forbidden, encouraged, or discouraged in future iterations of the algorithm. Examples of attributes are given in the left column of Table 3.4. Such attributes are not unique to tabu search; indeed, they can be used to characterize moves from any local search. However, tabu search explicitly adapts the current neighborhood according to the attributes of recent moves.
Table 3.4 Examples of attributes. The left column gives examples in a generic context. The right column gives corresponding attributes in the specific context of 2-change neighborhoods in a regression model selection problem.
| Attribute | Model Selection Example | |
| A change in the value of |
A1: Whether the ith predictor is added (or deleted) from the model. |
|
| A swap in the values of |
A2: Whether the absent variable is exchanged for the variable present in the model. |
|
| A change in the value of f resulting from the step, f(θ(t+1)) − f(θ(t)). | A3: The reduction in AIC achieved by the move. |
|
| The value g(θ(t+1)) of some other strategically chosen function g. | A4: The number of predictors in the new model. |
|
| A change in the value of g resulting from the step, g(θ(t+1)) − g(θ(t)). | A5: A change to a different variable selection criterion such as Mallows's Cp [435] or the adjusted R2 [483]. |
|
The attributes in Table 3.4 can be illustrated by considering a regression model selection problem. Suppose ![]() if the ith predictor is included in the model at time t, and 0 otherwise. Suppose that 2-change neighborhoods consist of all models to which two variables separately have each been added or deleted from the current model. The right column of Table 3.4 gives one example of each generic attribute listed, in the context of these 2-change neighborhoods in the regression model selection problem from Example 3.2. These examples are labeled A1 through A5. Many other effective attributes can be identified from the context of specific optimization problems.
if the ith predictor is included in the model at time t, and 0 otherwise. Suppose that 2-change neighborhoods consist of all models to which two variables separately have each been added or deleted from the current model. The right column of Table 3.4 gives one example of each generic attribute listed, in the context of these 2-change neighborhoods in the regression model selection problem from Example 3.2. These examples are labeled A1 through A5. Many other effective attributes can be identified from the context of specific optimization problems.
Denote the ath attribute as Aa. Note that the complement (i.e., negation) of an attribute is also an attribute, so if Aa corresponds to swapping the values of ![]() and
and ![]() , then
, then ![]() corresponds to not making that swap.
corresponds to not making that swap.
As the algorithm progresses, the attributes of the tth move will vary with t, and the quality of the candidate solution will also vary. Future moves can be guided by the history of past moves, their objective function values, and their attributes. The recency of an attribute is the number of steps that have passed since a move most recently had that attribute. Let ![]() if the ath attribute is expressed in the move yielding θ(t), let
if the ath attribute is expressed in the move yielding θ(t), let ![]() if it is most recently expressed in the move yielding θ(t−1), and so forth.
if it is most recently expressed in the move yielding θ(t−1), and so forth.
3.5.2 The Tabu List
When considering a move from θ(t), we compute the increase in the objective function achieved for each neighbor of θ(t). Ordinarily, the neighbor that provides the greatest increase would be adopted as θ(t+1). This corresponds to the steepest ascent.
Suppose, however, that no neighbor of θ(t) yields an increased objective function. Then θ(t+1) is ordinarily chosen to be the neighbor that provides the smallest decrease. This is the mildest descent.
If only these two rules were used for search, the algorithm would quickly become trapped and converge to a local maximum. After one move of mildest descent, the next move would return to the hilltop just departed. Cycling would ensue.
To avoid such cycling, a tabu list of temporarily forbidden moves is incorporated in the algorithm. Each time a move with attribute Aa is taken, ![]() is put on a tabu list for τ iterations. When
is put on a tabu list for τ iterations. When ![]() first equals τ, the tabu expires and
first equals τ, the tabu expires and ![]() is removed from the tabu list. Thus, moves with attributes on the tabu list are effectively excluded from the current neighborhood. The modified neighborhood is denoted
is removed from the tabu list. Thus, moves with attributes on the tabu list are effectively excluded from the current neighborhood. The modified neighborhood is denoted
(3.10) ![]()
This prevents undoing the change for τ iterations, thereby discouraging cycling. By the time that the tabu has expired, enough other aspects of the candidate solution should have changed that reversing the move may no longer be counterproductive. Note that the tabu list is a list of attributes, not moves, so a single tabu attribute may forbid entire classes of moves.
The tabu tenure, τ, is the number of iterations over which an attribute is tabu. This can be a fixed number or it may vary, systematically or randomly, perhaps based on features of the attribute. For a given problem, a well-chosen tabu tenure will be long enough to prevent cycling and short enough to prevent the deterioration of candidate solution quality that occurs when too many moves are forbidden. Fixed tabu tenures between 7 and 20, or between ![]() and
and ![]() , where p is the size of the problem, have been suggested for various problem types [257]. Tabu tenures that vary dynamically seem more effective in many problems [259]. Also, it will often be important to use different tenures for different attributes. If an attribute contributes tabu restrictions for a wide variety of moves, the corresponding tabu tenure should be short to ensure that future choices are not limited.
, where p is the size of the problem, have been suggested for various problem types [257]. Tabu tenures that vary dynamically seem more effective in many problems [259]. Also, it will often be important to use different tenures for different attributes. If an attribute contributes tabu restrictions for a wide variety of moves, the corresponding tabu tenure should be short to ensure that future choices are not limited.
Example 3.6 (Genetic Mapping, Continued) We illustrate some uses of tabus, using the gene mapping problem introduced in Example 3.1.
First, consider monitoring the swap attribute. Suppose that Aa is the swap attribute corresponding to exchanging two particular loci along the chromosome. When a move Aa is taken, it is counterproductive to immediately undo the swap, so ![]() is placed on the tabu list. Search progresses only among moves that do not reverse recent swaps. Such a tabu promotes search diversity by avoiding quick returns to recently searched areas.
is placed on the tabu list. Search progresses only among moves that do not reverse recent swaps. Such a tabu promotes search diversity by avoiding quick returns to recently searched areas.
Second, consider the attribute identifying the locus label θj for which ![]() is smallest in the new move. In other words, this attribute identifies the two loci in the new chromosome that are nearest each other. If the complement of this attribute is put on the tabu list, any move to a chromosome for which other loci are closer will be forbidden moves for τ iterations. Such a tabu promotes search intensity among genetic maps for which loci θj and θj are closest.
is smallest in the new move. In other words, this attribute identifies the two loci in the new chromosome that are nearest each other. If the complement of this attribute is put on the tabu list, any move to a chromosome for which other loci are closer will be forbidden moves for τ iterations. Such a tabu promotes search intensity among genetic maps for which loci θj and θj are closest.
Sometimes, it may be reasonable to place the attribute itself, rather than its complement, on the tabu list. For example, let h(θ) compute the mean ![]() between adjacent loci in a chromosome ordered by θ. Let Aa be the attribute indicating excessive change of the mean conditional MLE map distance, so Aa equals 1 if |h(θ(t+1)) − h(θ(t))| > c and 0 otherwise, for some fixed threshold c. If a move with mean change greater than c is taken, we may place Aa itself on the tabu list for τ iterations. This prevents any other drastic mean changes for a period of time, allowing better exploration of the newly entered region of solution space before moving far away.
between adjacent loci in a chromosome ordered by θ. Let Aa be the attribute indicating excessive change of the mean conditional MLE map distance, so Aa equals 1 if |h(θ(t+1)) − h(θ(t))| > c and 0 otherwise, for some fixed threshold c. If a move with mean change greater than c is taken, we may place Aa itself on the tabu list for τ iterations. This prevents any other drastic mean changes for a period of time, allowing better exploration of the newly entered region of solution space before moving far away. ![]()
3.5.3 Aspiration Criteria
Sometimes, choosing not to move to a nearby candidate solution because the move is currently tabu can be a poor decision. In these cases, we need a mechanism to override the tabu list. Such a mechanism is called an aspiration criterion.
A simple and popular aspiration criterion is to permit a tabu move if it provides a higher value of the objective function than has been found in any iteration so far. Clearly it makes no sense to overlook the best solution found so far, even if it is currently tabu. One can easily envision scenarios where this aspiration criterion is useful. For example, suppose that a swap of two components of θ is on the tabu list and the candidate solutions at each iteration recently have drifted away from the region of solution space being explored when the tabu began. The search will now be in a new region of solution space where it is quite possible that reversing the tabu swap would lead to a drastic increase in the objective function.
Another interesting option is aspiration by influence. A move or attribute is influential if it is associated with a large change in the value of the objective function. There are many ways to make this idea concrete [257]. To avoid unnecessary detail about numerous specific possibilities, let us simply denote the influence of the ath attribute as ![]() for a move yielding θ(t). In many combinatorial problems, there are a lot of neighboring moves that cause only small incremental changes to the value of the objective function, while there are a few moves that cause major shifts. Knowing the attributes of such moves can help guide search. Aspiration by influence overrides the tabu on reversing a low-influence move if a high-influence move is made prior to the reversal. The rationale for this is that the recent high-influence step may have moved the search to a new region of the solution space where further local exploration is useful. The reversal of the low-influence move will probably not induce cycling, since the intervening high-influence move likely shifted scrutiny to a portion of solution space more distant than what could be reached by the low-influence reversal.
for a move yielding θ(t). In many combinatorial problems, there are a lot of neighboring moves that cause only small incremental changes to the value of the objective function, while there are a few moves that cause major shifts. Knowing the attributes of such moves can help guide search. Aspiration by influence overrides the tabu on reversing a low-influence move if a high-influence move is made prior to the reversal. The rationale for this is that the recent high-influence step may have moved the search to a new region of the solution space where further local exploration is useful. The reversal of the low-influence move will probably not induce cycling, since the intervening high-influence move likely shifted scrutiny to a portion of solution space more distant than what could be reached by the low-influence reversal.
Aspiration criteria can also be used to encourage moves that are not tabu. For example, when low-influence moves appear to provide only negligible improvement in the objective function, they can be downweighted and high-influence moves can be given preference. There are several ways to do this; one approach is to incorporate in ![]() either a penalty or an incentive term that depends on the relative influence of candidate moves.
either a penalty or an incentive term that depends on the relative influence of candidate moves.
3.5.4 Diversification
An important component of any search is to ensure that the search is broad enough. Rules based on how often attributes are observed during search can be used to increase the diversity of candidate solutions examined during tabu search.
The frequency of an attribute records the number of moves that manifested that attribute since the search began. Let C(Aa, H(t)) represent the count of occurrences of the ath attribute thus far. Then F(Aa, H(t)) represents a frequency function that can be used to penalize moves that are repeated too frequently. The most direct definition is F(Aa, H(t)) = C(Aa, H(t))/t, but the denominator may be replaced by the sum, the maximum, or the average of the counts of occurrences of various attributes.
Suppose the frequency of each attribute is recorded, either over the entire history or over the most recent ψ moves. Note that this frequency may be one of two types, depending on the attribute considered. If the attribute corresponds to some feature of θ(t), then the frequency measures how often that feature is seen in candidate solutions considered during search. Such frequencies are termed residence frequencies. If, alternatively, the attribute corresponds to some change induced by moving from one candidate solution to another, then the frequency is a transition frequency. For example, in the regression model selection problem introduced in Example 3.2, the attribute noting the inclusion of the predictor xi in the model would have a residence frequency. The attribute that signaled when a move reduced the AIC would have a transition frequency.
If attribute Aa has a high residence frequency and the history of the most recent ψ moves covers nearly optimal regions of solution space, this may suggest that Aa is associated with high-quality solutions. On the other hand, if the recent history reflects the search getting stuck in a low-quality region of solution space, then a high residence frequency may suggest that the attribute is associated with bad solutions. Usually, ψ > τ is an intermediate or long-term memory parameter that allows the accumulation of additional historical information to diversify future search.
If attribute Aa has a high transition frequency, this attribute may be what has been termed a crack filler. Such an attribute may be frequently visited during the search in order to fine-tune good solutions but rarely offers fundamental improvement or change [257]. In this case, the attribute has low influence.
A direct approach employing frequency to increase search diversification is to incorporate a penalty or incentive function in ![]() . The choice
. The choice
(3.11) ![]()
with c > 0 has been suggested [566]. If all nontabu moves are downhill, then this approach discourages moves that have the high-frequency attribute Aa. An analogous strategy can be crafted to diversify the selection of uphill moves.
Instead of incorporating a penalty or incentive in the objective function, it is possible to employ a notion of graduated tabu status, where an attribute may be only partially tabu. One way to create a tabu status that varies by degrees is to invoke probabilistic tabu decisions: An attribute can be assigned a probability of being tabu, where the probability is adjusted according to various factors, including the tabu tenure [257].
3.5.5 Intensification
In some searches it may be useful to intensify the search effort in particular areas of solution space. Frequencies can also be used to guide such intensification. Suppose that the frequencies of attributes are tabulated over the most recent υ moves, and a corresponding record of objective function values is kept. By examining these data, key attributes shared by good candidate solutions can be identified. Then moves that retain such features can be rewarded and moves that remove such features can be penalized through ![]() . The time span υ > τ parameterizes the length of a long-term memory to enable search intensification in promising areas of solution space.
. The time span υ > τ parameterizes the length of a long-term memory to enable search intensification in promising areas of solution space.
3.5.6 Comprehensive Tabu Algorithm
Below we summarize a fairly general tabu algorithm that incorporates many of the features described above. After initialization and identification of a list of problem-specific attributes, the algorithm proceeds as follows:
It is sensible to stop when a maximum number of iterations has been reached, and then to take the best candidate solution yet found as the final result. Search effort can be split among a collection of random starts rather than devoting all resources to one run from a single start. By casting tabu search in a Markov chain framework, it is possible to obtain results on the limiting convergence of the approach [191].
Example 3.7 (Baseball Salaries, Continued) A simple tabu search was applied to the variable selection problem for regression modeling of the baseball data introduced in Example 3.3. Only attributes signaling the presence or absence of each predictor were monitored. Moves that would reverse the inclusion or removal of a predictor were made tabu for τ = 5 moves, and the algorithm was run for 75 moves from a random start. The aspiration criterion permitted an otherwise tabu move if it yielded an objective function value above the best previously seen.
Figure 3.7 shows the values of the AIC for the sequence of candidate solutions generated by this tabu search. The AIC was quickly improved, and an optimum value of −418.95, derived from the model using predictors 2, 3, 6, 8, 10, 13, 14, 15, 16, 24, 25, and 26, was found on two occasions: iterations 29 and 43. This solution matches the best model found using random starts local search (Table 3.2). ![]()
Figure 3.7 Results of tabu search for Example 3.7. Only AIC values between −360 and −420 are shown.
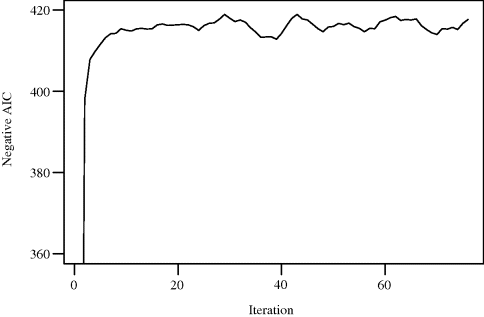
Problems
The baseball data introduced in Section 3.3 are available from the website for this book. Problems 3.1 –3.4 explore the implications of various algorithm configurations. Treat these problems in the spirit of experiments, trying to identify settings where interesting differences can be observed. Increase the run lengths from those used above to suit the speed of your computer, and limit the total number of objective function evaluations in every run (effectively the search effort) to a fixed number so that different algorithms and configurations can be compared fairly. Summarize your comparisons and conclusions. Supplement your comments with graphs to illustrate key points.
3.1. Implement a random starts local search algorithm for minimizing the AIC for the baseball salary regression problem. Model your algorithm after Example 3.3.
3.2. Implement a tabu algorithm for minimizing the AIC for the baseball salary regression problem. Model your algorithm after Example 3.7.
3.3. Implement simulated annealing for minimizing the AIC for the baseball salary regression problem. Model your algorithm on Example 3.4.
3.4. Implement a genetic algorithm for minimizing the AIC for the baseball salary regression problem. Model your algorithm on Example 3.5.
(3.12) ![]()
(3.13) ![]()
or
(3.14) ![]()
(3.15) ![]()
3.5. Consider the genetic mapping example introduced in Example 3.1. Figure 3.8 shows some data for 100 simulated data sequences for a chromosome of length 12. The left panel of this figure shows the data under the true genetic map ordering, and the right panel shows the actual data, with the ordering unknown to the analyst. The data are available from the website for this book.
Figure 3.8 Chromosomes for Problem 3.5. Simulated data on 12 loci are available for 100 individuals. For each locus, the source chromosome from the heterozygous parent is encoded in black or white, analogously to Figure 3.1 in Example 3.1. The left panel shows the data arranged according to the true locus ordering, whereas the right panel shows the data arranged by locus label as they would be recorded during data collection.
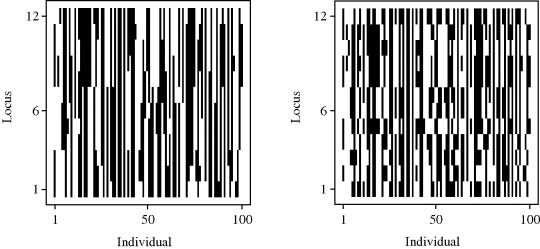
3.6. Consider the genetic mapping data described in Problem 3.5.
3.7. The website for this book also includes a second synthetic dataset for a genetic mapping problem. For these data, there are 30 chromosomes. Attempt one or more heuristic search methods for these data. Describe your implementation, the results, and the nature of any problems you encounter. The true ordering used to simulate the data is also given for this dataset. Although the true ordering may not be the MLE, how close is your best ordering to the true ordering? How much larger is this problem than the one examined in the previous problem?
3.8. Thirteen chemical measurements were carried out on each of 178 wines from three regions of Italy [53]. These data are available from the website for this book. Using one or more heuristic search methods from this chapter, partition the wines into three groups for which the total of the within-group sum of squares is minimal. Comment on your work and the results. This is a search problem of size 3p where p = 178. If you have access to standard cluster analysis routines, check your results using a standard method like that of Hartigan and Wong [317].