
35
chapter four
Pilot study
4.1 Conducting the pilot study
A pilot study was performed prior to embarking upon the full-scale
study to assist in determining the viability of the proposed research
methodology. The data were collected using the POC survey instru-
ments to measure culture, the OTI survey instrument to measure trust,
and the demographic questionnaire. The sample consisted of 51 technical
professionals across three (3) organizations. The three organizations that
participated in the study are referred to as Organizations A, B, and C. The
collected data were analyzed using Pearson correlation analysis to deter-
mine the relationship between culture and trust. The mean culture and
trust results were also calculated and reviewed.
4.1.1 Organization A
Organization A operates in a research environment providing engineer-
ing services to a variety of projects serving both government as well as
the private business sector. This organization is recognized as playing an
important role in our nation’s security. The sample from this organization
did not contain any minority representation. The demographic data for
the organization are shown in Table4.1.
4.1.2 Organization B
Organization B is a government organization that provides support to
various government and public initiatives across the country, as needed.
The organization is governed by extensive use of procedures and has
processes in place to ensure that the chain of command is followed.
Thedemographic data for Organization B are listed in Table4.2.
4.1.3 Organization C
Organization C provides a variety of consultation services to various proj-
ects and organizations. Some of the consultation support includes setting
policies and developing procedures along with providing various labora-
tory analytical procedures. The demographic data for Organization C are
listed in Table4.3.

36 Culture and trust in technology-driven organizations
4.2 Pilot results
A total of 51 data points was collected and used in the pilot study.
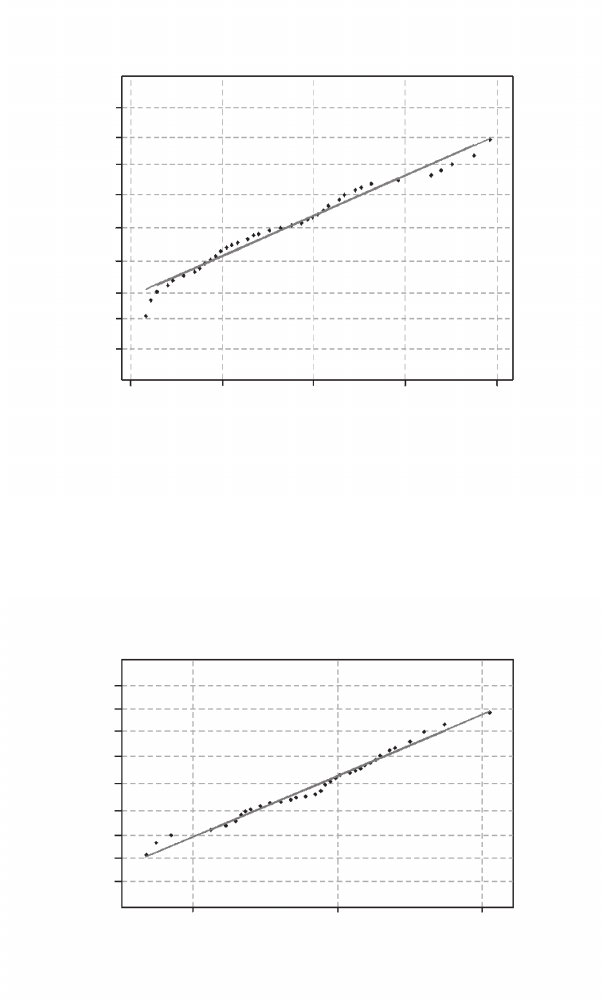
Normality analysis was performed for both the organizational trust and
organizational culture data. The normality analysis (Figures4.1 and 4.2)
demonstrated that the data collected were representative of an approxi-
mate normal population.
A correlation analysis was performed using the Pearson correlation
method to determine the correlation between trust and culture for the
entire dataset. The correlation coefcient for the organizational trust and
culture data was 0.55 with a p-value of <0.001. It is recognized that cor-
relation coefcients between 0.30 and 0.70 are signicant in determining
Table4.1 Organization A Sample Demographics
Demographics % Population
Females 37
Males 63
African Americans 0
Caucasians 100
Management 10.5
Nonmanagement 89.5
Table4.2 Organization B Sample Demographics
Demographics % Population
Females 22.2
Males 72.2
African Americans 72.2
Caucasians 27.8
Management 15.8
Nonmanagement 84.2
Table4.3 Organization C Sample Demographics
Demographics % Population
Females 42.1
Males 57.9
African Americans 26.3
Caucasians 73.7
Management 94.7
Nonmanagement 5.3
37Chapter four: Pilot study
.999
99
.95
.80
.50
.20
.05
.01
.001
2.6 3.6 4.6 5.6 6.6
Probability
Culture
Average: 4.28835
StDev: 0.935516
N: 51
Anderson–Darling Normality Te st
A-Squared: 0.486
p-Value: 0.216
Figure 4.1 Normality plot for culture data.
.999
.99
.95
.80
.50
.20
.05
.01
.001
2.5 3.5 4.5
Trust
Probability
Average: 3.37789
StDev: 0.507066
N: 51
Anderson–Darling Normality Te st
A-Squared: 0.449
p-Value: 0.267
Figure 4.2 Normality plot for trust data.

38 Culture and trust in technology-driven organizations
the relationship between two datasets. The correlation coefcient for the
limited pilot study demonstrates that a correlation between organiza-
tional culture and trust exists.
The mean for the organizational trust survey and the culture sur-
vey were 3.4 and 4.2, respectively. The mean trust scores for the orga-
nizations ranged from 3.2 to 3.5 and the mean culture scores ranged
from 3.9 to 5.0. Organization A is noted as having both the lowest cul-
ture and trust means of 3.9 and 3.2, respectively. Organization C was
recorded as having the highest culture and trust means of 5.0 and 3.5,
respectively. The culture and trust means for each of the organizations
further demonstrates that there is a relationship between organiza-
tional culture and organizational trust. The culture and trust means
for each of the organizations are summarized in Table4.4 and shown
in Figure4.3.
The bar chart in Figure 4.3 provides a pictorial view of the data.
The chart shows that as the culture scores increase the trust scores also
increase and as the culture scores decrease the trust scores decrease.
Bar Chart Trust — Culture
Org C
Org B
Org A
0
2
4 6
Trust & Culture Means
Organization
Culture
Trust
Figure 4.3 Bar chart for culture and trust pilot data.
Table4.4 Culture and Trust Means—Pilot
Organization Trust Culture
A 3.2 3.9
B 3.3 4.5
C 3.5 5.0
39Chapter four: Pilot study
4.3 Summary of pilot study
The pilot study results support the premise that the culture of an orga-
nization can be important in terms of building and maintaining trust.
Specically, the results show that there is a positive correlation between
organizational culture and organizational trust. The demographic data
show a difference in trust levels for males and females. There was also
a difference noted in trust levels for African Americans and Caucasians.
Because the sample size was small, additional data collection was needed
to further validate the theory and ndings.
4.4 Lesson learned
The most important lesson learned as a result of the pilot study involved
condentiality of information. Survey participants were concerned with
the possibility of being connected to their completed surveys in some
way. Therefore, some potential participants were reluctant to complete
the surveys. Some employees refused participation, fearing that the infor-
mation they were asked to provide might be traceable to them. As a result
of the condentiality concerns encountered during the pilot, modica-
tions to the survey distribution and collection process were made. During
the research, surveys were distributed in envelopes with instructions
for the survey participants to seal them after completion. In addition, a
statement assuring survey participants that condentiality of information
would be maintained was added to each envelope.
..................Content has been hidden....................
You can't read the all page of ebook, please click here login for view all page.