
131
Appendix: Participating
organization data and charts

132 Appendix: Participating organization data and charts
Organization D
Table A.1 Sample Demographics—Organization D
Demographics % Population
Females 20.0
Males 80.0
African Americans 34.3
Caucasians 51.4
Hispanic 8.6
Other Races 5.7
<25 years of age 47.1
25–35 years of age 32.9
36–45 years of age 15.7
46–55 years of age 4.3
55+ years of age 0.0
<1 year with company 28.6
1 to <5 years with company 52.9
5 to <10 years with company 7.1
10 to <20 years with company 7.1
20 to <30 years with company 2.9
30 or more years with company 0.0
Management 24.3
Nonmanagement 75.7
Table A.2 Trust and Culture Means—Gender
Organization D
Demographics Trust means Culture means
Gender
Females 3.0 3.9
Males 3.3 4.4
Race
American Indians 3.3 4.5
Caucasians 3.2 4.2
Hispanics 3.3 4.7

133Appendix: Participating organization data and charts
Table A.3 Trust and Culture Means—Age Group
Organization D
Age (Years) Trust means Culture means
<25 3.2 4.5
25–35 3.2 4.1
36–45 3.2 4.7
46–55 3.9 4.0
55+ NA NA
Table A.4 Job Tenure Trust and Culture Means—Organization D
Organization tenure Trust means Culture means
<1 year 3.2 4.6
1 to <5 3.2 4.3
5 to <10 3.0 3.7
10 to <15 NA NA
15 to <20 3.7 3.8
20 to <30 3.4 5.0
30 or more NA NA
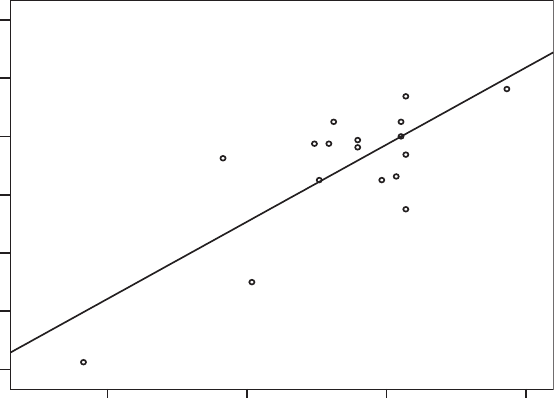
5.004.003.002.001.00
Trust
8.00
7.00
6.00
5.00
4.00
3.00
2.00
1.00
Culture
Figure A.1 Scatterplot—Organization D.

134 Appendix: Participating organization data and charts
Organization E
Table A.5 Sample Demographics E
Demographics % Population
Females 40.0
Males 60.0
African Americans 0.0
Caucasians 100
<25 years of age NA
25–35 years of age NA
36–45 years of age NA
46–55 years of age NA
55+ years of age NA
<1 year with company NA
1 to <5 years with company NA
5 to <10 years with company NA
10 to <20 years with company NA
20 to <30 years with company NA
30 or more years with company NA
Management 20.0
Nonmanagement 80.0
Table A.6 Trust and Culture Means—Gender
Organization E
Demographics Trust means Culture means
Gender
Females 3.6 5.4
Males 3.7 5.6
Race
Caucasians 3.7 5.6
African Americans NA NA
135Appendix: Participating organization data and charts
5.004.003.002.00
Trust
8.00
7.00
6.00
5.00
4.00
3.00
2.00
Culture
Figure A.2 Scatterplot—Organization E.
..................Content has been hidden....................
You can't read the all page of ebook, please click here login for view all page.