
17
Log Analysis
In Chapter 14, Investigating an Incident, you learned about the investigation process, and some techniques for finding the right information while investigating an issue. However, to investigate a security issue, it is often necessary to review multiple logs from different vendors and different devices. Although each vendor might have some custom fields in the log, the reality is that once you learn how to read logs, it becomes easier to switch vendors and just focus on deltas for that vendor. While there are many tools that will automate log aggregation, such as a SIEM solution, there will be scenarios in which you need to manually analyze a log in order to figure out the root cause.
In this chapter, we are going to cover the following topics:
- Data correlation
- Operating system logs
- Firewall logs
- Web server logs
- Amazon Web Services (AWS) logs
- Azure Activity logs
- Google Cloud Platform (GCP) logs
Let’s start by examining the data correlation approach to viewing logs.
Data correlation
There is no doubt that the majority of organizations will be using some sort of SIEM solution to concentrate all of their logs in one single location, and using a custom query language to search throughout the logs. While this is the current reality, as a security professional, you still need to know how to navigate through different events, logs, and artifacts to perform deeper investigations. Many times, the data obtained from the SIEM will be useful in identifying the threat, the threat actors, and narrowing down the compromised systems but, in some circumstances, this is not enough; you need to find the root cause and eradicate the threat.
For this reason, every time that you perform data analysis, it is important to think about how the pieces of the puzzle will be working together.
The following diagram shows an example of this data correlation approach to review logs:
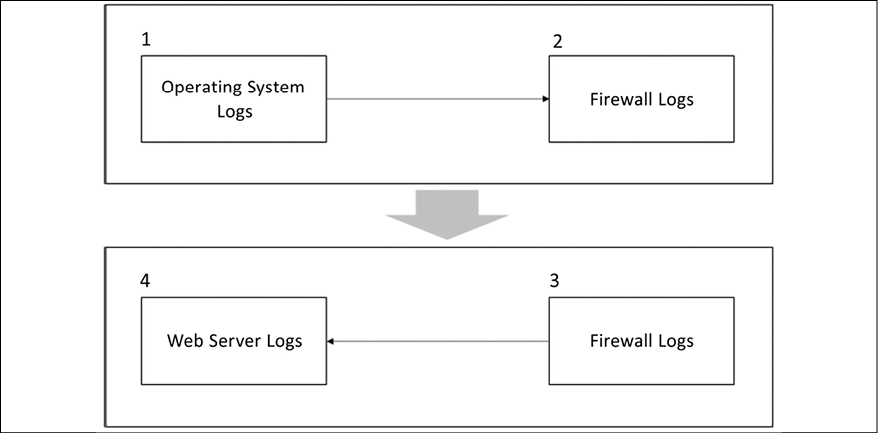
Figure 17.1: Data correlation approach while reviewing logs
Let’s see how this flowchart works:
- The investigator starts reviewing indications of compromise in the operating system’s logs. Many suspicious activities were found in the OS and, after reviewing a Windows prefetch file, it is possible to conclude that a suspicious process started a communication with an external entity. It is now time to review the firewall logs in order to verify more information about this connection.
The firewall logs reveal that the connection between the workstation and the external website was established using TCP on port 443 and that it was encrypted.
- During this communication, a callback was initiated from the external website to the internal web server. It’s time to review the web server log files.
- The investigator continues the data correlation process by reviewing the IIS logs located in this web server. They find out that the adversary tried a SQL injection attack against this web server.
As you can see from this flowchart, there is a logic behind which logs to access, what information you are looking for, and most importantly, how to look at all this data in a contextualized manner.
Operating system logs
The types of logs available in an operating system may vary; in this book, we will focus on core logs that are relevant from a security perspective. We will use Windows and Linux operating systems to demonstrate that.
Windows logs
In a Windows operating system, the most relevant security-related logs are accessible via Event Viewer. In Chapter 14, Investigating an Incident, we spoke about the most common events that should be reviewed during an investigation. While the events can be easily located in Event Viewer, you can also obtain the individual files at WindowsSystem32winevtLogs, as shown in the following screenshot:
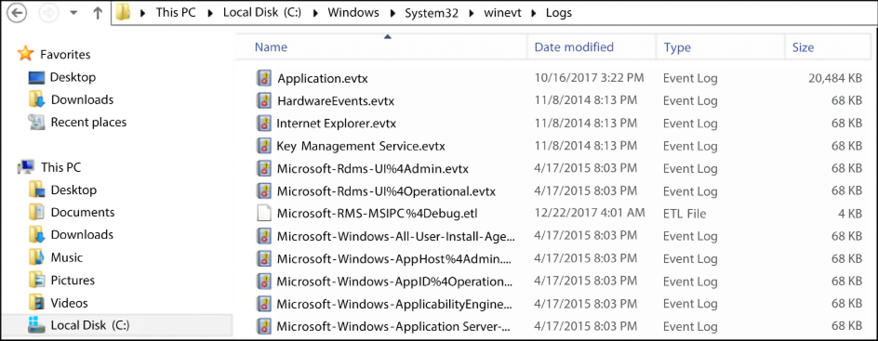
Figure 17.2: Most relevant security-related logs
However, log analysis in an operating system is not necessarily limited to the logging information provided by the OS, especially in Windows. There are other sources of information that you could use, including prefetch files (Windows Prefetch). These files contain relevant information regarding process execution. They can be useful when trying to understand whether a malicious process was executed and which actions were done by that first execution.
In Windows 10, you also have OneDrive logs (C:Users<USERNAME>AppDataLocalMicrosoftOneDrivelogs), which can be useful. If you are investigating data extraction, this could be a good place to look to verify whether any wrongdoing was carried out. Review the SyncDiagnostics.log for more information.
To parse Windows Prefetch files, use the Python script at https://github.com/PoorBillionaire/Windows-Prefetch-Parser.
Another important file location is where Windows stores the user mode crash dump files, which is C:Users<username>AppDataLocalCrashDumps. These crash dump files are important artifacts that can be used to identify potential malware in the system.
One common type of attack that can be exposed in a dump file is the code injection attack. This happens when there is an insertion of executable modules into running processes or threads. This technique is mostly used by malware to access data and to hide or prevent its removal (for example, persistence).
It is important to emphasize that legitimate software developers may occasionally use code injection techniques for non-malicious reasons, such as modifying an existing application.
To open these dump files, you need a debugger, such as WinDbg (http://www.windbg.org), and you need the proper skills to navigate through the dump file to identify the root cause of the crash.
If you don’t have those skills, you can also use Instant Online Crash Analysis (http://www.osronline.com). The results that follow are a brief summary of the automated analyses from using this online tool (the main areas to follow up are in bold):
TRIAGER: Could not open triage file : e:dump_analysisprogramtriageguids.ini, error 2
TRIAGER: Could not open triage file : e:dump_analysisprogramtriagemodclass.ini, error 2
GetUrlPageData2 (WinHttp) failed: 12029.
*** The OS name list needs to be updated! Unknown Windows version: 10.0 ***
FAULTING_IP:
eModel!wil::details::ReportFailure+120 00007ffebe134810 cd29int29h
EXCEPTION_RECORD:    ffffffffffffffff -- (.exr 0xffffffffffffffff) ExceptionAddress: 00007ffebe134810 (eModel!wil::details::ReportFailure+0x0000000000000120)
192.168.1.10 - - [07/Dec/2017:15:35:19    -0800] "GET    /public/accounting
HTTP/1.1" 200 6379
192.168.1.10 - - [07/Dec/2017:15:36:22    -0800] "GET    /docs/bin/main.php 200
46373
192.168.1.10 - - [07/Dec/2017:15:37:27    -0800] "GET    /docs HTTP/1.1" 200 4140.
The system detected an overrun of a stack-based buffer in this application. This overrun could potentially allow a malicious user to gain control of this application.
EXCEPTION_PARAMETER1:    0000000000000007
NTGLOBALFLAG:    0
APPLICATION_VERIFIER_FLAGS:    0
FAULTING_THREAD:    0000000000003208
BUGCHECK_STR:    APPLICATION_FAULT_STACK_BUFFER_OVERRUN_MISSING_GSFRAME_SEHOP
PRIMARY_PROBLEM_CLASS:    STACK_BUFFER_OVERRUN_SEHOP
192.168.1.10 - - [07/Dec/2017:15:35:19    -0800] "GET    /public/accounting
HTTP/1.1" 200 6379
192.168.1.10 - - [07/Dec/2017:15:36:22    -0800] "GET    /docs/bin/main.php 200
46373
192.168.1.10 - - [07/Dec/2017:15:37:27    -0800] "GET    /docs HTTP/1.1" 200 4140.
In this crash analysis done by Instant Online Crash Analysis, we have an overrun of a stack-based buffer in Microsoft Edge. Now, you can correlate this log (the day that the crash occurred) with other information available in Event Viewer (security and application logs) to verify whether there was any suspicious process running that could have potentially gained access to this application. Remember that, in the end, you need to perform data correlation to have more tangible information regarding a specific event and its culprit.
Linux logs
In Linux, there are many logs that you can use to look for security-related information. One of the main ones is auth.log, located under /var/log, which contains all authentication-related events.
Here is an example of this log:
Nov    5 11:17:01 kronos CRON[3359]: pam_unix(cron:session): session opened for user root by (uid=0)
Nov    5 11:17:01 kronos CRON[3359]: pam_unix(cron:session): session closed for user root
Nov    5 11:18:55 kronos gdm-password]: pam_unix(gdm-password:auth): conversation failed
Nov    5 11:18:55 kronos gdm-password]: pam_unix(gdm-password:auth): auth could not identify password for [root]
Nov    5 11:19:03 kronos gdm-password]: gkr-pam: unlocked login keyring
Nov    5 11:39:01 kronos CRON[3449]: pam_unix(cron:session): session opened for user root by (uid=0)
Nov    5 11:39:01 kronos CRON[3449]: pam_unix(cron:session): session closed for user root
Nov    5 11:39:44 kronos gdm-password]: pam_unix(gdm-password:auth): conversation failed
Nov    5 11:39:44 kronos gdm-password]: pam_unix(gdm-password:auth): auth could not identify password for [root]
Nov    5 11:39:55 kronos gdm-password]: gkr-pam: unlocked login keyring
Nov    5 11:44:32 kronos sudo:	root : TTY=pts/0 ; PWD=/root ; USER=root ; COMMAND=/usr/bin/apt-get install smbfs
Nov    5 11:44:32 kronos sudo: pam_unix(sudo:session): session opened for user root by root(uid=0)
Nov    5 11:44:32 kronos sudo: pam_unix(sudo:session): session closed for user root
Nov    5 11:44:45 kronos sudo: root : TTY=pts/0 ; PWD=/root ; USER=root ; COMMAND=/usr/bin/apt-get install cifs-utils
Nov    5 11:46:03 kronos sudo: root : TTY=pts/0 ; PWD=/root ; USER=root ; COMMAND=/bin/mount -t cifs //192.168.1.46/volume_1/temp
Nov    5 11:46:03 kronos sudo: pam_unix(sudo:session): session opened for user root by root(uid=0)
Nov    5 11:46:03 kronos sudo: pam_unix(sudo:session): session closed for user root
When reviewing these logs, make sure to pay attention to events that are calling the user root, mainly because this user shouldn’t be used with such frequency. Notice also the pattern of raising the privilege to root to install tools, which is also what can be considered suspicious if the user was not supposed to do this in the first place. The logs that were shown were collected from a Kali distribution; RedHat and CentOS will store similar information at /var/log/secure. If you want to review only failed login attempts, use the logs from var/log/faillog.
Firewall logs
The firewall log format varies according to the vendor; however, there are some core fields that will be there regardless of the platform. When reviewing the firewall logs, you must focus on primarily answering the following questions:
- Who started the communication (source IP)?
- Where is the destination of that communication (destination IP)?
- What type of application is trying to reach the destination (transport protocol and port)?
- Was the connection allowed or denied by the firewall?
The following code is an example of the Check Point firewall log; in this case, we are hiding the destination IP for privacy purposes:
"Date","Time","Action","FW.Name","Direction","Source","Destination","Bytes","Rules","Protocol" "
datetime=26Nov2017","21:27:02","action=drop","fw_name=Governo","dir=inboun d","src=10.10.10.235","dst=XXX.XXX.XXX.XXX","bytes=48","rule=9","proto=tcp/ http"
"datetime=26Nov2017","21:27:02","action=drop","fw_name=Governo","dir=inboun d","src=10.10.10.200","dst=XXX.XXX.XXX.XXX","bytes=48","rule=9","proto=tcp/ http"
"datetime=26Nov2017","21:27:02","action=drop","fw_name=Governo","dir=inboun d","src=10.10.10.2","dst=XXX.XXX.XXX.XXX","bytes=48","rule=9","proto=tcp/http"
"datetime=26Nov2017","21:27:02","action=drop","fw_name=Governo","dir=inboun d","src=10.10.10.8","dst=XXX.XXX.XXX.XXX","bytes=48","rule=9","proto=tcp/http"
In this example, rule number 9 was the one that processed all these requests and dropped all connection attempts from 10.10.10.8 to a specific destination. Now, using the same reading skills, let’s review a NetScreen firewall log:
192.168.1.10 - - [07/Dec/2017:15:35:19    -0800] "GET    /public/accounting
HTTP/1.1" 200 6379
192.168.1.10 - - [07/Dec/2017:15:36:22    -0800] "GET    /docs/bin/main.php 200
46373
192.168.1.10 - - [07/Dec/2017:15:37:27    -0800] "GET    /docs HTTP/1.1" 200 4140.
One important difference between the Check Point and the NetScreen firewall logs is how they log information about the transport protocol. In the Check Point log, you will see that the proto field contains the transport protocol and the application (in the above case, HTTP). The NetScreen log shows similar information in the service and proto fields. As you can see, there are small changes, but the reality is that once you are comfortable reading a firewall log from one vendor, others will be easier to understand.
You can also use a Linux machine as a firewall by leveraging iptables. Here is an example of what the iptables.log looks like:
192.168.1.10 - - [07/Dec/2017:15:35:19    -0800] "GET    /public/accounting
HTTP/1.1" 200 6379
192.168.1.10 - - [07/Dec/2017:15:36:22    -0800] "GET    /docs/bin/main.php 200
46373
192.168.1.10 - - [07/Dec/2017:15:37:27    -0800] "GET    /docs HTTP/1.1" 200 4140.
If you need to review Windows Firewall, look for the pfirewall.log log file at C:WindowsSystem32LogFilesFirewall. This log has the following format:
#Version: 1.5
#Software: Microsoft Windows Firewall #Time Format: Local
#Fields: date time action protocol src-ip dst-ip src-port dst-port size tcpflags tcpsyn tcpack tcpwin icmptype icmpcode info path
192.168.1.10 - - [07/Dec/2017:15:35:19    -0800] "GET    /public/accounting
HTTP/1.1" 200 6379
192.168.1.10 - - [07/Dec/2017:15:36:22    -0800] "GET    /docs/bin/main.php. 200
46373
192.168.1.10 - - [07/Dec/2017:15:37:27    -0800] "GET    /docs HTTP/1.1" 200 4140.
While firewall logs are a great place to gather information about incoming and outgoing traffic, web server logs can also provide valuable insight into user activity.
Web server logs
When reviewing web server logs, pay particular attention to the web servers that have web applications interacting with SQL databases.
On a Windows server hosting one site, the IIS web server log files are located at WINDOWSsystem32LogFilesW3SVC1 and they are .log files that can be opened using Notepad. You can also use Excel or Microsoft Log Parser to open this file and perform basic queries.
You can download Log Parser from https://www.microsoft.com/en-us/download/details.aspx?id=24659.
When reviewing the IIS log, pay close attention to the cs-uri-query and sc-status fields. These fields will show details about the HTTP requests that were performed. If you use Log Parser, you can perform a query against the log file to quickly identify whether the system experienced a SQL injection attack. Here is an example:
logparser.exe -i:iisw3c -o:Datagrid -rtp:100 "select date, time, c-ip, cs- uri-stem, cs-uri-query, time-taken, sc-status from C:wwwlogsW3SVCXXXexTEST*.log where cs-uri-query like '%CAST%'".
Here is an example of a potential output with the keyword CAST located in the cs-uri-query field:
192.168.1.10 - - [07/Dec/2017:15:35:19    -0800] "GET    /public/accounting
HTTP/1.1" 200 6379
192.168.1.10 - - [07/Dec/2017:15:36:22    -0800] "GET    /docs/bin/main.php 200
46373
192.168.1.10 - - [07/Dec/2017:15:37:27    -0800] "GET    /docs HTTP/1.1" 200 4140.
The keyword CAST was used because this is a SQL function that converts an expression from one datatype to another datatype and, if the conversion fails, it returns an error. The fact that this function was called from the URL is what raises the flag of suspicious activity. Notice that, in this case, the error code was 500 (internal server error); in other words, the server was not able to fulfill the request. When you see this type of activity in your IIS log, you should take action to enhance your protection on this web server; one alternative is to add a WAF.
If you are reviewing an Apache log file, the access log file is located at /var/log/apache2/access.log and the format is also very simple to read, as you can see in the following example:
192.168.1.10 - - [07/Dec/2017:15:35:19    -0800]    "GET    /public/accounting
HTTP/1.1" 200 6379
192.168.1.10 - - [07/Dec/2017:15:36:22    -0800]    "GET    /docs/bin/main.php 200
46373
192.168.1.10 - - [07/Dec/2017:15:37:27    -0800]    "GET    /docs HTTP/1.1" 200 4140
If you are looking for a particular record, you can also use the cat command in Linux, as follows:
#cat /var/log/apache2/access.log | grep -E "CAST"
Another alternative is to use the apache-scalp tool, which you can download from https://code.google.com/archive/p/apache-scalp.
Amazon Web Services (AWS) logs
When you have resources located on Amazon Web Services (AWS), and you need to audit the overall activity of the platform, you need to enable AWS CloudTrail. When you enable this feature, all activities that are occurring in your AWS account will be recorded in a CloudTrail event.
These events are searchable and are kept for 90 days in your AWS account. Here you have an example of a trail:
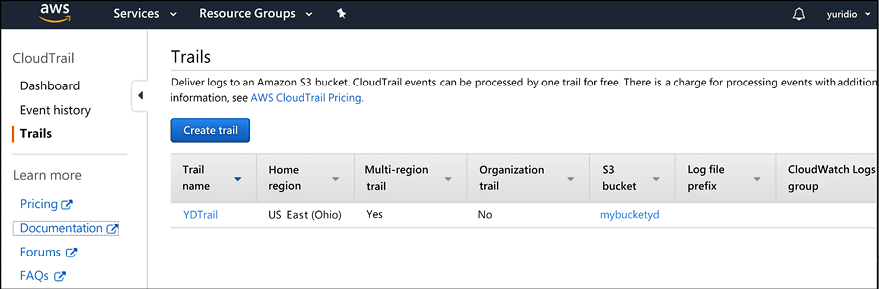
Figure 17.3: Trails shown in AWS
If you click Event history, in the left navigation, you can see the list of events that were created. The list below has interesting events, including the deletion of a volume and the creation of a new role:
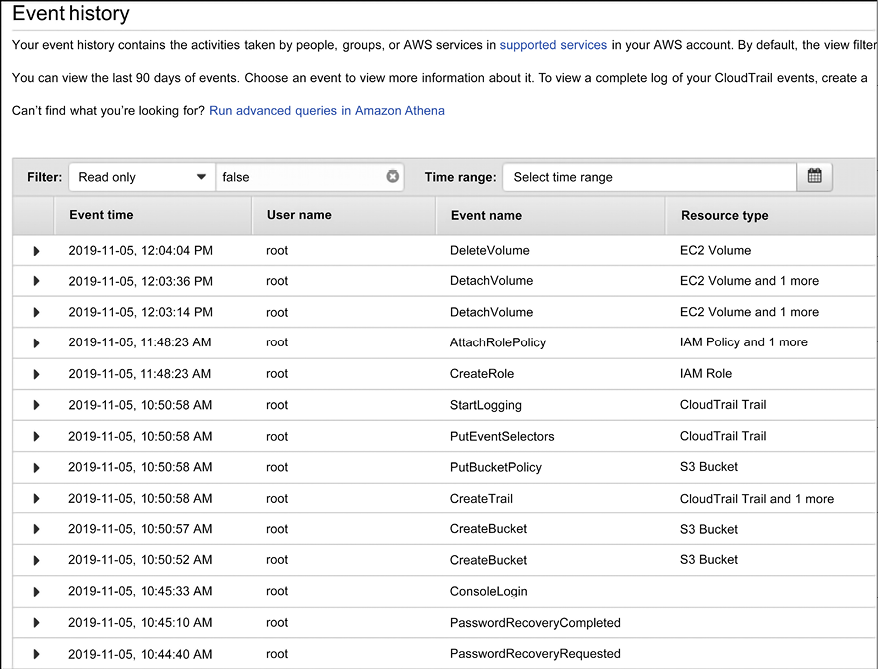
Figure 17.4: Event history in AWS
This is a comprehensive list of all events that were tracked. You can click on each one of those events to obtain more detailed information about it, as shown below:
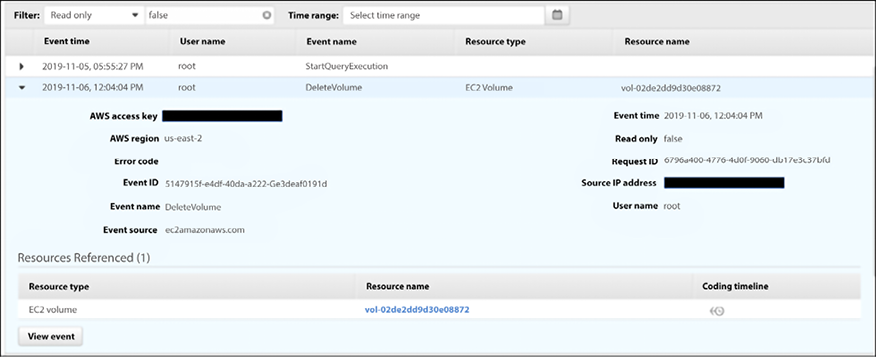
Figure 17.5: Specific event information when clicking on one of the events listed in AWS
If you want to see the raw JSON file, you can click on the View event button, and you will have access to it.
Accessing AWS logs from Microsoft Sentinel
If you are using Microsoft Sentinel as your SIEM platform, you can use the Amazon Web Services Data Connector available in Microsoft Sentinel to stream the following logs to the Microsoft Sentinel workspace:
- Amazon Virtual Private Cloud (VPC) - VPC Flow Logs
- Amazon GuardDuty - Findings
- AWS CloudTrail - Management and data events
Once the connector is configured, it will show a status similar to the screenshot below:
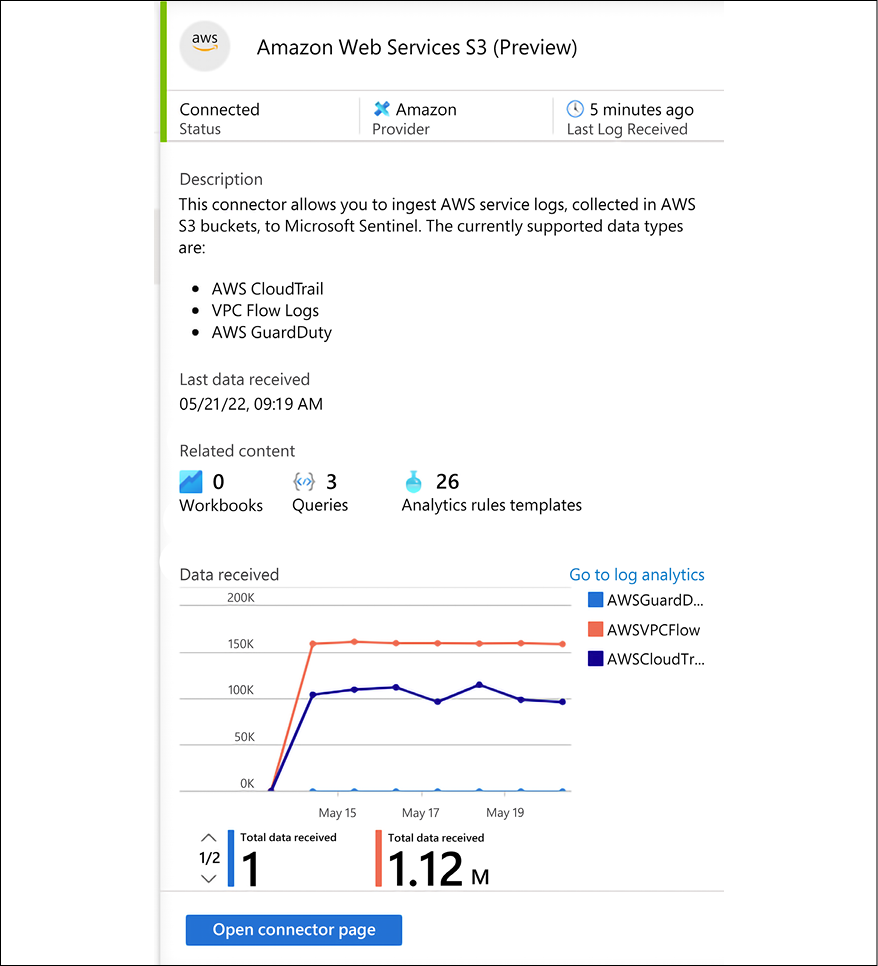
Figure 17.6: AWS connector status in Microsoft Sentinel
For more information on how to configure that, visit: https://docs.microsoft.com/en-us/azure/sentinel/connect-aws.
After finishing the configuration, you can start investigating your AWS CloudTrail log using Log Analytics KQL (Kusto Query Language). For example, the query below will list the user creation events summarized by region:
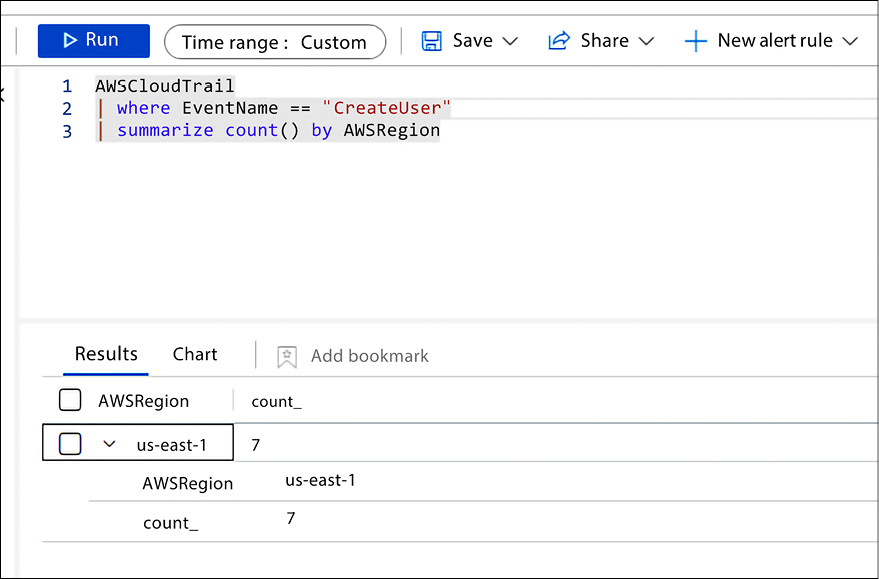
Figure 17.7: KQL query retrieving data ingested from AWS CloudTrail events
When investigating AWS CloudTrail events, it is important to understand the different event types and what they represent. For a comprehensive list of events, visit https://cybersecurity.att.com/documentation/usm-anywhere/user-guide/events/cloudtrail-events-rules.htm.
Azure Activity logs
Microsoft Azure also has platform logging that enables you to visualize subscription-level events that have occurred in Azure. These events include a range of data, from Azure Resource Manager (ARM) operational data to updates on Service Health events. These logs are also stored for 90 days by default, and this log is enabled by default.
To access the Azure Activity log, go to Azure Portal; in the search box, type Activity, and once you see the Activity log icon, click on it. The result may vary, but you should see some activities similar to the sample screen that follows:

Figure 17.8: A sample of the Azure Activity log
You can expand these activities to obtain more information about each action, and you can also retrieve the raw JSON data with all the details about the activity.
Accessing Azure Activity logs from Microsoft Sentinel
If you are using Microsoft Sentinel as your SIEM platform, you can use the native Azure Activity log connector to ingest data from your Azure platform. Once the connector is configured, the status will appear similar to the sample screenshot that follows:
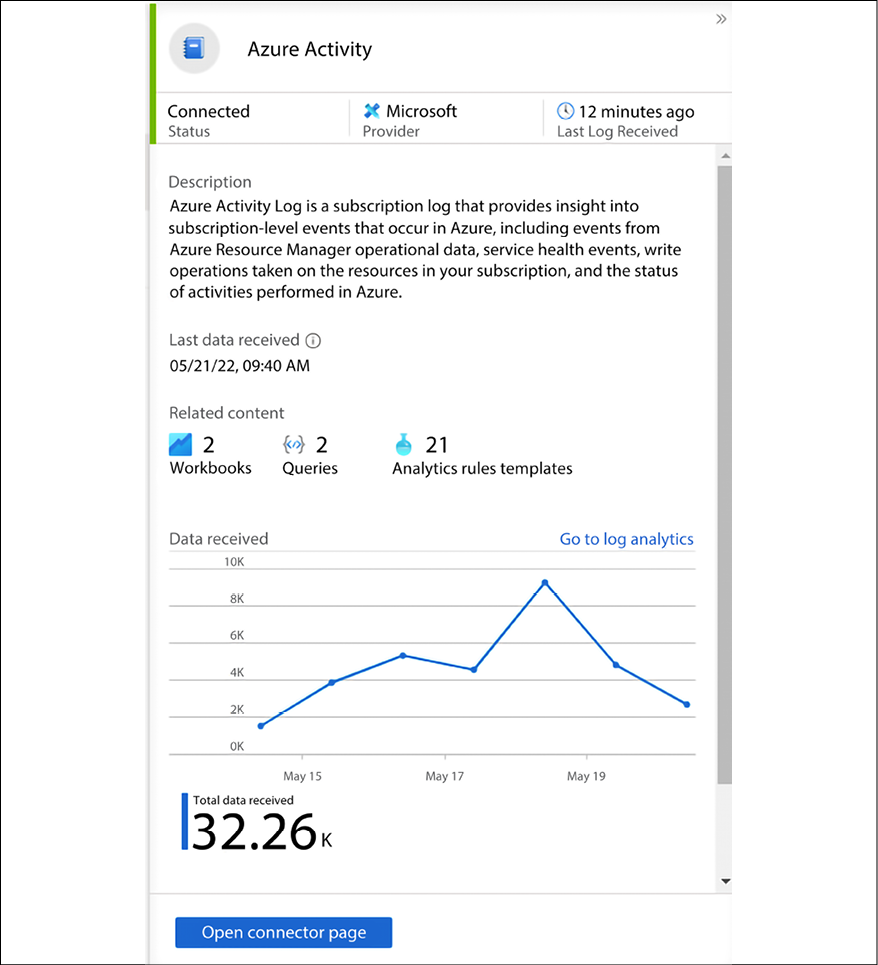
Figure 17.9: Azure Activity status in Microsoft Sentinel
For more information on how to configure this, read the following article: https://docs.microsoft.com/en-us/azure/sentinel/connect-azure-activity.
After finishing the configuration, you can start investigating your Azure Activity logs using Log Analytics KQL.
For example, the query below will list the results for activities where the operation name is “Create role assignment” and it succeeded in performing this operation:
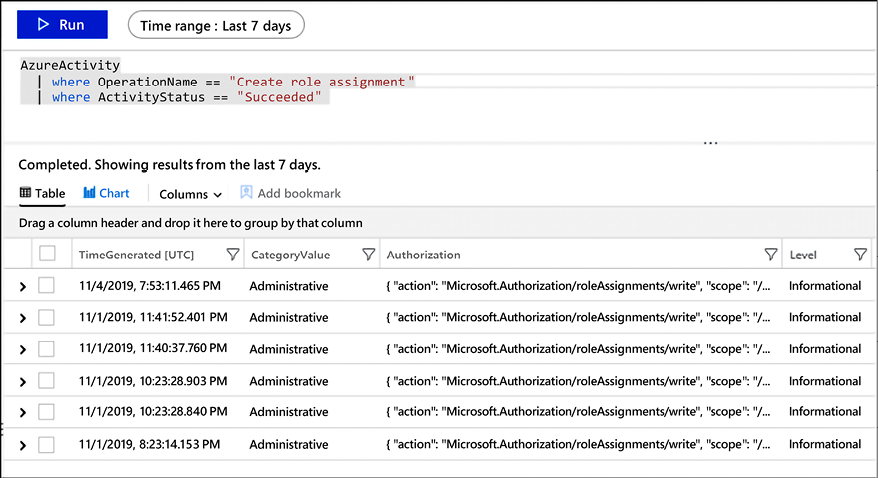
Figure 17.10: Results for a query for activities with the operation name “Create role assignment”
At this point, it is clear that leveraging Microsoft Sentinel as your cloud-based SIEM solution can facilitate not only the ingestion of multiple data sources but also the data visualization in a single dashboard. You can also use the Microsoft Sentinel GitHub repository with sample queries for threat hunting at https://github.com/Azure/Azure-Sentinel/tree/master/Hunting%20Queries.
Google Cloud Platform Logs
Many organizations are moving towards a multi-cloud environment and Google Cloud Platform (GCP) is another big player that you need to be aware of how to monitor. GCP Cloud Audit Logs enables you to answer the following questions:
- Who did what?
- When was it done?
- Where was it done?
Using Microsoft Sentinel, you can ingest GCP Identity and Access Management (IAM) logs, which can be used to see admin activity (audit logs), which includes “admin write” operations, and Data Access audit logs, which includes “admin read” operations.
Once the connector is configured, the status will appear similar to the sample screenshot that follows:
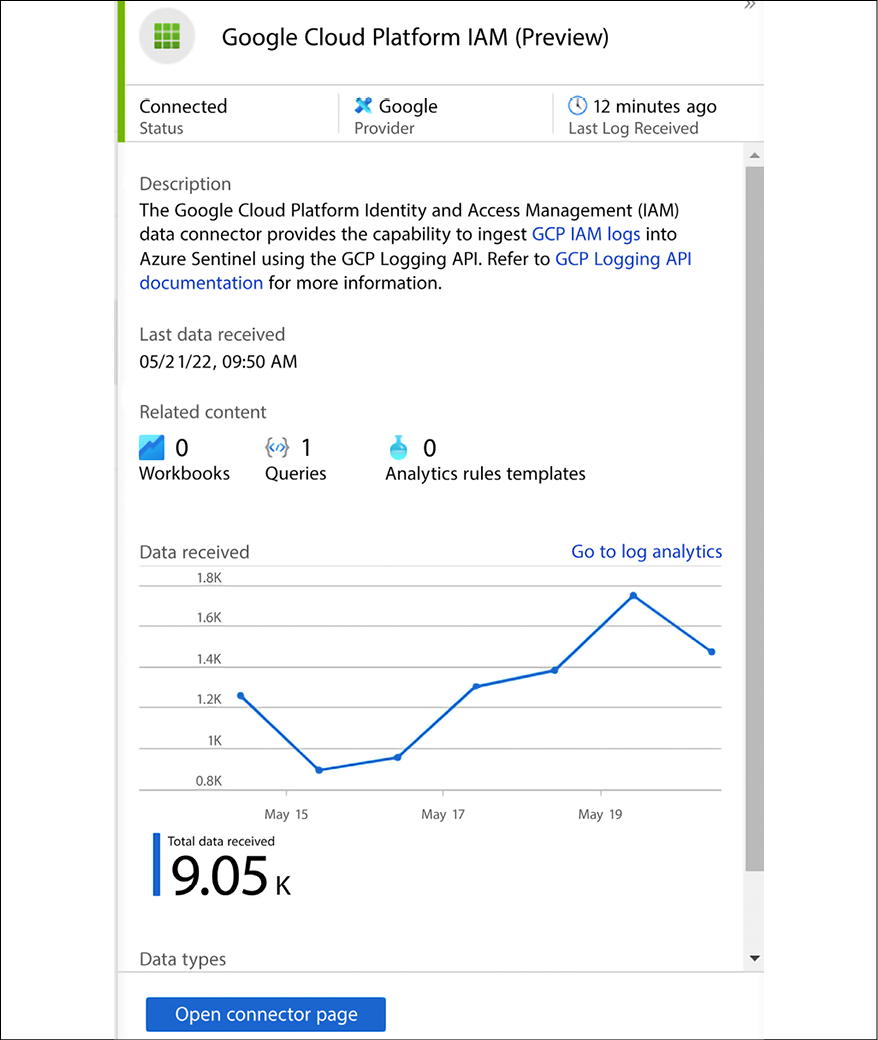
Figure 17.11: GCP IAM connector
Once the connector is configured and ingesting data, you can perform queries using KQL. The example below is checking all GCP IAM logs and filtering the result to show only the following fields: SourceSystem, resource_labels_method_s, resource_labels_service_s, payload_request_audience_s, payload_metadata__type_s, and payload_methodName_s:
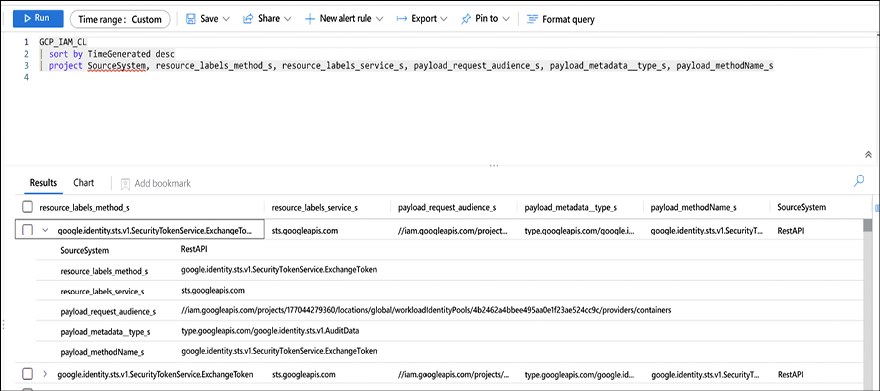
Figure 17.12: GCP IAM query
The rationale behind selecting those fields was to reduce the noise from the many other fields that are available. However, if you want to see everything, you just need to completely remote the “project” line and run the query again.
For more information on GCP IAM logs, visit https://cloud.google.com/iam/docs/audit-logging.
Summary
In this chapter, you learned about the importance of data correlation while reviewing logs in different locations. You also read about relevant security-related logs in Windows and Linux.
Next, you learned how to read firewall logs using Check Point, NetScreen, iptables, and Windows Firewall as examples. You also learned about web server logs, using IIS and Apache as examples. You concluded this chapter by learning more about AWS CloudTrail logs, and how they can be visualized using the AWS dashboard, or Microsoft Sentinel. You also learned about Azure Activity logs and how to visualize this data using Azure Portal and Microsoft Sentinel. Lastly, you learned about GCP IAM logs and how to visualize those using Microsoft Sentinel. As you finish reading this chapter, also keep in mind that, many times, it is not about quantity, but about quality. When the subject is log analysis, this is extremely important. Make sure that you have tools that are able to intelligently ingest and process the data, and when you need to perform manual investigation, you only focus on what it has already filtered.
As you finish reading this chapter, and this book, it’s time to step back and reflect on this cybersecurity journey. It is very important to take the theory that you learned here, aligned with the practical examples that were used throughout this book, and apply it to your environment or to your customer’s environment. While there is no such thing as one size fits all in cybersecurity, the lessons learned here can be used as a foundation for your future work. The threat landscape is changing constantly, and by the time we finished writing this book, a new vulnerability was discovered. Probably, by the time you have finished reading this book, another one has been discovered. It’s for this reason that the foundation of knowledge is so important, as it will assist you in rapidly absorbing new challenges and applying security principles to remediate threats. Stay safe!
References
- iptables: https://help.ubuntu.com/community/IptablesHowTo
- Log Parser: https://logrhythm.com/blog/a-technical-analysis-of-wannacry-ransomware/
- SQL Injection Cheat Sheet: https://www.netsparker.com/blog/web-security/sql-injection-cheat-sheet/
Join our community on Discord
Join our community’s Discord space for discussions with the author and other readers:
