12
Assessing Your Data Literacy Maturity
As you’ve seen throughout this book, data literacy is both an individual construct and an organizational one. There is a common misconception about data literacy and data-informed decision-making that it is mostly focused on learning the right tools and using the right technologies. However, there is much more that is required. Even with the best data strategy and the right tools, it still requires the people who make the decisions to turn the data and insights into good decisions. That process requires a combination of skills and mindsets.
On top of that, organizations are looking to leverage data to drive transformation and modernization to help them get closer and adapt to their customer’s needs, as well as obtain and sustain a competitive advantage. They cannot do this just by having an army of data-literate individuals. The organization requires the right strategy and processes, the right tools, and, of utmost importance, the right culture to support and foster data literacy.
Throughout this book, we have provided details about what makes organizations and individuals more data literate, and how you can increase your data literacy. However, to track your progress, you should start by assessing your current level, and then use that assessment to understand what competencies or programs to focus on next.
This chapter will introduce how you can assess your data literacy skills and then how to interpret the results of that assessment to personalize your educational journey. It will also cover how you can assess the maturity of your organization’s data literacy to learn where and how you can improve.
The following topics will be covered in this chapter:
- Assessing individual data literacy
- Assessing organizational data literacy
Assessing individual data literacy
As per our belief, data literacy is not one-size-fits-all. Not only is it specific to the role that you play with data, but there are also different levels. Therefore, a single data literacy assessment that is used by everyone, regardless of their level or how they interact with data, is not practical or useful. Assessing someone’s skills around preparing data is not relevant to a person whose role with data involves only reviewing insights generated by others.
However, it is very useful for people new to data literacy to have a simple way to assess their foundational data literacy skills and mindsets, regardless of what role they play with data. In this chapter, we will provide you with such an assessment. In the end, we will provide you with a link to a more robust assessment you can complete online if you want to go deeper.
This 22-question self-assessment, shown in Figure 12.1, can be completed in about 15 minutes. For each statement listed, you should score it between 1 and 5 using the following descriptions:
- Strongly disagree with the statement (1 point)
- Slightly disagree with the statement (2 points)
- Neither agree nor disagree with the statement (3 points)
- Slightly agree with the statement (4 points)
- Strongly agree with the statement (5 points)
|
Understand Data This section assesses how well you understand raw data, including its type, classification, and any properties, as well as how well you understand the simple statistical terminology of various descriptive statistics, as discussed in Chapter 2, Unfolding Your Data Journey. | |
|
1 |
Can identify whether data is qualitative or quantitative. |
|
2 |
Can identify what level of measurement (nominal, ordinal, interval, ratio) a given piece of data has. |
|
3 |
Can identify whether data is discrete or continuous. |
|
4 |
Can understand simple statistical terminology and interpret the results of simple descriptive stats such as distributions, frequencies, ranks, percentiles, means, medians, modes, ranges, standard deviation, and interquartile ranges. |
|
5 |
Can apply means, medians, and modes and how to choose the right one based on the data and the question. |
|
6 |
Can identify data security, data privacy, and data ethics concerns related to the data being used. |
|
Interpret Business Requirements This section assesses how well you can understand the question being asked, identify relevant data, and how you can create proper key performance indicators (KPIs), as discussed in Chapter 6, Aligning with Organizational Goals, and Chapter 10, Turning Insights into Decisions. | |
|
7 |
Can transform a business problem into a quantifiable form as an analytics question. |
|
8 |
Can create KPIs that adhere to the characteristics of a KPI. |
|
9 |
Can identify whether data is relevant or not relevant to the decision to be made. |
|
Create and Interpret Data Visualizations This section assesses how well you can both create and interpret data visualizations. Given this is a basic foundational data literacy assessment, the focus is only on basic visualizations, as discussed in Chapter 8, Questioning the Data. | |
|
10 |
Can select and create a basic visualization. |
|
11 |
Can apply appropriate design components of visualizations, including the use of color, annotations, and preattentive attributes. |
|
12 |
Can understand what information a basic visualization is meant to convey. |
|
13 |
Can identify and describe simple patterns and trends in a visualization. |
|
Apply the Human Element of Data Literacy This section assesses how well you understand cognitive bias and its impact on your perspective of data and information, as well as how well you can identify and apply techniques to mitigate the impact of bias, as discussed in Chapter 7. | |
|
14 |
Can describe cognitive biases and how they can impact interpreting data and insights. |
|
15 |
Can apply techniques to help mitigate cognitive bias. |
|
Communicate with Data This section assesses how well you can communicate insights and decisions using data, as discussed in Chapter 10. | |
|
16 |
Can determine the appropriate method and mechanism for communicating the decision. |
|
Mindsets This section assesses whether you have the right mindset to work with data. | |
|
17 |
Willingness to ask additional and clarifying questions. |
|
18 |
Openness to new insights, even if they contradict your previous convictions. |
|
19 |
Willingness to question your contextual knowledge and its influence on the interpretation of the data and insights. |
|
20 |
Openness to the fact that your interpretation of the data and insights may be influenced by cognitive bias. |
|
21 |
Willingness to question the significance of the results for the data or insights presented. |
|
22 |
Objectivity in representing data, including no conscious manipulation to misrepresent the information to consumers. |
|
TOTAL (Add up all the scores from above) | |
Figure 12.1 – Foundational data literacy assessment
You can use the table shown in Figure 12.2 to assess your foundational data literacy based on your total score:
|
Total Score |
Foundational Data Literacy |
|
0-44 |
You need to work on multiple skills and mindsets to increase your foundational data literacy. |
|
45-69 |
You have some foundational data literacy skills, but still have a way to go to become foundationally data literate. |
|
70-94 |
You have a majority of the foundational data literacy skills, but there is still room for growth in a few areas. |
|
95-110 |
You have optimized all the foundational data literate skills. Congratulations! You can now look at the next level and grow from foundational skills to more intermediate and mastery levels. |
Figure 12.2 – Foundational data literacy assessment scoring
If you are looking at areas to improve your data literacy, start by focusing on the statements and categories where you answered below a 4 or 5. Ideally, you should strive to have a score of either 4 or 5 for all of these 25 statements.
If you are interested in either a more comprehensive individual assessment that covers all roles, or if you are looking at going beyond foundational data literacy to more intermediate and advanced levels, then this is available at http://www.kevinhanegan.com/dataLiteracyAssessment.
This assessment leverages the following seven phases of how data is interacted with, from raw data to the decision being made with the data:
- Identifying problems, interpreting business requirements, and framing questions
- Understanding, acquiring, and preparing the relevant data
- Turning data into insights
- Validating the insights
- Transforming insights into decisions
- Communicating decisions
- Evaluating the outcomes of decisions
In this comprehensive assessment, you must select which parts of the data journey relate to your role. Then, you will be asked to complete the assessment for those related competencies out of the total 16 competencies and 37 sub-competencies. You will get results that show you your data literacy level for those competencies, with recommendations on areas you can work on.
Assessing organizational data literacy
There are 2 options for anyone looking to perform an organizational data literacy assessment. We have a simple 16-question assessment that you can use to get an understanding of where your organization is in terms data literacy, and we have a more robust assessment organized into 5 dimensions and 25 subdimensions. This chapter will introduce you to both assessments.
Basic organizational data literacy assessment
This 16-question assessment, shown in Figure 12.3, can be completed in about 10 to 15 minutes. For each statement listed, you should score it between 1 and 5 using the following descriptions:
- Strongly disagree with the statement (1 point)
- Slightly disagree with the statement (2 points)
- Neither agree nor disagree with the statement (3 points)
- Slightly agree with the statement (4 points)
- Strongly agree with the statement (5 points)
|
Organizational Culture and Strategy This section assesses how well-suited the organizational strategy is to data literacy, including how well it supports a culture of data literacy, as discussed in Chapter 4, Implementing Organizational Data Literacy and Chapter 6, Aligning with Organizational Goals. | |
|
1 |
An executive sponsor exists within the organization for data literacy. |
|
2 |
The majority of the leaders within the organization promote data literacy in their processes, including the ability for employees to openly question and challenge data. |
|
3 |
Your organization has defined and communicated its data and analytics vision and ambitions. |
|
4 |
Leverages KPIs for strategic and departmental goals. |
|
Organizational Processes This section assesses organizational processes that relate to how they use and support data, as discussed in Chapters 4, 7, 9, and 10. | |
|
5 |
Decisions that are communicated include data, visualizations, and insights. |
|
6 |
Decision-making processes that use both data and a human element are present within the organization. |
|
7 |
The organization has processes and resources in place to support data security and data privacy. |
|
8 |
The organization has processes and resources in place to monitor and improve data quality. |
|
9 |
The organization has processes and education in place to foster the ethical handling of data. |
|
Data and Analytics This section assesses how the organization uses and provides access to data and analytics, as discussed in Chapters 2, 4, and 5. | |
|
10 |
Data is accessible to the majority of the organization to use in a self-service manner. |
|
11 |
The organization has an established data strategy, including data management and data governance. |
|
12 |
The organization leverages more than just descriptive analytics (including diagnostic, predictive, and prescriptive). |
|
13 |
Data and analytics are embedded into the daily operations of the organization. |
|
Tools and Technology This section assesses the organization’s portfolio of tools and technology to support data literacy. | |
|
14 |
The organization invests in tools and technology that support the data journey and makes it easier for decision-makers to leverage data. |
|
15 |
The organization invests in technical integrations that bring the data and analytics to the right users within their work environment with minimal manual intervention (this includes mashups and embedded dashboards and analytics, alerts and notifications, and tools to integrate the data with the analytics). |
|
Knowledge and Learning Programs This session assesses the organization’s approach to how it educates, upskills, and supports its employees on their data literacy journey, as discussed in Chapter 4, Implementing Organizational Data Literacy. | |
|
16 |
The organization provides support in the form of training, coaching, or community discussions so that employees can upskill on data literacy, as well as the time for employees to take advantage of the support. |
|
TOTAL (Add up all the scores from above) | |
Figure 12.3 – Basic organizational data literacy assessment
You can use the table shown in Figure 12.4 to assess your organization’s data literacy based on your total score:
|
Total Score |
Organizational Data Literacy |
|
16-32 |
Immature. Your organization does not have a lot of focus on data literacy. |
|
33-44 |
Developing. Your organization has some areas that support organizational data literacy but it still has a long way to go to maximize the value data literacy can provide to an organization. |
|
45-69 |
Managed. Your organization sees the value in data literacy and has a focus on some key areas of organizational data literacy, but there are a few additional focus areas that can make a difference. |
|
70-80 |
Mature. Your organization ranks as a fully mature data-literate organization that has a focus on just about all of the key areas of organizational data literacy. |
Figure 12.4 – Basic organizational data literacy assessment scoring
If you are looking at areas to improve your organizational data literacy, start by focusing on the categories or statements where you answered below a 4 or 5. Ideally, you should strive to have a score of either 4 or 5 in all of these 10 statements.
If you are looking for a more robust organizational data literacy assessment that can highlight more specific strengths and weaknesses, along with recommendations, you can use the assessment covered in the next section.
Robust organizational data literacy maturity assessment
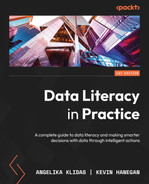
Our more robust organizational data literacy assessment will assess your organization’s maturity with data literacy initiatives in 5 dimensions and 25 total subdimensions.
The list of subdimensions can be seen in Figure 12.5:
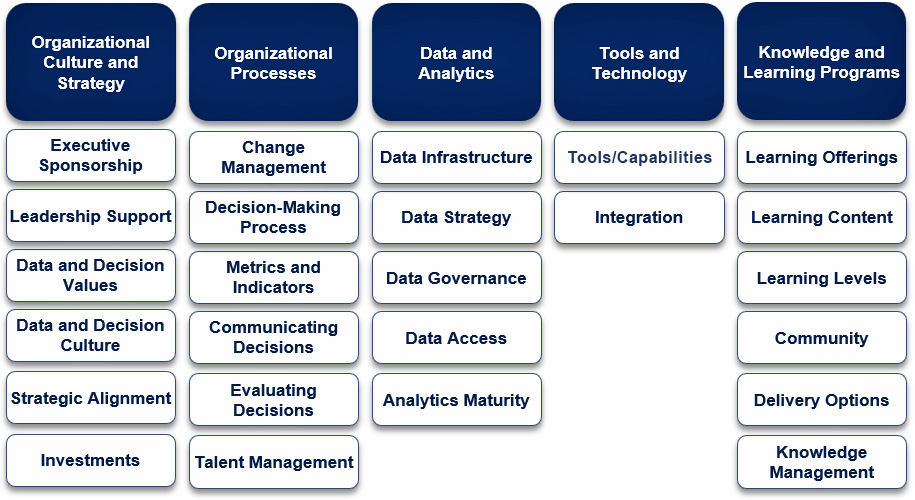
Figure 12.5 – Organizational data literacy dimensions and subdimensions
Ideally, the assessment would be filled out by someone in the organization with a good overview of the organization’s culture and strategy, processes, data and analytics, metrics, skills, technology, data-driven culture, leadership, strategy, execution (of processes), analytical integration, analytical empowerment of employees, and education programs.
It is highly likely, especially in large organizations, that a single person may not know enough of all the dimensions to complete the assessment themselves. In these situations, it is OK to split the assessment up so that multiple resources are involved in filling it out. For example, maybe the chief data officer fills out the sections on data and analytics, maybe the chief information officer fills out the sections on tools and technology, and maybe a leader in education fills out the sections on knowledge and learning programs. Another way to split up the assessment would be to have a single individual or team responsible for the entire assessment, but rather than answering the questions themselves, they conduct interviews and perform audits and gather information to properly complete the assessment.
Let’s move on to the actual assessment, which is organized by dimensions. The assessment is provided in this chapter but can also be taken online at http://www.kevinhanegan.com/maturityAssessment.
Organizational culture and strategy
There are six subdimensions within the organizational culture and strategy dimension:
|
Executive Sponsorship An executive sponsor is critical to an organization’s data and literacy maturity. Three of their main tasks are active and visible participation, communicating support and the importance of data literacy, and building a coalition. Select the number that best represents the status of the executive sponsorship of data literacy in your organization:
| |
|
Score | |
|
Leadership Support Beyond the executive sponsor, there needs to be buy-in and support from other leaders, including actively using data to make decisions. Select the number that best represents the status of the leadership support of data literacy in your organization:
| |
|
Score | |
|
Organizational Values Organizational values guide your business decisions. Three organizational values specific to data literacy organizations are as follows:
Select the number that best represents the status of the organizational values of data literacy in your organization:
| |
|
Score | |
|
Data and Decision Culture Culture is the way values are implemented in businesses. The following characteristics apply the data and decision culture for a data-literate organization:
Select the number that best represents the status of the data and decision culture at your organization.
| |
|
Score | |
|
Strategic Alignment The following characteristics are true for data-literate organizations in terms of the strategic alignment of data literacy:
Select the number that best represents the status of the data and decision culture in your organization:
| |
|
Score | |
|
Investment Data-literate organizations don’t just talk about the importance of data and analytics and data literacy – they action it with investments to support those initiatives. Select the number that best represents the investments for data literacy in your organization:
| |
|
Score | |
Assessment score for organizational culture and strategy
Add up the total number of points for your responses across all six subdimensions and calculate the average score for this dimension, as shown in Figure 12.6. If you decided to get multiple people to complete the same sections of the assessment, calculate the average score:
|
1 |
Executive Sponsorship |
1-4 |
|
2 |
Leadership Support |
1-4 |
|
3 |
Data and Decision Values |
1-4 |
|
4 |
Data and Decision Culture |
1-4 |
|
5 |
Strategic Alignment |
1-4 |
|
6 |
Investments |
1-4 |
|
Total Dimension Score (Add all scores and enter total) | ||
|
Average total (Divide the “Total Dimension Score” by 6) | ||
Figure 12.6 – Organizational culture and strategy scoring
Organizational processes
There are six subdimensions within the organizational processes dimension:
|
Change Management As we mentioned earlier in this book, the biggest obstacles and adoption barriers that organizations face when they try to become data-literate are managerial and cultural. Both of these require strong change management. Select the number that best represents the change management in your organization:
| |
|
Score | |
|
Decision-Making Process An organization is only truly data literate if it can use data to influence and inform decisions. This requires a decision-making process. Select the number that best represents the decision-making process in your organization:
| |
|
Score | |
|
Metrics and Indicators Data-literate organizations leverage data everywhere, including running the business based on metrics and KPIs. Select the number that best represents the status of the metrics and indicators in your organization:
| |
|
Score | |
|
Communicating Decisions Data-literate organizations are highly skilled in communicating data and insights. Select the number that best represents how your organization communicates with data:
| |
|
Score | |
|
Evaluating Decisions Data-literate organizations have processes to evaluate and learn from decisions after they are made. The following characteristics apply to how data-literate organizations evaluate decisions:
Select the number that best represents the status of evaluating decisions in your organization:
| |
|
Score | |
|
Talent Management Data-literate organizations properly manage their organization’s talent as it relates to data literacy. Less focus is put on the specific job and role, and more focus is put on the relevant competencies and skills. The following characteristics apply to how data-literate organizations think about talent management:
Select the number that best represents the status of evaluating decisions in your organization:
| |
|
Score | |
Assessment score for organizational processes
Add up the total number of points for your responses across all six subdimensions and calculate the average score for this dimension, as shown in Figure 12.7:
|
Dimension: Organizational Processes | ||
|
1 |
Change Management |
1-4 |
|
2 |
Decision-Making Process |
1-4 |
|
3 |
Metrics and Indicators |
1-4 |
|
4 |
Communicating Decisions |
1-4 |
|
5 |
Evaluating Decisions |
1-4 |
|
6 |
Talent Management |
1-4 |
|
Total Dimension Score (Add all scores and enter total) | ||
|
Average total (Divide the “Total Dimension Score” by 6) | ||
Figure 12.7 – Organizational process scoring
Data and analytics
There are five subdimensions within the data and analytics dimension:
|
Data Infrastructure Data-literate organizations require a proper data infrastructure to be able to process, analyze, and act on data. Select the number that best represents the data infrastructure in your organization:
| |
|
Score | |
|
Data Strategy Data-literate organizations require a solid data strategy to define how they manage data as a strategic asset. Select the number that best represents the data strategy in your organization:
| |
|
Score | |
|
Data Governance Data-literate organizations require an effective data governance strategy to ensure the data is usable and protected so that it is trusted. Select the number that best represents the data governance in your organization:
| |
|
Score | |
|
Data Access/Data Democratization The following characteristics apply to how employees within data-literate organizations access data:
Select the number that best represents the status of data access in your organization:
| |
|
Score | |
|
Analytics Maturity Data-literate organizations leverage the full range of analytic capabilities to help come up with insights. These range from more simple descriptive analytics to more advanced predictive and prescriptive analytics. Select the number that best represents the analytics maturity in your organization:
| |
|
Score | |
Assessment score for data and analytics
Add up the total number of points for your responses across all five subdimensions and calculate the average score for this dimension, as shown in Figure 12.8:
|
Dimension: Data and Analytics | ||
|
1 |
Data Infrastructure |
1-4 |
|
2 |
Data Strategy |
1-4 |
|
3 |
Data Governance |
1-4 |
|
4 |
Data Access |
1-4 |
|
5 |
Analytics Maturity |
1-4 |
|
Total Dimension Score (Add all scores and enter total) | ||
|
Average total (Divide the “Total Dimension Score” by 5) | ||
Figure 12.8 – Data and analytics scoring
Tools and technologies
There are two subdimensions within the tools and technologies dimension:
|
Tools The following tools and capabilities should exist within a data-literate organization:
Select the number that best represents the status of tools and capabilities in your organization:
| |
|
Score | |
|
Integrations Having the right tools and technology is important, but data-literate organizations require that those tools and technologies be integrated into the workflow of the users. This helps empower employees by bringing the insights to them in an environment they are used to, rather than them having to switch between multiple applications. Select the number that best represents the maturity of technology integrations in your organization:
| |
|
Score | |
Assessment score for tools and technologies
Add up the total number of points for your responses across the two subdimensions and calculate the average score for this dimension, as shown in Figure 12.9:
|
Dimension: Tools and Technologies | ||
|
1 |
Tools and Capabilities |
1-4 |
|
2 |
Integration |
1-4 |
|
Total Dimension Score (Add all scores and enter total) | ||
|
Average total (Divide the “Total Dimension Score” by 2) | ||
Figure 12.9 – Tools and technologies scoring
Knowledge and learning programs
There are six subdimensions within the knowledge and learning programs dimension:
|
Learning Offerings Data-literate organizations provide various learning options for their employees to upskill their data literacy. Select the number that best represents the maturity and diversity of data literacy learning offerings in your organization:
| |
|
Score | |
|
Content Included The following types of learning content should exist within a data-literate organization:
Select the number that best represents the status of data literacy learning content in your organization:
| |
|
Score | |
|
Levels and Assessments A data-literate organization has learning offerings that contain various learning levels to allow individuals to learn what they need at the time (that is, awareness, understanding, application, and expertise). Select the number that best represents the levels of data literacy learning offered in your organization:
| |
|
Score | |
|
Community Data-literate organizations provide mechanisms for employees to get informal learning and ask questions to peers in their moment of need. This can include forums, a coach or mentor, or a community of practice, as examples. Select the number that best represents the support for data literacy communities in your organization:
| |
|
Score | |
|
Learning Delivery Options Data-literate organizations should provide multiple delivery options for employees to consume data-literate training. Those delivery options can include the following:
Select the number that best represents the status of learning delivery options in your organization:
| |
|
Score | |
|
Knowledge Management Practices Data-literate organizations provide a mechanism to capture the insights, knowledge, and wisdom of employees in an organizational knowledge base. Select the number that best represents the maturity of knowledge management in your organization:
| |
|
Score | |
Assessment score for knowledge and learning programs
Add up the total number of points for your responses across all six subdimensions and calculate the average score for this dimension, as shown in Figure 12.10:
|
Dimension: Knowledge and Learning Programs | ||
|
1 |
Learning Offerings |
1-4 |
|
2 |
Learning Content |
1-4 |
|
3 |
Learning Levels |
1-4 |
|
4 |
Community |
1-4 |
|
5 |
Delivery Options |
1-4 |
|
6 |
Knowledge Management |
1-4 |
|
Total Dimension Score (Add all scores and enter total) | ||
|
Average total (Divide the “Total Dimension Score” by 6) | ||
Figure 12.10 – Knowledge and learning programs scoring
Analyzing the maturity score
Once the assessment is completed, the organization can analyze the results. The goal of this step is to identify the most important areas to start working on improving.
In the online assessment, each dimension’s score is calculated on a range from 1 to 10. With a consistent range for each dimension, we can plot them all together in a radar plot, as shown in Figure 12.11, to see where your organization’s data literacy strengths and weaknesses are:

Figure 12.11 – Organizational data literacy assessment results
If you are not using the online assessment and are scoring this manually, just use the average scores from each dimension. As an example, Figure 12.12 shows the scores from a completed manual assessment. Here, you can see the average scores from each dimension listed:
|
Average of the Organizational Culture and Strategy Dimension |
2.0 |
|
Average of the Organizational Process Dimension |
2.66 |
|
Average of the Data and Analytics Dimension |
3.6 |
|
Average of the Tools and Technologies Dimension |
3.0 |
|
Average of the Knowledge and Learning Programs Dimension |
3.8 |
|
Overall Organizational Data Literacy Maturity Score (Take the average of all the dimension averages) |
3.01 |
Figure 12.12 – Sample organizational data literacy assessment scoring
The table displayed in Figure 12.13 shows the maturity level for each dimension calculated from the average score. The same table can be used to show the overall maturity level of the organization if you use the overall average score across all the dimensions:
|
Dimension Average Score |
Maturity Level |
|
1.00 – 1.59 |
Ad Hoc |
|
1.60 – 2.19 |
Developing |
|
2.20 – 2.79 |
Managed |
|
2.80 – 3.39 |
Advanced |
|
3.40 – 4.00 |
Optimized |
Figure 12.13 – Organizational data literacy maturity levels
There is no common answer to the question of what area we should focus on improving first. All of the dimensions that have been assessed are important for organizations. However, we believe it is near impossible to mature in your organizational data literacy without the right strategy, support, and culture, so it makes sense to look for opportunities to increase your score in that dimension. Beyond that, the online assessment will give you more specific feedback and recommendations of where to start regarding your areas of improvement based on your scores.
However, if you are scoring the assessment manually and not using the online assessment, you should first focus on which dimensions are lower than the others. Figure 12.14 shows the results of the sample assessment:
Figure 12.14 – Organizational Data Literacy dimension scores
The results highlight that Organizational Culture and Strategy is the lowest scoring dimension with a score of 2.0 on the higher end of the results compared to Knowledge and Learning Programs, which has a score of 3.8. In this case, the recommendation would be to drill down into the Organizational Culture and Strategy dimension and start to make improvements there first.
To drill down into a dimension, you should look at each subdimension’s score compared to the average across all the scores. For example, if you have identified you need to improve on your Organizational Culture and Strategy dimension, you can use the chart shown in Figure 12.15 to visualize your scores for each of its six subdimensions and identify which you should prioritize first:

Figure 12.15 – Organizational Culture and Strategy Subdimension Scores
Addressing the subdimensions with the lowest scores would make the most sense as a place to start. Those subdimensions most likely need immediate attention. Once those subdimensions have been selected, the organization should meet and kick off a plan to address the weaknesses. In the example shown in Figure 12.15, the lowest subdimensions are Leadership Support and Data and Decision Culture.
Summary
In this chapter, we learned how to assess both the data literacy maturity of an organization as well as an individual’s data literacy competency level. For both, we provided a very simple assessment that should take no longer than 15 minutes, along with more robust assessments that will give you more specifics on your gaps and where to focus next. Ideally, you will take the assessments initially so that you have a baseline and then retake the assessment at future intervals – for example, every 6 months or every year – to see how well you are closing the gaps.
In the next and final chapter, we will focus on how you should approach data and analytics projects within your organization, as well as what risks to look out for.