4
Implementing Organizational Data Literacy
Is your organization a data-literate organization? Does it leverage insights to make decisions? Does it tie any analytics projects and initiatives to strategic goals? Does it blend data with multiple human factors, such as a motivation to ask questions or an openness to new ideas and perspectives? Is it able to be agile and scale to all employees when a new decision needs to be made leveraging data? If you cannot answer yes to all these questions, you are not alone. However, you may strive to be able to answer yes to all these at some point in the future. When you can answer yes to all of these, your organization systematically and systemically utilizes data and analytics to make the best possible decisions across all levels.
Much of this book is devoted to individual data literacy, but for organizations to be data literate, the skills and behaviors of employees are just one dimension. In addition, they need to have the right tools and technology, the right organizational strategy and processes, and the right culture to foster data literacy.
In this chapter, we will discuss all of these dimensions as well as the framework for rolling out an organization-wide data literacy program. We will cover the following main topics:
- Implementing organizational data literacy
- Planning the data literacy vision
- Communicating the data literacy vision
- Developing a data-literate culture
- Creating a data literacy educational program
- Measuring success
- Celebrating successes
By the end of the chapter, you will have a good idea of what organizational data literacy is and what are the various components that are required to achieve it. You will also learn tips and strategies for how you can roll out data literacy initiatives within your organization.
Implementing organizational data literacy
Many organizations desire to become more data literate; however, they do not know how and where to start or what to focus on. While organizations may all be at different stages of data literacy, all organizations should leverage a consistent framework that provides steps and best practices to maximize their data literacy maturity.
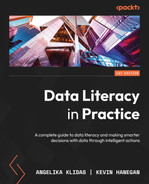
Figure 4.1 shows such a framework for implementing organizational data literacy:
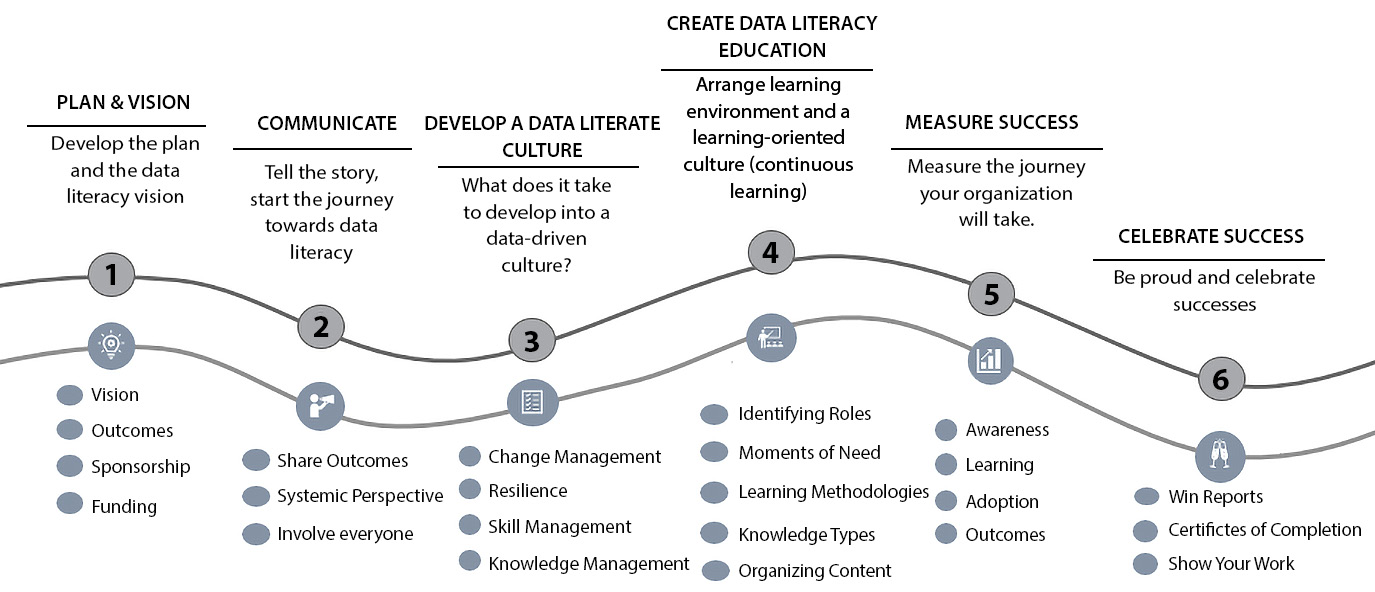
Figure 4.1 – Implementing organizational data literacy
Organizations must have a plan and vision for data literacy, which they then communicate to all employees. They will need to develop and foster a culture that embraces data literacy and data-informed decisions. They will need to provide employees with access to various learning content specific to data literacy. Along their journey, they will need to make sure they benchmark and measure progress toward their vision and celebrate successes along the way. The remainder of this chapter is focused on explaining these six dimensions of the framework in much more detail.
Planning the data literacy vision
Before starting an organizational transformation to become data literate, you need to first establish an overall data literacy strategy and vision for the organization. That strategy and vision need to align with the employee culture. From there, you need to establish specific objectives that start at the top of an organization and cascade down. For example, an objective could be to back all decisions with data, or another one could be to be able to trust the organization’s data. After your objectives are established, you need to identify specific activities that will drive you toward attaining the vision and objectives.
To help you start thinking about what your organizational data literacy vision should be, the following list identifies a few common traits of data-literate organizations:
- Data and data-informed decision-making are part of an organizational strategy
Leveraging data to make informed decisions is part of an organization’s strategy. This typically includes organizations seeing data as an organizational asset, having specific data literacy objectives at the organizational level, and having executive sponsorship and leadership support.
- Promote and employ a data-literate culture
A data-literate culture allows all employees to obtain trusted and actionable insights that they can use to make decisions. This is done by implementing the right governance and processes with data, implementing the right tools and technology, enabling employees to find and access relevant data and insights in a self-service manner, and empowering employees to use data and insights to make decisions. These all have to be wrapped by a culture that supports this. We will discuss specific aspects of a data-literate culture later on in this chapter, in the Developing a data-literate culture section.
- Leaders believe in the value of data literacy
Leaders should evangelize data as a strategic and long-term asset, leveraged across all parts of the business. They should also lead by example. If your leaders are not working with discovered insights, and don’t ask critical questions of them and the underlying data, then they can’t and won’t ask the same from their employees.
- Data is both trustworthy and trusted
Data is centralized, and a corporate-wide data strategy is in place, but departments have data ownership to manage the data quality. Data is seen as a strategic asset, and the organization considers data quality as a strategic initiative. This means it is discussed on a regular basis at the executive level.
- Democratization of data
Making better decisions with data requires everyone in the organization that needs to have access to the data to have access, as well as the right tools and skills to properly use it. This does not mean everyone has access to all data. Individuals should only have access to the data relevant to their needs.
- Data is embedded in every decision, interaction, and process
A key principle of a data-literate culture is that organizations do not use data to justify a decision they have already made; rather, they use it to gain new insights. Using data analytics by itself is not going to move the needle. The desired outcome is to use analytics to find insights to make better decisions. Everyone is expected to make decisions informed by data.
- Invest in data literacy training for everyone
Data literacy education should be provided and even mandated for all employees within the organization. It is important to allow employees dedicated time during work to take data literacy training. The training cannot just be self-paced, one-size-fits-all generic data courses either. It should include mixed and blended learning, including videos, classroom training, self-study, and much more. This topic is discussed in greater detail later on in this chapter in the Creating a data literacy educational program section.
- Invest and roll out the right tools and technology to support data
After the organizational strategy and processes that support data literacy are established, organizations should select the right tools and technologies to meet the needs of everyone working with data. This could include data storage, data integration, data mining, data cataloging, analytics, and advanced analytics tools and technologies.
- Support a test-and-learn environment for continuous improvement
An organization that embraces a growth mindset will see failure as a learning opportunity. After all, the sooner you learn about what is not working, the sooner you learn about what is working. Organizations need to embrace this style and culture and create a space for employees to have the freedom to fail as long as they learn something from it.
Once you have defined your strategy and objectives and identified traits, as in the preceding examples, you will need to turn some of these into key performance indicators (KPIs), with targets to allow you to measure success. Here are a couple of example targets we have seen implemented at various organizations:
- Over 85% of the organization attends at least level 1 awareness training on data literacy in 1 year
- The organization delivers at least 8 data literacy workshops to its employees in 1 year (2 per quarter)
- 95% of all employees have data literacy and data-informed decision-making skills listed in their individual development plan
- The organization will have two specific companywide meetings in 1 year, with the sole focus on giving updates specific to data, analytics, and data literacy projects
- The organization communicates win reports to all employees per quarter on success related to data literacy
In this section, we have discussed the importance of having a solid data literacy vision. Even if your organization is just starting out on its data literacy journey, it is important to have a vision of where you want to end up with data literacy. Now that you have planned the rollout and established the vision and success criteria, it is time to communicate this to the entire organization via an internal marketing initiative.
Communicating the data literacy vision
In this section, we will focus on how you can internally market and communicate the data literacy vision to the entire organization. The keys to effective internal marketing are focusing on desired outcomes, adopting a systemic perspective, and getting all employees involved in the whole process.
Focusing on desired outcomes
During the planning stage, you have identified what you want the organization to do at a strategic level. Now, you need to go one level deeper and communicate the specific problems you are trying to solve. For example, if the organization tends to make instinct-based decisions, partly because either the data team does not provide the data or the decision makers do not trust the data, then those are the problems that you should communicate you are trying to address. We discuss how to properly question and ensure that you are asking the right questions in detail later, in Chapter 10, Turning Insights into Decisions!.
Adopting a systemic perspective
When implementing a data-literate organization, it is imperative to think systemically and understand how the different parts of the organization work across the data literacy journey. Thinking systemically means being able to understand the bigger picture of everything related to your decision. Let’s consider a simple, non-business example. If you were to bring a new pet home or are considering having another child, thinking systemically means you understand those scenarios do not just affect you but also many other people, including partners, children, other pets, and so on. Not only do you understand that it will affect others, but you understand how it will affect others, including various possible unintended consequences.
In business, a team, an entire organization, or even beyond the organization, an entire supply chain can be considered a system. When discussing decisions that may affect one part of those, thinking systemically will require you to think about how they may affect all parts of those systems.
Back to data literacy, we believe data literacy is a team sport, and this means that decisions and strategies need to be thought of and understood for all groups (all parts of the system). Some organizations will invest lots of time and resources in the creators of analytics, but then completely ignore investing in the consumers of insights generated by the creators.
Getting everyone involved in the whole process
Earlier in the planning stage, we talked about the importance of the democratization of data and ensuring that data is embedded in every decision. To support that, you need to ensure every single employee is both enabled and empowered to use data. To truly enable employees, they first need to understand the value of insights obtained from data and how they can help them achieve their goals. Everyone in the organization needs to think critically about the potential use cases and applications specific to them. Getting everyone involved in the whole process will greatly aid the effectiveness of your internal marketing campaign to communicate the organization’s intent and usage of data literacy. It will also lead to better decisions, as it allows more people to safely access data to analyze, interpret, and apply their perspectives.
This can be accomplished by sharing win reports and other assets that highlight the outcomes and value provided by data to the organization. Introductory workshops and lunch and learn events should be provided for all employees to learn about the benefits of data and how data literacy is the key to unlocking the value within the data for the entire organization. You can highlight how the data helped inform your decision, and potentially even discuss what has happened previously in similar situations when data was not used to make a decision.
Developing a data-literate culture
Technology and data are evolving faster than organizations can evolve their culture to leverage them. While a portion of organizational data literacy is about having the right tools and technologies, those tools and technologies will not have the desired impact unless the organization has the right culture. The heart and soul of a data-literate organization is its culture as it relates to the way it integrates data, insights, decisions, and actions. Many organizations understand the importance of this but have been challenged in transforming their culture to one that supports data literacy and the use of data to make decisions. In this section, we will discuss three required areas to support a data literacy culture: change management, driving resilience, and skill and knowledge management.
Managing change
The biggest obstacles and adoption barriers that organizations face when they try to become data-literate organizations are managerial and cultural. Both of these require strong change management, and that change management requires the organization to continuously adapt its structure, culture, and management capabilities. It also requires the organization to provide the right environment and learning content to properly help employees learn any new skills required for the change to be successful.
For organizations to maximize the value they receive from data, they must drive a change. There are many change management frameworks available that can be used. One we have seen succeed as a method for driving organizational change to support data literacy is the eight-step model created by Harvard Business School professor John Kotter, as depicted in Figure 4.2:
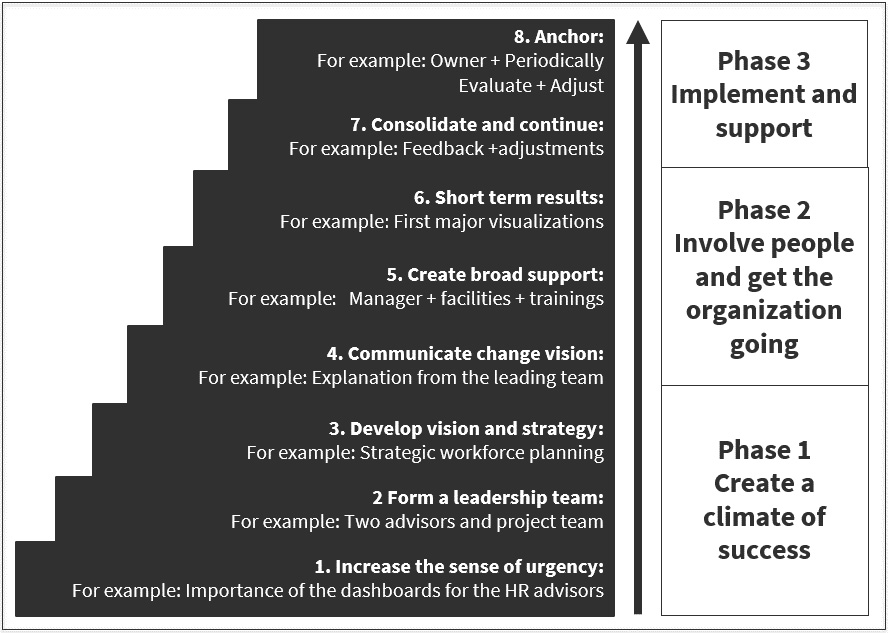
Figure 4.2 – Change management step
Kotter is a leading expert in the field of change management and introduced this eight-step process in his book, Leading Change. Let’s have a look at the process in more detail:
- Create a sense of urgency for the organization. The intent is not to scare employees about what happens if we do not change, but rather to show an open and honest approach to ensuring all employees are aware and involved in the change. This will help build support for the change.
- Form a guiding coalition that garners leadership and visible support from influential individuals. This will help mobilize more stakeholders. Influence may come from positional or informal aspects. Harnessing the power of social influence is a great method to help increase change acceptance. As more people accept the change, this creates a positive spillover effect, which in turn provides more influence on others to accept the change.
- Create a clear vision to ensure that people can understand the purpose of the change and the desired outcomes of the change. It makes the change more palatable and helps reduce the anxiety that emerges naturally from a change process. This should include information such as what got the organization to this point, what is the decision to be made, how important it is, what the time frame is, and what the success criteria are.
- Select the right data and visualizations to communicate, and craft a narrative that helps the audience understand the vision. Ensure your communication reinforces how the vision is directly tied to the purpose of the organization.
- Remove any change barriers. A change will encounter barriers, which could be in the form of policies, procedures, silos within the organization, or a lack of the right skills. You should identify each barrier and then work on a plan to overcome each one.
- Create quick wins. Early success helps minimize change fatigue while reinforcing momentum at the same time. Wins should be frequently and publicly communicated. Quick wins prove that change can happen, no matter how small. This not only reinforces you are on the right track but also helps keep people motivated for the longer change process ahead. People may not stick around till the end to see if it was successful, but they will be more likely to if they get feedback and celebrate wins early and often in the process.
- Build on the change. When sufficient momentum is built and early successes are visible, be relentless with the remaining aspects of the change until the vision is a reality. When people see quick yet incremental progress in their work or their team’s work and that work gets celebrated as wins, they will feel motivated, be more engaged, and, ultimately, more likely to continue with the change.
- Institutionalize the change. The change is not a single event—it’s an ongoing process that needs to be sustainable. It is common for organizations to put a lot of emphasis on a change, and then when the action goes live, move on. In many cases, that will result in everyone going back to their old ways of doing things before the change.
Make sure everything related to the change is updated to be sustainable and ongoing. This includes defining the right performance indicators, as discussed in Chapter 6, Aligning with Organizational Goals, and institutionalizing those into the dashboards and measurement frameworks that are used to run the business.
Driving resilience
Research highlights that about 70% of organizational change initiatives fail. Given the impact of change load on individuals and organizations, and the fact constant change is here to stay, an important organizational strategy should be to not rely on change management alone, but also focus on building and driving a resilient organization. Building resilience will help people be proactively ready for future changes that we know will come.
Resilience refers to our ability to adapt to stress brought on by change and adversity. Not only does resilience allow us to adapt, but it also acts to help us grow and improve as a result of the situation.
Resilience is really hard for us as humans. The human brain developed in a way that it was designed to be attentive to threats. As a result, negative stimuli get more attention and processing. This is true still today. This narrows our minds and promotes less-than-ideal reactions and responses when faced with change. This ends up making us feel overwhelmed, and we resist the change.
In fact, not only do we feel overwhelmed and resist the change, but a few other things happen as a result as well. This is called threat reactivity. Our brain tricks us into overestimating threats, underestimating opportunities, and underestimating resources for dealing with threats and fulfilling opportunities. These are situations that are highly likely to occur during a change.
The good news is that resilience can be learned and increased with specific practice. One common approach to increasing your resiliency is to be very deliberate in identifying your thoughts and behaviors and intentionally trying to modify them. The more we do this, the more practice we get, and our brains will actually adjust to help us reinforce the skill.
Let’s take a look at an example of resilience at both an organizational and an individual level, as seen through the COVID-19 pandemic. This example is also highlighted in Figure 4.3:
Figure 4.3 – Resilience during COVID-19
A resilient organization during COVID-19 needed to support flexibility and adaptability in a changing environment. Consider all the restaurants that had to close their dining rooms to guests during the pandemic. They needed to be both flexible and adaptable to a new business model thrust upon them without any prior notice. Resilient organizations needed to set and model healthy work-life boundaries, including new work times and time off required by employees to support children and family members who were either sick or being homeschooled as a result of the pandemic.
Individual resilience through COVID-19 also required flexibility and adaptability. For example, employees at the restaurants we just mentioned would also need to be flexible and adaptable to their work environment, their work tasks, and their work hours changing as a result of the pandemic.
Individual resilience is increased by the number and quality of connections and healthy relationships. Individuals leaned on their connections, whether they be family or friends or even pets, as well as work groups and social groups, during the pandemic. Finally, individual resilience is increased by having a positive outlook. Having hope that the pandemic would eventually end, and that you would be able to manage through it, helped many individuals throughout that tough time, and others.
Managing the organization’s skills and knowledge
A key component of a data-literate organization is its ability to properly manage the organization’s skills and knowledge. This sounds pretty straightforward, but it is actually an evolution of how organizations typically focus on their employees. Let’s go back to the early 1990s when the field of talent management first emerged. The focus was on managing employees through what was called the employee journey, or employee life cycle, which started from recruiting and onboarding to performance management, through to ongoing learning and development. In most cases, these departments based their programs on job descriptions, roles, and hierarchies within an organization.
That has worked in the past, but now, with all the technological advancements we are seeing, jobs are evolving fast, and many employees will need reskilling shortly after they are hired to learn the latest skills. Data-literate organizations should shift their focus from job descriptions and academic qualifications to skills and competencies. We discuss skills and competencies in greater detail in Chapter 11, Defining a Data Literacy Competency Framework, but an example would be to focus less on specific job titles and levels, such as data analyst, and focus more on specific skills, such as proficiency in the skill of data mining.
In the past, with a focus on jobs, organizational strategies thought of employees as interchangeable parts of the supply chain. If someone leaves, you need to hire someone else for the same job description. In the new world, data-literate organizations organize their strategies around the idea of skills and competencies to be cultivated. This lends itself to organizational structures that are less siloed where employees can contribute to many parts of the organization, based on the skills and competencies they possess. As an aside, this not only helps foster a data-literate organization, but it also helps with employee engagement and retention, as it puts the employees and their skills and competencies at the center of work, rather than a specific job.
The organizational process of managing skills and competencies focuses on acquiring, training, and utilizing those skills and competencies to build the best data-literate organization. This process involves determining the right skills and competencies required and then evaluating employees against the desired performance levels. We will discuss the specific skills and competencies required across an organization to foster data literacy later on in Chapter 11, Defining a Data Literacy Competency Framework.
Now that we have discussed the importance of data-literate organizations focusing on managing skills and competencies, we can focus on the second part of this strategy, which is how to document and share employees’ knowledge. With every decision that an organization makes, people are leveraging data, along with their experience in the business. This allows them to go from data to information to knowledge and eventually wisdom, commonly referred to as the DIKW pyramid, as shown in Figure 4.4:
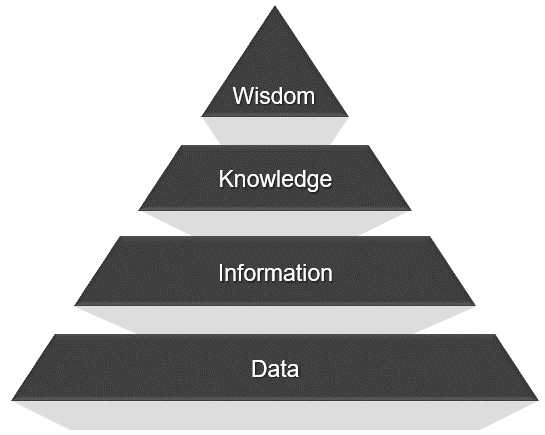
Figure 4.4 – DIKW pyramid
While organizations invest a lot of time and money in strategies and processes for handling their data, they typically do not invest enough time or money in strategies and processes for handling their information and knowledge. In many organizations, those levels are left with the specific individuals who have them and are not stored, codified, or documented, making it incredibly hard for others within the organization to make use of them. This severely impacts the ability of an organization to be fully data literate.
Data-literate organizations need to have a deliberate strategy and set of processes for capturing these higher-order elements such as actionable insights and relevant information and knowledge so that employees can access and use them whenever they need to. The data-informed decision-making process is at the heart of data-literate organizations and is built into their DNA.
Creating a data literacy educational program
In the previous section, we talked about the importance of managing skills and competencies. One key element of this framework is the ability to upskill your employees on these skills and competencies. The specific skills and competencies are discussed later on in Chapter 11, Defining a Data Literacy Competency Framework, but for now, it is important to know that these are a combination of hard skills and soft skills. When most organizations invest in data literacy education and data literacy maturity models, they tend to focus on hard skills. They often talk about capabilities in terms of technology and tools, but they often leave out the necessary soft skills to become fully data literate.
An organization may build many dashboards and reports, but then just hope that the business can use them appropriately. Other times, organizations will put data literacy training in place for their employees, but they make it one size to fit all. Data literacy training needs to be role-based and specific to the organization, its culture, and its processes. In addition, organizations tend to use learning solutions that teach the same level of proficiency, using the same learning approach. Data literacy training needs to be thought of as a journey rather than a single event. You need to learn how to crawl and walk before you can run and master specific competencies. In addition, traditional educational approaches that use formal learning are becoming less and less effective in today’s world. Organizations need to embrace a new approach to learning delivery that meets the needs of today’s employees.
In this section, we will cover eight dimensions to factor in when creating a data literacy educational program:
- Employee roles
- Learning levels
- Moments of need
- Learning methodologies
- Knowledge types
- Learning elements
- Organizing content
- Searching for content
These categories are visually depicted in Figure 4.5:
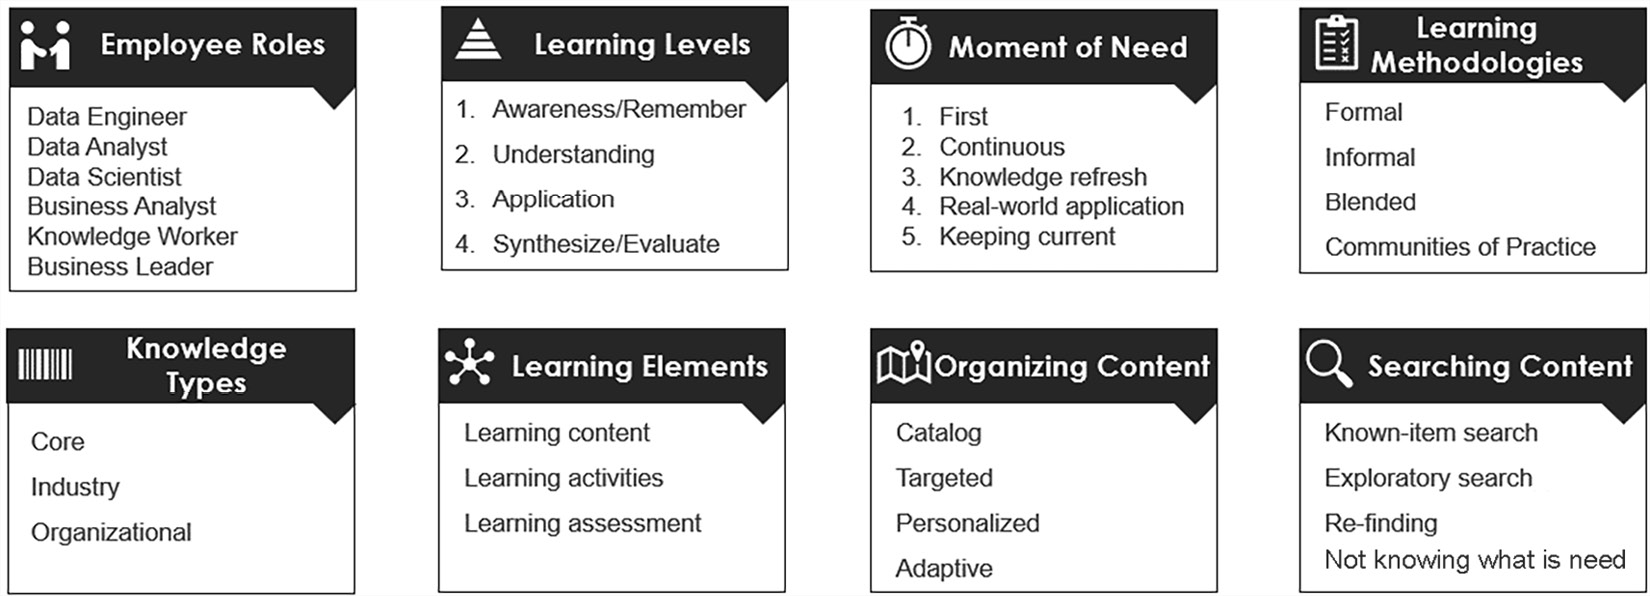
Figure 4.5 – Data literacy educational program dimensions
Let’s take a detailed look at these categories.
Identifying employee roles
Data literacy is not achieved by mastering a uniform set of competencies that applies to everyone. Those that are relevant to each individual can vary significantly depending on how they interact with data and which part of the data process they are involved in. For example, the skills relevant to someone responsible for cleaning and preparing data for analysis are different from those relevant to someone responsible for interpreting the results of the analysis.
Also, remember that data literacy is not just a set of technical skills. There is an equal need and weight for soft skills and business skills. This can be misleading for some technical resources within an organization, as those technical resources may believe they are data literate by default as they are data architects or data analysts. They have the existing technical skills, but maybe they do not have any deep proficiencies in other skills such as communicating with data, challenging assumptions, and mitigating bias, or perhaps they do not have an open mindset to be open to different perspectives.
We segment the roles into six separate roles:
- Business leader
- Knowledge worker
- Business analyst
- Data engineer
- Data analyst
- Data scientist
Every organization may have variations of this, and individuals may do the job of more than one role, but the purpose here is to show the differences at a high level and ensure that your organization provides the right training specific to its roles. The following list describes, at a high level, each of the six roles:
- Business leader: Business leaders are not the ones who will do any data mining or data science work. They are ultimately the ones responsible for any decisions made with data, including the decision itself, communication of the decision, and the change management process that will drive the decision.
- Knowledge worker: Knowledge workers include anyone who has their own insights relevant to their own needs. As you learned in Chapter 1, The Beginning–The Flow of Data everyone works with and analyzes data. Everyone will come up with their own insights, even if it is just for them—for example, analyzing their own performance or where to go on vacation.
- Business analyst: Business analysts interpret the insights they receive from a data analyst or data scientist, applying their domain knowledge to ultimately make a data-informed decision or a business recommendation.
- Data engineer: Data engineers design, develop, and maintain any architecture or device that stores, prepares, and analyzes large amounts of data. Many times, their job involves data modeling and integration tasks, and tasks related to improving data quality. Typically, the output from a data engineer is quality, clean, analytics-ready data that other parts of the organization can analyze.
- Data analyst: Data analysts access, manipulate, and analyze the data made available by the data engineer. They will use analytic techniques to answer analytical questions asked by the business, enabling organizations to make data-informed decisions.
- Data scientist: Data scientists perform various tasks, including data mining, machine learning (ML), and probability and predictive modeling, to find and extract insights from data. Whereas data analysts will look to find answers to existing analytic questions, data scientists look to find patterns in data without existing questions.
Another way to approach this is to look at the phases of the data journey that a person is involved in, regardless of what role they play. We will discuss the various phases in much more detail later on in Chapter 10, Turning Insights into Decisions, but here is a quick overview:
- Identifying decisions to be made
- Understanding, acquiring, and preparing relevant data
- Turning data into insights
- Validating the insights
- Transforming insights into decisions
- Communicating decisions
- Evaluating outcomes of decisions
In Chapter 11, Defining a Data Literacy Competency Framework, we will identify the various skills that are relevant to each of these phases.
Learning levels
When designing a data literacy educational program, it is important to include multiple learning levels within it. You can label them with sequential terms, such as basic, intermediate, and advanced, or you can use more descriptive terms based on the outputs, such as awareness, understanding, application, and expert. This is important for two reasons. First, employees cannot expect to jump from knowing nothing to being experts all at once. It is a journey. As such, there are various skill levels that could be achieved at each level. For example, a basic skill level for an employee who needs to interpret analytic results would include the ability to understand simple statistical terminology, such as mean, median, and mode, and various aggregations, such as average and sum. An intermediate level for that same employee would include wider and more advanced skills to be able to know whether interpretations can be derived from results. An advanced level for that same employee would include having a deep understanding of statistical terminology and the ability to recognize statements and interpretations and evaluate them against the data and other facts. The second reason is that not all roles will require the same level for each skill.
For example, a leader who is reviewing proposals may only need to achieve an understanding of a skill, whereas an employee doing the specific work will need to achieve an expert level. In another example, people who are responsible for making decisions from insights provided will need to be able to interpret the results of a given statistical or analytic test. They don’t need to know how to actually implement those tests, though, only just interpret the results. Someone else within the organization requires more advanced levels of the same skill so that they can apply and implement those statistics or analytics. We will dive deeper into the learning levels for each skill in a later chapter when we discuss a data literacy competency framework.
Covering all moments of need
Organizations tend to think of data literacy training as a single point in time when someone starts not data literate, and they become data literate after completing the training. However, neither learning nor user adoption works like this. Data literacy education programs need to take into account the five moments of need for an employee: learning for the first time, continuous learning, knowledge refresh, real-world application, and keeping current, as shown in Figure 4.6:

Figure 4.6 – The five moments of need of an employee
The “first” experience
The learning of a brand-new subject is most often delivered all at once, during the course of several days straight. This is done in an attempt to take in a mountain of information in a short period of time. But ideally, the first experience should be a manageable serving size that whets the appetite and lays the foundation for the continuous experience to follow.
For example, when launching new data and analytic tools and technologies, don’t provide an intensive multi-day crash course on every feature and function. Start with a specific task that this tool will help the employee achieve that they could not before, and teach them that. This will make them aware of the technology, in a manageable serving size, and they will then want to continue to learn more.
The “continuous” experience
Studies show that information learned over time is remembered more than the same amount of information learned all at once. This approach encourages a cycle of learning and application, learning and application, and so on, and with each return to the learning phase of the cycle, employees are armed with more experience and real-world understanding regarding how they will apply what they are learning.
Rather than teaching data literacy as a finite multi-day event, think of it as a process. Similar to how universities offer continuing education programs to postgraduates, your data literacy education should follow this. This blended style allows employees to learn specific topics followed up by a chance to practice them in real-life scenarios. Then, they continue on to the next topic, potentially the next week.
The “knowledge refresh” experience
Employees will never remember everything that they learn related to data literacy (or any topic, for that matter). It is very common that employees may be working on a project and remember specific data literacy principles that they learned previously, but they fail to remember the specific details of how to apply them. To help with this situation, the learning program should allow employees the ability to jump back to that point in their learning experience and easily review it again. Employees should not have to retake the entire training course or module just to obtain those specific details of how to apply something; they should be able to quickly refresh something they have already learned.
In one of the training classes offered, your organization may discuss a specific topic that needs to be refreshed later. For example, an employee may be working within a dashboard and needs to remember how to do comparative analytics within a specific tool. They do not want to have to sit through the entire training they already took. They want to be able to go to a learning management system or similar and look up a job aid or a clip of the training as a video specific to this request.
The “real-world” experience
Remembering information does not automatically translate to being able to apply the information. The learning experience is often built upon simple examples that can be understood by a broad range of employees and roles. Because the examples are engineered for educational purposes, they frequently follow a happy path without encountering errors or exceptions to the intended workflow or process. In the real world, the application of what you have learned does not always go quite so smoothly. This is where a data literacy educational program needs to provide employees with the ability to get advice from others on a real-world application. Common examples of this range from moderated discussion forums to mentors and coaches.
The “keep current” experience
Things change all the time, and employees must continuously learn new information. There are always new tools and technologies being leveraged, and organizational processes are always evolving as well. Learning content needs to be governed to ensure that all the information it provides stays current. For content developers, it may require nearly as much effort to maintain this content as it did to initially create it. However, without this ongoing effort to keep the content current, users will quickly lose confidence in the content if they discover information that is, at best, out of date or, worse yet, incorrect. Similar to knowledge refreshes discussed earlier, employees should easily be able to identify new content without having to sit through an entire learning course or module where only a portion is new content.
Typical examples of this within an organization may be as simple as release notes for changes in a process, to specific learning modules on what has changed in the ecosystem.
Learning methodologies
Data literacy programs should ideally blend formal learning with informal learning opportunities.
Formal learning is structured learning with specific learning objectives. This is commonly accomplished in organizations via either face-to-face classroom or virtual online training sessions with an instructor. Informal learning involves employees learning from daily experiences doing their job, outside of a classroom. It can include things ranging from immersive experiences and simulations to conversations with mentors and coaches and other colleagues, reading social media posts, listening to podcasts, webinars, book clubs, and other communities of practice.
In addition to providing both formal and informal learning opportunities, employees will benefit from creating shared experiences to learn with and from other employees. This is typically accomplished through blended learning, which includes a blend of self-paced learning modules and activities, with weekly live sessions with peers and an instructor.
Organizations aspiring to be data-literate organizations should also build a community of practice specific to data literacy. Communities of practice are groups of people who share a common desire and passion for a particular task or skill or subject. Employees will deepen their knowledge and expertise by leveraging communities of practice as this provides them opportunities to interact with peers on an ongoing basis, specific to the topic. In communities of practice, there is no hierarchy or instructor. All members can provide knowledge to other members and influence via social and collaborative communication and sharing of ideas.
Including all knowledge types
A world-class data literacy educational framework cannot just include core data literacy knowledge and skills. There need to be some aspects of the knowledge and learning that are specific to their business, industry, and organization. This is why subscriptions to third-party learning platforms that offer various off-the-shelf courses on data literacy topics are useful, but cannot be the complete solution.
The learning needs to be augmented with knowledge specific to the organization, industry, and business domain, as shown in Figure 4.7:
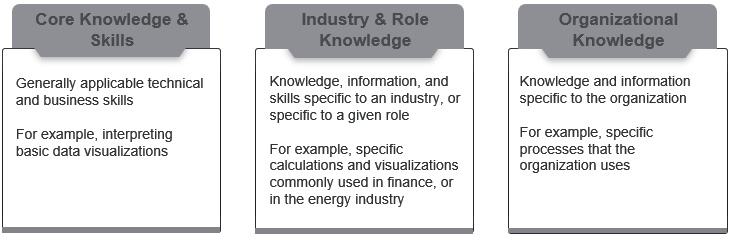
Figure 4.7 – Three types of content to include in your data literacy education
Let's go through these domains in the following list:
- Core knowledge and skills: Core knowledge and skills relates to training and knowledge content that helps employees with foundational knowledge and skills, regardless of which role or industry they are in. For example, everyone in a data-literate organization should have the knowledge and skills to be able to interpret a basic data visualization.
- Industry and Role knowledge: Data literacy can be useful across any industry that leverages data. However, if the goal is to make better decisions with data, it is important that employees tasked with making those decisions understand the industry and business knowledge specific to the decision to be made. For example, if a software company is trying to make a data-informed decision as to how to decrease the number of software bugs they have, people analyzing the data and making decisions would need to know about the software development industry, what is defined as a bug, what are appropriate industry benchmarks for how many bugs are acceptable, and various things like that. If analysts or decision-makers do not understand the data and how it is applied in the specific business context, they will not be able to make the best decisions. Training and knowledge programs should ensure that employees receive the right industry and business knowledge as part of the data literacy educational framework.
- Organizational knowledge: Organizational knowledge is related to how your organization works. This includes knowledge about the people, processes, strategy, and culture. Every organization is different. Just having core skills and industry skills is not sufficient. Learning offerings need to also include knowledge that is unique to how the organization works. This could include the process of how your organization makes tactical decisions, or it could include which organization owns specific data structures you may require in your analysis.
Learning elements
Educational programs are more than just the sum of all the learning videos or modules or courses. Those are absolutely critical for employees to achieve the desired learning objectives, but the ability to practice what you are learning, as well as the ability to assess whether you have obtained the desired learning objectives, is critical as well. Learning activities allow employees with safe opportunities and environments to reflect on and practice what they have learned. These can be labs, exercises, and other activities that require employees to practice what they have learned. If the learning is specific to a tool or technology, organizations should set up a sandbox environment to allow a safe place for employees to practice. Learning assessments are used to validate that a user has met the desired learning objectives and is ready to add to their existing knowledge.
Organizing content
One of the most important considerations for setting up a data literacy educational program is how the knowledge and learning content is organized and displayed. Employees expect useful experiences, tailored to their interests, their job, and their needs. While your organization may have an abundance of learning content, it is imperative to make sure employees do not waste time trying to find relevant content.
The challenge is determining the best way to organize and deliver just the right information to the right employee at the right time. This includes how to combine relevant content with insights about the employee’s current needs. There are four types of content organization:
- Catalog
- Targeted
- Personalized
- Adaptive
These types are illustrated in Figure 4.8:
|
Push and Pull |
As Close to Point of Need as Possible |
Context-Specific |
|
Catalog |
Targeted |
Personalized |
Adaptive |
|
Everything listed |
Role-based |
Rules-based |
Data Driven |
|
Searchable |
Product-based |
Decision Tree |
Impoves overtime |
|
Experience-based | |||
|
Geography-based |
Figure 4.8 – Ways to organize data literacy educational content
Let’s go through each of the content organization types:
- With a catalog search, all the content is listed, but not in any organized manner. This is good for employees who may want to search and find relevant content, but not good for an employee who does not know what they don’t know. A catalog can be useful for data literacy educational programs, but it should be only used by experienced employees who are already at a specific level and who are looking to find other learning tasks for professional development.
- With targeted content organization, content is organized and presented based on a targeted audience. This can include what role the targeted segments have. It can also include the level of experience of the employee. For example, there could be a pathway of curated learning specific to business leaders who want to achieve a basic level of competence in interpreting data visualizations.
- Personalized content organization is similar to targeted, but it becomes truly individualized. Because every employee is different, they may need slightly different and individualized content. This could be accomplished by asking the employee to identify relevant needs and content, and then displaying the personalized content for them. This is commonly accomplished based on a wizard-like approach that leverages rules and a decision tree behind the scenes to determine what to display. In more mature organizations, they have already defined the specific mappings of what sort of learning an individual needs, so the relevant learning can be displayed as soon as the employee logs in. Later on, in Chapter 12, Assessing Your Data Literacy Maturity, we discuss the levels that can be achieved for each competency. All of the learning should be displayed using these levels, such as beginner, intermediate, and advanced, as an example.
- Finally, with an adaptive organization of content, the content that is displayed to the employee evolves over time, based on data and by leveraging ML. A common example of this would be recommendations of knowledge base articles, podcasts, and other learning content based on data of what similar employees consumed.
Searching for content
The user experience that is implemented for your data literacy educational program should take into account various ways that employees will want to search for relevant content. There are commonly four ways that your employees will want to search for content, based on factors such as their role, their level, and their moment of need, as shown in Figure 4.9:
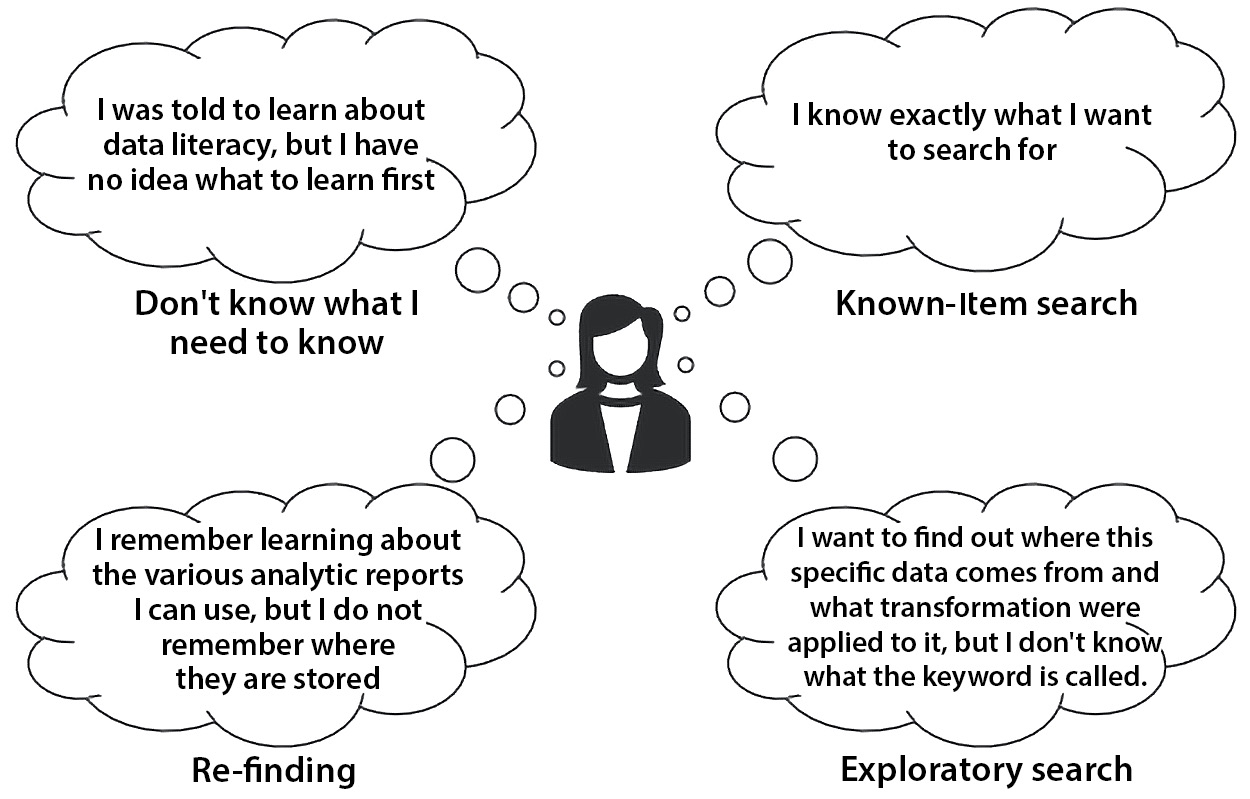
Figure 4.9 – How employees search for data literacy education
Known-item search
In some situations, employees know what they want to search for, and they know which words they can use to describe it. They may be looking for training on a particular tool, or they may be looking for a specific organizational process for cleaning data. In those cases, the key for the employee is they want to find the right information quickly. This can be implemented by leveraging a search across all knowledge and learning assets. Other approaches include a list of quick navigational links based on key or popular topics.
Exploratory search
In other situations, employees may have some idea of what they need to know, but they may not know how to articulate it and may not know the right terms or keywords that are used to find it. This is especially true with software training. They may know what they want to accomplish, but they may not know what that is called within the software. Employees in this situation also do not really know where to start to look, although they are able to recognize when they have found the right answer. Searches are not really useful with this type of exploratory seeking of learning content as employees are not able to articulate what they are looking for. Common solutions to this include good navigational structures within the environment, including a site map so that employees can browse it and explore or discover as they go, similar to a site map within a grocery store. You may not know exactly what you are looking for, but you know enough to know if it is a spice, a vegetable, or a protein, for example.
Re-finding
We mentioned earlier in the section how important it is to allow employees to easily find content that they have already consumed. A lot of time is typically spent by employees trying to re-find useful information and learning. Typical solutions for this use case include adding the ability for employees to bookmark content or create their own playlists of content.
Don’t know what I need to know
The most common use case for employees just starting out with learning a topic, such as data literacy, is that they do not know exactly what they need to know. In these cases, it is the task of the organization to show them what they need to know. The ideal solution for this is to have a prescriptive pathway of content that the user should consume based on their current skills and gaps specific to their role.
To conclude this section, it is important to remember that data literacy is not one size fits all, so the educational program should not be either. This was a lot of information to share, covering various categories and dimensions that organizations should consider for their data literacy programs, but you should start by selecting the ones that make the most sense for your organization and where you are in the journey.
Organizations just starting out should not attempt to tackle all these various categories and use cases at once. Pick the ones that are most important to your organization to get started, such as prescriptive learning pathways for various roles within the organization. Then, continue to add and evolve for additional use cases, such as continuous learning, over time.
What ends up being challenging for mature organizations is that support for one specific category does not work for another one. For example, support that works for onboarding new employees does not work for employees who are already onboarded, and who want to continuously learn. Ideally, your systems would allow employees to either self-select or automatically select support based on where they are in the journey. For example, the system identifies any employee who has started in the past 3 months as a new employee and directs them to the support for onboarding.
Measuring success
Measuring the effectiveness of your organizational data literacy initiative is an essential step in the process. It will help you understand where your gaps are so that you can then prioritize and improve in those areas. It also enables you to communicate to the organization where they are in the journey and encourage further adoption.
In this section, we will talk about various strategies to evaluate and measure the success of an organization’s data literacy initiative. This section will not cover how to assess organizational or individual data literacy maturity. Those topics are covered later on in the book in Chapter 12, Assessing Your Data Literacy Maturity.
Measuring the success of an organizational data literacy initiative can be shown at four different levels, as depicted in Figure 4.10:
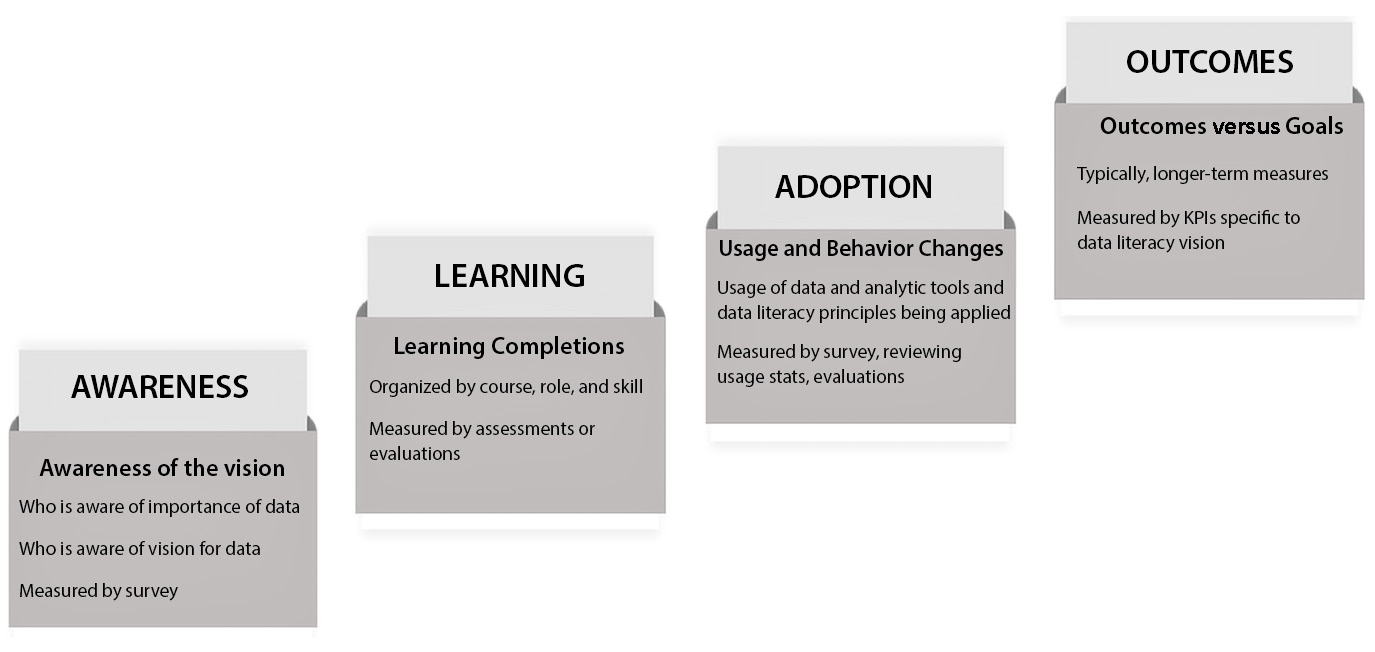
Figure 4.10 – Four levels of measurement of data literacy initiatives
Let’s now look at each level in greater detail:
- Awareness: Awareness measures who is aware of the data literacy initiative and its goals and objectives. This can be measured in a variety of methods, ranging from less accurate to more accurate. It can be measured by how many people received communications about the initiative by providing surveys to understand how many people are aware of the initiative. Change is a process, so it is important to measure awareness so that we can identify where we are in the journey. Not everyone is going to have learned the required skills and processes right away, so focus on driving awareness first.
- Learning: Learning measures which employees have taken training on various skills, as well as whether they acquired knowledge from the courses. This can be accomplished by providing assessments or evaluations at the end of each learning course.
- Adoption: Adoption measures two separate components of the data literacy initiative. One level measures the adoption of tools and technology. This can be evaluated based on the usage statistics for the relevant tools. Another level measures how data literacy is applied in meetings and in making decisions. This can be evaluated with surveys or evaluations to understand how many decisions are leveraging the organization’s decision-making with data processes and whether there are any barriers to employees leveraging them (such as a lack of manager support).
- Outcomes: Outcomes measure where the organization is compared to the intended goals and outcomes for the data literacy initiative. Earlier in this chapter, we looked at how, during the planning phase, organizations develop their goals for how they will use data literacy within the organization. You will have also decided on key metrics to evaluate those goals. Now, you can monitor those key metrics to measure the goals to see where you are in terms of your desired outcomes.
Outcomes are typically longer-term measures, and when an organization is just starting out with its data literacy journey, it needs to show shorter-term progress. This is where the other measures come into play.
Now that we have learned about how to measure an organization’s data literacy, we will move on to discussing how to best celebrate successes within your data literacy initiative.
Celebrating successes
We have previously mentioned that becoming a data-literate organization is a journey over time. This journey requires a proper change management process. One of the key elements of this approach, to help reinforce the change, is to celebrate successes when they happen. This will not only increase morale overall, but more importantly, it will help build support for those employees who have not embraced or adopted the change to data literacy because they want to see it to believe it. These successes do not have to be large wins; even small wins, such as people completing a training course, will boost engagement. Here are a few tips on how you can celebrate your data literacy successes early and often:
- Provide win reports to the entire organization. Do not just focus on large wins; even small wins help show progress and boost engagement. These can be things such as monthly newsletters that highlight employees who have completed a specific data literacy learning pathway, or the rollout of a new technology to aid in the process of making better decisions with data.
- Provide certificates of completion and digital badges for employees who complete specific data literacy learning pathways, and share the badges on internal forums, the intranet, and even on external social media sites.
- Spend 5 minutes at the beginning or end of meetings to provide wins or recognition to individuals or groups. This can include, for example, how a group of employees worked collaboratively to uncover a mistake in one of the insights due to assumptions or bias.
- Show your work. Set up lunch and learn and other opportunities for employees to show what they have done specifically to data literacy. This gives them recognition in front of their peers, and it also allows everyone to obtain some new information and knowledge through this informal knowledge-sharing approach.
Summary
In this chapter, we have learned what it takes to be considered a data-literate organization. This does not just involve training individuals on data literacy skills—it also requires the organization to have a data literacy strategy that aligns with the organization’s strategy. It requires tools and technologies and a culture that supports and empowers employees on their data journey.
We also discussed the steps you should follow if you want to launch a data literacy initiative within your organization, starting with planning the vision, and then moving on to communicating the vision, developing a data-literate culture, creating learning environments, and then finishing up with measuring and celebrating successes. You should now be able to go back and identify where you are in your data literacy journey and then identify steps to take it to the next level.
Now that we have learned about the first pillar, organizational data literacy, and how to implement it, we will move on to the second pillar, data management, in the next chapter.
Further reading
Please go through the following resource for further reading:
- Kotter, J.P. (2012), Leading Change, Harvard Business Review Press.