3
Understanding the Four-Pillar Model
Everyone is familiar with and understands the concept of data and dashboards. We observe increased demand and acceptance for data and analytics projects. Due to this increased demand and acceptance for data and analytics projects, we see also a higher demand for data literacy skills.
When we get specific, there are four fundamental pillars in data and analytics that we must address in our businesses: organizational data literacy, data management, data and analytics, and education.
To truly grow, we must first understand the facts about data literacy, which is primarily addressed to employees of a company. This is a good thing, but if we approach data literacy solely for personal growth, we will miss out on a lot of opportunities. This is why the four-pillar model is an important approach that allows you to consider, plan, and develop your data and analytics strategy and all components involved.
This chapter will assist you in understanding the four critical pillars for a successful approach, which will help you in defining your data and analytics strategy for the entire organization.
The following topics will be covered in this chapter:
- Gaining an understanding of the various aspects of data literacy
- Introducing the four fundamental pillars
- Mixing the pillars
Gaining an understanding of the various aspects of data literacy
As we discussed in Chapter 1, The Beginning – The Flow of Data, data literacy is defined as the ability to read, understand, and argue with data. We went a step further and added, “it means how a person uses data and understands the world around them”.
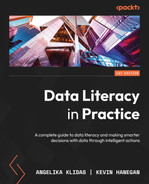
It’s the human aspect that means it’s also a matter of behavior—that people can work with data because they want to, not because they have to! We need to be able to criticize the insights we derive from that data mountain, and this includes not only the use of cool software but also the adoption of critical thinking and the adoption to embrace all aspects of data literacy. Figure 3.1 depicts the skills that are required to grow in this beautiful data and analytics world.
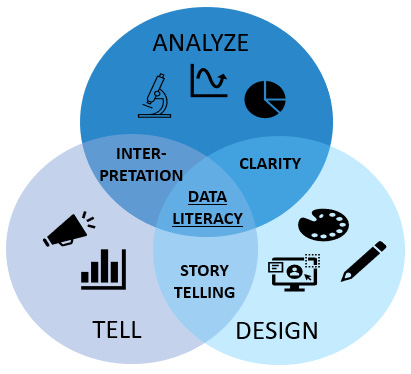
Figure 3.1 – Defining data literacy skills
As shown in Figure 3.1, this data literacy Venn diagram addresses specific hard technical skills and soft skills (such as communicating and understanding how people use and see colors in data visualizations, and so on). Mostly, people are familiar with the term data literacy, but very few are sure which competencies or skills are related to data literacy, and even fewer people are aware of which of those competencies are relevant to their role. In Chapter 11, Defining a Data Literacy Competency Framework, we will help you to identify what data literacy competencies are, and which skills and mindsets are relevant for each competency.
It is also important to note that data literacy is not about expecting to or becoming an expert; rather, it is a journey that must begin somewhere. Why do we believe that data literacy, or the ability to be data literate, is critical for our businesses? As previously stated, making data-informed decisions is more important than ever in this digital transformational era! Why? As we all experienced, due to the COVID-19 pandemic, our digital mindset and ability to embrace the digital revolution advanced by at least 5-7 years within a year! We all learned to work from home and to use data and insights to understand what was going on around us, and businesses realized the value of data-informed decision-making as well. Everywhere we looked, in every country, the most amazing and terrible visualizations appeared to inform us about the pandemic, and we needed to learn to read, argue against, and criticize the information that we were seeing.
Introducing the four fundamental pillars
When a company lacks the necessary soft or hard technical skills, as well as the tools to work with data, the leadership operates in a clouded environment. As a result, they are hampered from making data-informed decisions because they lack the critical and required data vision or insights. Worse, they will fall behind in their businesses, losing their competitive advantage and—ultimately—their customers.
We can all use data-informed decision-making to improve our performance, innovate our work and products, and add more value to our businesses when we have a data-literate workforce. This applies not only to individuals but to your entire organization, from top to bottom, team to individual. This enables your organization to overcome challenges more quickly—or more accurately—more easily, and become able to drive your future plans (your strategic objectives).
When we look back to the first pandemic year, 2020, we see that a rapid digital transformation was required; in 2021, the “race pace” was even faster. What we saw and noticed is that:
- Data is essential for organizations and aids in digital transformation.
- Our services and deliveries must be faster, and we require data-informed decision-making to do so!
- Software as a Service (SaaS) and no-code/low-code are trends that help us speed up our work because time is money and we need to develop our data environments in a convenient and easy way.
- The cloud works for all of our organizations; customers can quickly get on board; there is no need to set up large technical environments. Instead, it is about selecting the right configuration and getting started quickly with your data and analytics journey at lower costs and with the ability to scale quickly.
- We can see all around us that the transition to the cloud is accelerating at breakneck speed.
- Data management, establishing a solid, future-proof data strategy, is more important than ever!
Figure 3.2 illustrates the four fundamental pillars of data and analytics. These four pillars are critical issues that we must address in our businesses. To truly grow, we must first understand the core facts about data literacy, which is primarily addressed to the people who work within an organization rather than having an “organizational data literacy plan” ready for the entire organization:
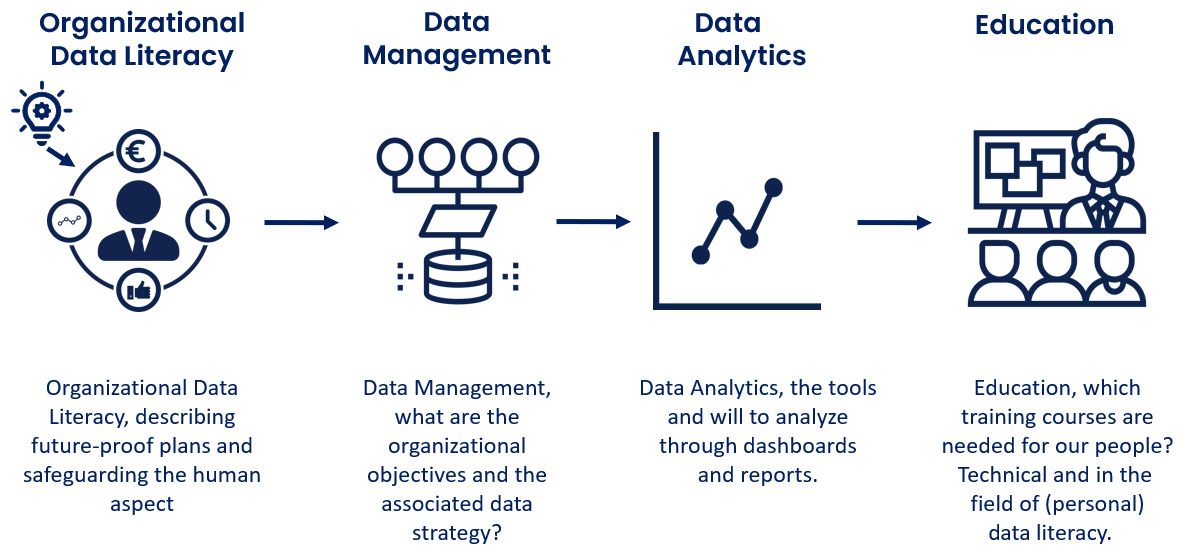
Figure 3.2 – Describing the four fundamental pillars
In the following paragraphs, we will explain all four pillars, and in the following chapters, we will guide you through the various elements of the four pillars in greater depth.
Becoming acquainted with organizational data literacy
This first crucial pillar emphasizes the significance of the human aspect of data literacy. It enables you to comprehend how data literacy and all related elements influence an organization’s future and, more importantly, the business “culture”. It is a blueprint that will assist in understanding the various elements of the four pillars and breaking them down into a constructive plan:
Figure 3.3 – The first pillar: organizational data literacy
Because everyone has a different level of experience working with data and we need to address data literacy at all levels within an organization, we must include the human factor in our future plans! As a result, it is critical to promote data literacy through education, the development of a future-proof plan, and a focus on the small victories that people achieve on a daily basis.
Data literacy is something that affects everyone and every organization. The more people who can debate, analyze, work with, and use data in their daily roles, the better data-informed decision-making will be.
The most important aspect is that your organization must be prepared! It must be prepared to embrace data and analytics as well as the amazing world of data literacy. When it comes to embracing that journey for your organizational data literacy, the following are some important points to consider:
- Leadership: It is critical that your organization has a champion, an evangelist, and a data leader who can discuss, highlight, inspire, support, and educate on data literacy
- Data literacy sponsorship: Financial support for projects, plans, and communication
- Assessments: The ability to develop and assess employees’ progress in data literacy
- Aligned objectives: Are your organizational and data literacy objectives aligned?
To begin, maintaining organizational growth requires taking care of your employees on all levels and ensuring that they are prepared for the future. Data literacy must be addressed from the top down in your organization. It is critical that our leaders demonstrate how they work with, analyze, argue against, discuss, and criticize data insights. What if they don’t? If our leaders aren’t embracing data-informed decision-making, how can we expect our employees to? Leading by example is an essential component of the data literacy environment in the workplace. When we embrace data literacy, our businesses will be able to measure and improve on their organizational goals, maximizing the value within their organization and having a competitive advantage in all situations that arise. How can you grow during the intermezzo? Here’s a synopsis of one of our success stories (the URL to the longer version is in to our referral list).
Intermezzo – how can you grow?
At a previous company, for example, several offices used tooling to create amazing dashboards and reports. Several departments created reports for the internal organization when we first started. Over time, more and more groups requested licenses as well as additional dashboards and reports. It was discovered that all reports and dashboards looked different, that the setup for connecting to data was different, and that there were no coding conventions or cohesion among the staff of those various departments. It wasn’t long before the environment became uncontrollable, necessitating the establishment of a competence center.
We began this journey with a plan that described what to do, how to set up, and how to grow in a controlled manner. We started with 4 employees and fewer than 100 users (within an organization of more than 20,000 employees). We had 15 people on our team a few months later, including analysts, testers, dashboard designers, and full-time management. We had over 3,000 users and 140 dashboards that were used throughout the entire internal organization 5 years later.
How did we achieve such rapid growth? We had a centralized strategy that provided better control and data management. As we created more dashboards, we established standard guidelines and coding conventions. As a result of everyone speaking the same “data language”, we were able to work faster and across teams. We could even reuse data (we had a centralized metadata repository) and data reports. We assisted the organization in becoming “data literate” and actually using the insights that were created for their data-informed decision-making by providing workshops, communication, newsletters, and so on. So, we were able to convert mountains of data into actual usable information for decision-making at one point.
The importance of data literacy in all its facets is needed—that is what we see and read in various publications. In one of those publications, it is mentioned that throughout all industries, the demand and availability of data for a company’s data-informed decision-making process have exploded. But research also pointed out that the available data and insights were not delivered to the hands of people that needed to make and create decisions. Next to that, people needed to just simply understand the insights that were created. In the end, this research also concluded that there is a huge opportunity in working with data but that the skill set for data literacy needs to be more addressed from a corporate point of view as well.
For more information, go to the presentation by Mike Capone, CEO of Qlik—October 2018 at https://bit.ly/3pdNMqs.
The conclusion is that there is room for growth, but you must plan ahead of time. We will help you with a framework for understanding change in an organization when it comes to data literacy in Chapter 4, Implementing Organizational Data Literacy, so that you can write that plan and be successful. As the second-most important pillar of our framework, we will go over the elements of data management in detail in the following section.
Discussing the significance of data management
Still, from a technical and business standpoint, data management is sometimes set aside, and organizations only begin with setting up their data and analytics environments. Nowadays, we see (fortunately) that due to the growth and complexity of data and the required data environments, a solid data strategy and a shared data vision have never been more important than they are now!
Figure 3.4 – The second pillar: data management
For a few years, we’ve seen a paradigm shift and the need for a controlled data environment, making data pipelines with a low-code/no-coding technique more important. With that low-coding/no-coding flexibility, you can identify data, secure sensitive data, and provide data analysts with an end-to-end data lineage.
Although tools are important, we will not recommend any in this book. Instead, we’d like to give you a practical approach to consider when starting with data integration, building data pipelines, or data warehouses.
When businesses want to work on their data management processes, improve data quality, or even monitor the data environment, the following five steps must be followed:
- Data strategy: Develop a shared vision, assign data owners, and so on.
- Training and coaching: Train, coach, and mentor your data owners, stewards, and business users.
- Processes: Set up a process to improve data quality, set up continuous improvement, and so on.
- Control: Describe your organization’s data principles, create a data management mindset, or even set up a data office and possibly assign a CDO.
- IT: Maintain a data register and dictionary, use data modeling tools, and monitor your data environment and quality.
Data management is an important element of data literacy—this is also stated in publications. The need for data at the correct time, in the correct place, and in the hands of the correct people will definitely help in making data-informed decisions. This is exactly why we think that data management in all its facets is an important pillar of this methodology!
For more information, go to the TechTarget, October 2019 at https://www.techtarget.com/searchdatamanagement/definition/data-management.
You should keep in mind that when your strategic objectives are clear, it is easier to think about your data strategy. From there, it will be easier to embrace data management and improve your data quality. Consider data literacy training when hiring new employees and assist them in boosting data literacy in this way. You will also increase the flow of data and the value within your organization as a result. We go over the actions and processes in greater detail in Chapter 5, Managing Your Data Environment:
Figure 3.5 – The third pillar: data analytics
For more information, visit: https://towardsdatascience.com/why-visual-literacy-is-essential-to-good-data-visualization-5b9dffb5aa6f.
Defining a data and analytics approach
Employees will need the appropriate analytical tools to build and analyze tables, graphs, and other visualizations, in addition to the skill set to work efficiently with data. We look at data and analytics in various ways, as we described in Chapter 2, Unfolding Your Data Journey, and we’ve described all steps of the amazing journey that you can go on. But also, we see that the majority of organizations will remain within the descriptive and diagnostic stages. This is not a bad or weird situation—those types of organizations are just not ready yet to grow toward predictive or prescriptive analytics. They might not even have the desire to have predictions or even machine learning (ML) activities in the future.
Within the data and analytics pillar, we have a few important elements that we will discuss in more detail, including the growth of data, the right data and analytics tools, artificial intelligence (AI) and ML, cloud solutions, and how data literacy itself fits into this pillar too.
The rapid growth of our data world
We know that data and analytics continue to evolve beyond our imagination. As mentioned in Chapter 2, Unfolding your Data Journey, the world will generate more than 180 zettabytes of digital data by 2025. It’s therefore good to see that organizations embrace new technologies to help them transform and grow in their data-informed decision-making. This digital transformation helps to identify efficiency and grow their competitive advantages. In the last years, and especially during the pandemic, we learned that data and analytics became important for organizations.
The COVID-19 pandemic was an accelerator in this case. The digital race was accelerated due to the lack of data that we needed for even the simplest decisions in our daily lives. As an example: Do we have enough beds in the hospital? How many tests are done? How many people are sick? and so on. The most common consideration during that time was “if we just had that data”, regarding the pandemic in 2020 and the explosion of the number of coronavirus cases. The data was incomplete and only indicative! In 2021, that was certainly the case with the information about vaccines. When we look back at this period, one thing is clear: the pace of digital transformation has accelerated tremendously. According to the experts, in 2 years, we have certainly raced 5-7 years ahead in this transformation. To give you an idea of the struggle during the COVID pandemic, we have an intermezzo that illustrates how we coped with the lack of data or the lack of correct data.
Intermezzo – Dare to decide
In August 2020, after a brief vacation, we discussed a COVID dashboard that had been developed (as many data junkies did). But we had been struggling with the data and the continuous changes that had been made in the datasets. The insights that were created were good, and we were able to build a score-carding perspective from them. But after many discussions about the data, the changes in data, and the lack of data, we decided to “not publish” the developed dashboard. In Figure 3.6, there is a small glimpse of this dashboard displayed:
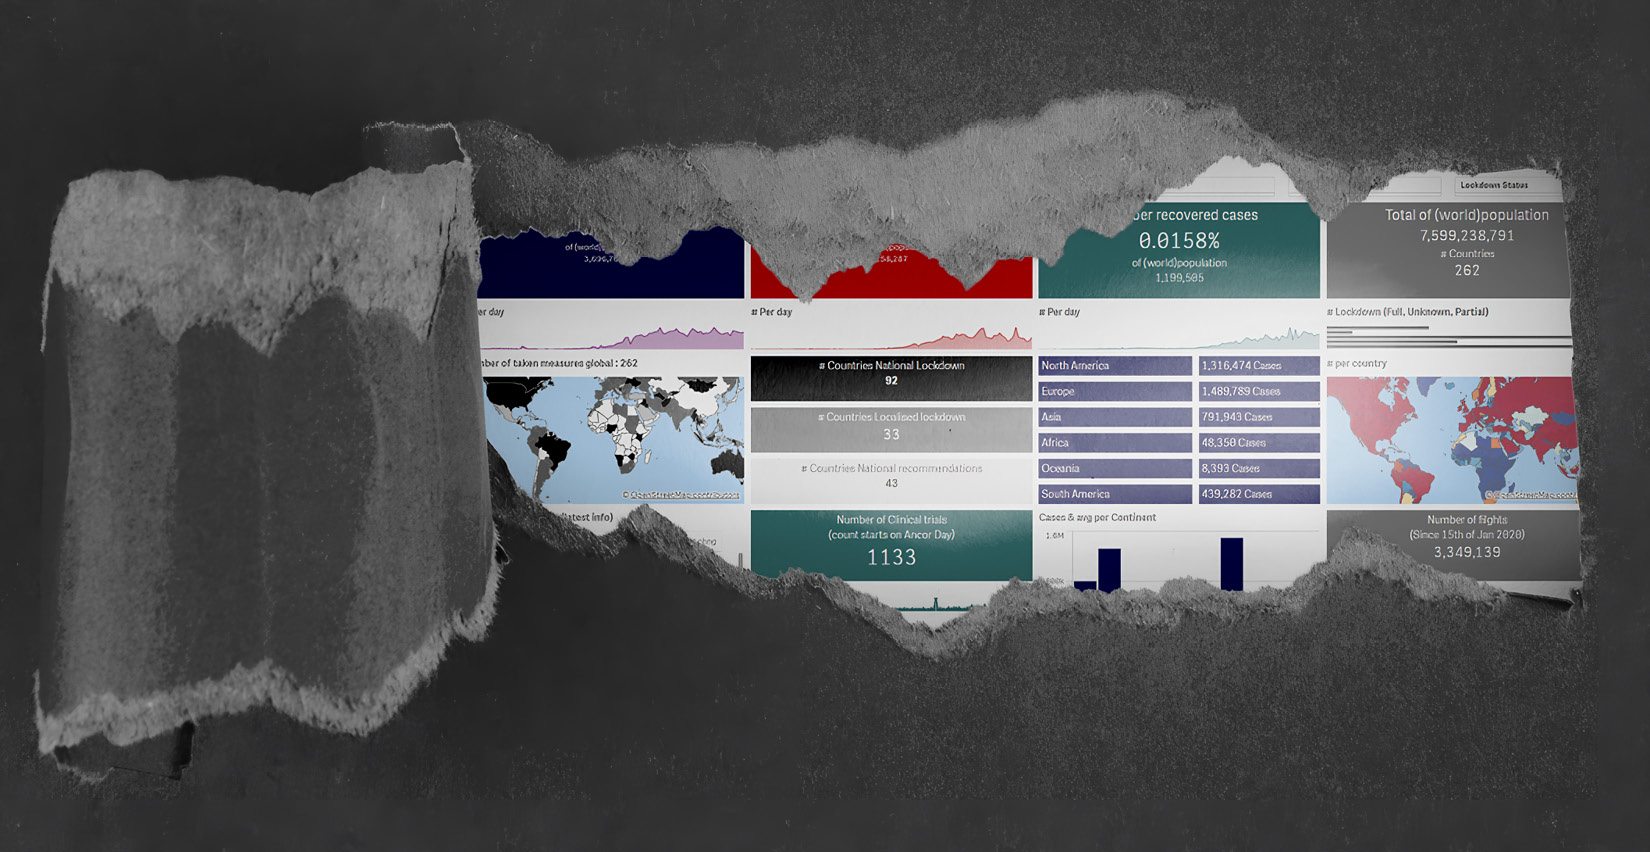
Figure 3.6 – Dare to decide
Up until today, we still hold fast to the decision not to publish the dashboard. The numbers are totally off, as we did not collect data from the start and simply because a lot of people were not tested, or not registered. From that point on, we decided to actually look at the pandemic from a different perspective.
We found datasets from clinical trials (www.clinicaltrials.gov) and commercial flights from all over the world via Flightradar 24 (https://www.flightradar24.com/data/statistics). In this way (with some other combinations), we could have a better look at the effects that the pandemic had on our world, not by just using the data from Johns Hopkins University but by using data that was from a more reliable source and data that could actually tell a story of the pandemic’s effects.
The full story can be found at https://www.linkedin.com/pulse/torn-between-two-angelika-klidas/.
The rise of data and insights is one notable result, but also the rapid transition to digital for companies was amazing. To actually work with data and utilize it in dashboards and reports, you need tools. In the next section, we will give you some information to guide your choices in buying the correct software.
Tools
In today’s world, data tools need to support decision-making. We often get questions such as How do you select a tool? Which tool should we use? and so on. The responsible persons within an organization usually (that is our experience) will have a look at the famous Gartner Magic Quadrant. In this annual report, Gartner compares various kinds of tools, based on 12 critical capabilities:
- Security: To ensure that the platform is secure.
- Governance: Being able to track and manage the usage of the platform.
- Cloud-enabled analytics: The usage of analytics in the cloud, on-prem, and across a multi-cloud deployment.
- Data source connectivity: Enabling users to connect and use data from a variety of storage platforms.
- Data preparation: Drag and drop functionality, creating measures, groups and hierarchies, and so on.
- Catalog: A way to find and digest and consume data in an easy manner. The catalog needs to be searchable and datasets need to be easy to locate and consume.
- Automated insights: Augmented analytics at the core of the platform, using ML to help users generate insights on the spot by identifying elementary and important data elements in the data model.
- Data visualization: The creation of interactive dashboards and the availability of a great number of visualizations.
- Natural language query: Help the users to search through the data by using a search engine (such as Google) to type or ask questions about a specific dataset.
- Data storytelling: This is about generating a data story, and needs to be combined with various possibilities to add text, headlines, visualizations, and so on.
- Natural language generation: Creating automatic linguistic descriptions of insights found in a dataset.
- Reporting: Creating pixel-perfect reports that can be scheduled and sent to a larger user community.
The complete report can be found on Gartner’s website (https://www.gartner.com/doc/reprints?id=1-292LEME3&ct=220209&st=sb). Also, reports from Forrester (www.forrester.com) and BARC (https://barc-research.com/research/bi-trend-monitor/) can help to make the choice that best suits your organization.
The development of tools and the usage of ML or AI are more and more common. There are tools in the market that use those techniques, and even natural language processing (NLP) is a commodity nowadays. In the next section, we will briefly describe the role of ML and AI in data and analytics.
The rise of ML and AI
The tools that we use are shifting more toward conversational analytics with the inclusion of NLP and even ML. We’ve even seen tools that advise you what to display, what to do, what to choose, or even which type of visualization is the most suitable. This is actually one of the best developments that we’ve seen! Just by asking (by typing or speaking) a question to the dataset, it gives a result back and even some visualization suggestions.
The rise of ML and AI creates a lower threshold to work with data and support our data-informed decision-making. After all, when we do have data and are willing to use any tool, data becomes “information” and we need to action those outcomes. In this way, we are able to create a mindset in which we can work with the insights that are created. From there, we are actually gaining the knowledge to grow on our data-informed decision-making journey.
Moving to the cloud
Along with ML and AI, the role of the cloud is also key in an effective approach to data and analytics. At the beginning of our own personal journeys, we started out with solid on-prem solutions. We had to buy servers and software, create connections (which took quite some time to implement), and so on. During the last few years, we’ve seen an enormous shift to the cloud where scalability and the release speed of new features are growing rapidly. We’ve also noticed that the shift to the cloud, or even installing a hybrid environment, was definitely shaped during the pandemic. Additionally, we’ve noticed that organizations needed to operate in a more efficient and cost-effective way, even using AI to find answers to challenges in a simpler way. The cloud strategy is continuing to grow, and the rapid development of improvements in those cloud environments is amazing.
There are reports available from Gartner that state that half of IT spending will be shifted to the cloud by 2025 (https://www.gartner.com/en/newsroom/press-releases/2022-02-09-gartner-says-more-than-half-of-enterprise-it-spending#:~:text=Accelerating%20Shift%20to%20the%20Cloud,%2C%20according%20to%20Gartner%2C%20Inc).
Data literacy is a key aspect of data and analytics
“Most of us need to listen to the music to understand how beautiful it is,” Hans Rosling (RIP—February 7, 2017) once said. But that’s how we often present statistics: we show the notes but don’t play the music. When we are able to play the music, we tell the story of how amazing things will happen!
It has been stated numerous times that we must keep the data visualizations we provide interpretable, interesting, exciting, and accessible to all. We can accomplish this by using carefully selected charts and adding context to our visualizations. In this way, we can assist our clients in understanding their business questions and delivering actionable insights to our organizations.
However, there is more to visualizing data and how to present good data visualizations. Many books, publications, and articles are written by talented specialists! Reading those articles, we see that there is a difference in understanding the data that you are using for your visualizations and the visual approach that you are using for your reports and dashboards. Some of us call this “visual literacy”. In fact, if we compare it with the statement of Hans Rosling, visual literacy could be the music, in connecting the strategic goals and forming them into a chorus: a melody.
After all, when we have the foundation in place for our data strategy, that aligns with our strategic goals (see Chapter 5, Managing Your Data Environment, and Chapter 6, Aligning with Organizational Goals). From there on, we are learning and developing our analytic mindset to learn to ask questions (Chapter 8, Questioning the Data). And at the end, we most likely start learning to work with more advanced visualizations and asking hypothetical or what-if questions. From there, we are about to understand what correlations and other data analytics components are and how we can use those kinds of visualizations in our data-informed decision-making journey.
Creating visualizations based on your data is an excellent way to simplify data and create engaging analysis. You can also make it more engaging for your audience by visualizing the data. Learning from experts and authors, such as Alberto Cairo (www.albertocairo.com) and Stephen Few (www.visualperceptual.com), you can understand how to properly visualize data by using the appropriate charts and colors.
Alberto Cairo once said during a session:
This sentence emphasizes the importance of keeping things simple and clear; after all, we all want the audience (of our visualizations) to understand what they are looking at! As mentioned in the first section of this chapter, data literacy is a buzzword that was coined by MIT and other larger analytical organizations. As we (the authors) say, it may be a buzzword, but we are now better equipped to explain the data and analytics story. The four basic data literacy aspects are depicted in Figure 3.7 to help you understand them better:
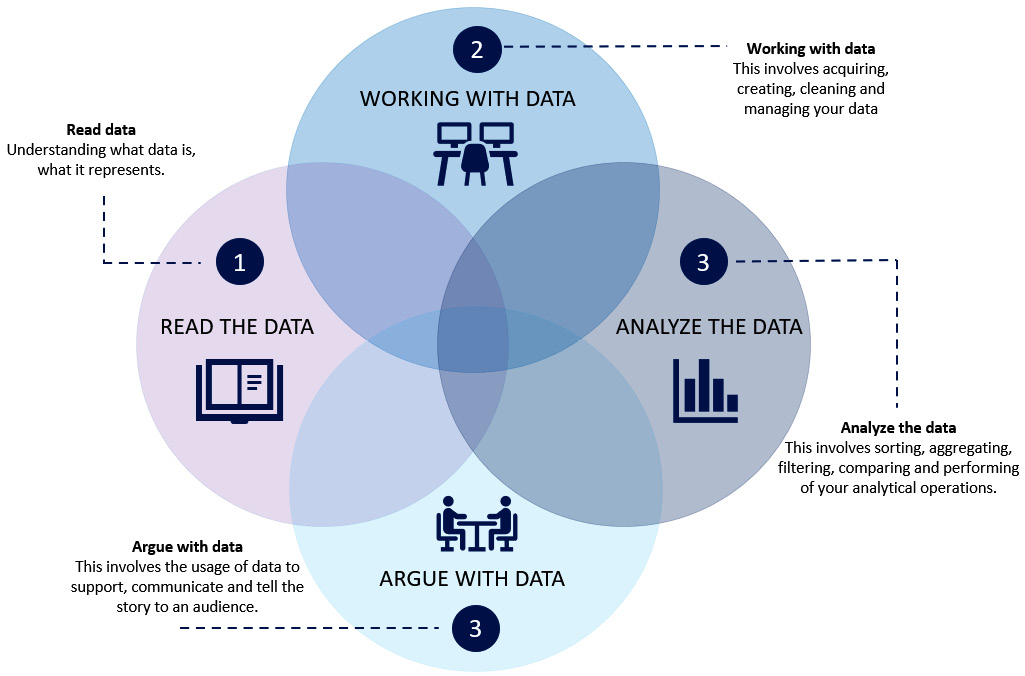
Figure 3.7 – The four primary elements of data literacy
This diagram will help you understand what the four elements are. We will discuss elements such as these in more depth in various chapters of this book. All of these elements are part of the “data and analytics pillar” from a behavioral standpoint.
To conclude this section, we’ve discussed several topics that fall under the third pillar, data and analytics. We need to ensure that our tools are scalable and accessible; we see the need for speed when it comes to the economic crisis and the effects of the coronavirus pandemic. But also, we have to choose a tool that suits the organization. We have several ways to make our choices. When your business does have helpful tools available, don’t discard them as your sunk costs will be terribly high. Make your choice wisely. But also remember that it is not a bad thing to have more than one tool, as long as you know what you’ll be creating with it!
We ended the section with a brief discussion about visualizing data and how data literacy fits in this pillar as well. In the next section, we will discuss the fourth pillar: education.
Understanding the education pillar
The fourth and final pillar is education. This pillar includes not only internal resources and technical software training, but also data literacy workshops, idea sharing and reward, and external sources. You should also think about different learning methods, such as self-service learning, role-based learning, peer mentoring, or a combination of different types of learning programs:
Figure 3.8 – The fourth pillar: education
Find a data-literate evangelist to assist you and lead by example! Make them your winners! Allow the evangelist to teach, preach, and assist your data and analytics team in evolving and educating your organization. Data literacy must be ingrained in your company’s DNA!
Intermezzo – learn to analyze!
For a project, we needed to assist in the transition of the organization to a data-informed decision-making (DID) organization (we refuse to say data-driven organization because you can’t be driven by data, only by insights or information). This project was designed to help with the transition to a new way of working in new data and analytics environments by establishing a solid data environment. This organization needed to consider not only the right, future-proof tools but also a team with specific skills to better support and assist the business. Technical skills were required for this team, but communication, analytical, questioning, and problem-solving abilities were also evaluated.
There was a variety of training planned, and we assisted the team in developing its data literacy skill set simply by spending some time learning how to analyze within your data and analytics environment. We have a tendency to use simple analysis methods such as filtering (by organizational department, year, month, products, and so on), but there is more to analyzing than this. There were many ohs and ahs just from spending a few hours learning to analyze and discussing the next question. We knew we had a foundation for spreading information within the organization by assisting the data and analytics team in learning to analyze.
In addition, we assisted the team in asking the right questions to the business when they had questions about reports or dashboards. They were able to deliver actionable insights rather than flat reporting overviews in this manner. One example of these newly acquired skills is the ability to question requests they receive by simply asking Why do you want to know this? and How are you going to use it? Only by answering these and other questions will you be able to get a complete picture of the data needed and deliver a targeted solution with insights that the business can act on right away.
There are some excellent data literacy training and assessment resources available online. The blended method is the most successful training combination. It’s a good idea to start with the basics of data literacy and how it can help, and explain that we’re all data literate in some way (see Chapter 1, The Beginning – The Flow of Data). Start by learning to analyze with the tools that your organization is using, and then teach your employees how to use the tools to their full potential.
Consider the available data literacy courses as the next step. Following those fundamental steps, broaden the learning path by incorporating real-world examples, organizing hackathons or datathons, and participating in data challenges. In this way, you add a competitive element to data use and design for the general public. Of course, assist your staff in learning which questions to ask of the data so that they can actually improve their work and gain more efficiency or effectiveness.
Here are a few pointers to help you boost this pillar and develop data literacy in your organization and your personal life:
- Ensure that employees understand and learn how to ask appropriate questions. In this case, the most important question is WHY. More on this topic can be found in Chapter 8, Questioning the Data.
- Ensure that employees understand which data is required, how to analyze it, and how to test its relevance and validity.
- Can your staff interpret the data so that the results are accurate and useful? Are they fully prepared, and do they understand which use cases are addressed (please see Intermezzo – it’s not controlling, it’s assisting).
- Show your employees how to use A/B tests to determine which options and types of visualizations work best for your organization or departments.
- Investigate the advantages of creating simple visualizations so that the results are accessible to leaders with varying levels of data expertise. People tend to focus not only on the visualizations that they require but also on those that they can read! You don’t need to be a data scientist to work with insights!
- Show how to tell a data story to help decision-makers see the big picture and act on the findings of their analysis. More information on data storytelling can be found in Chapter 10, Turning Insights into Decisions.
- Maintaining healthy organizational growth begins with a focus on every employee in your organization, to foster a desire to be assured, confident, and intrigued by data. Your business will grow as each person advances in their personal data literacy journey!
Intermezzo – it’s not controlling, it’s assisting
A decade ago, in larger organizations, we had a centralized Center of Excellence (CoE) for data and analytics. We were working with a variety of standards and guidelines within this CoE. The first step in our projects was to conduct a project intake (you can find this project intake form in Chapter 14, Appendix A – Templates). During this project intake, we discussed not only the desired functionality but also some non-functional requirements (NFRs). These questions are shown in Figure 3.9.
By answering those questions, we were able to not only manage the licenses but also manage and track the usage of our developed dashboards and reports, with dashboards that answered questions such as How many business users are there? When and who uses which dashboard? Which graphs work and which do not? When is the busiest time of day? How many sessions are available? Which licenses are used? How are licenses managed? (how many users are logged in at the same time), and so on.
Despite the fact that our customers were internal, we managed their success and were able to plot the questions from the project intake against actual usage. When we noticed that the dashboards were not being used frequently or that only one sheet (the dashboard) was being used, we visited our customers on a monthly basis. When we saw that usage was falling short of expectations, we always asked, How can we help? or Should we set up a workshop so that we can help you train the staff?
We were able to deliver some new workshops on numerous occasions (despite the fact that we always did a workshop during our implementation phase). We were able to assist the staff in understanding the dashboards, reports, and analyzing techniques in this manner. But the most important thing is that they understood the use cases that we addressed!
In addition to those workshops, we had a monthly workshop on business intelligence (BI) and how it could help us grow, gain efficiency, improve processes, and so on. The most important point we wanted to emphasize was that “action” was required; do not take the measures for granted, but instead, analyze what is behind the measure and take action to actually improve. This is why we believe in education and assisting your staff with targeted education and measuring what you need to know in order to grow.
Let’s go through the NFR project intake:
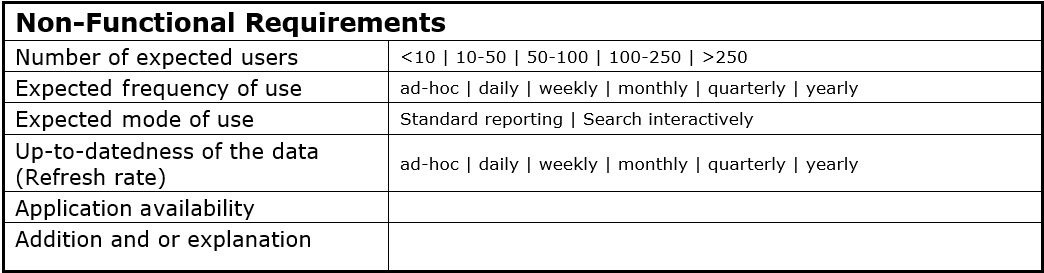
Figure 3.9 – NFR project intake
Mixing the pillars
We have frequently observed that organizations have implemented data and analytics in a variety of ways, most of which began with the idea “we need a tool” to create management information. In fact, static reports were created in the systems we’ve worked with all the time in the past. People were running around with static lists, trying to figure out when a file, product, or whatever was finished. We used to believe that big data environments were unnecessary because we could manage things perfectly with some kind of data visualization solution. In fact, we still see it around us: organizations begin by visualizing information for decision-making but neglect the organization that needs to embrace data-informed decision-making.
Figure 3.9 illustrates the different ways in which everything can go in various directions. In fact, looking back to 2007/2008, we thought a data management environment was unnecessary and visualized everything we could with the tools available at the time. This strategy was used until a few years ago. At that time, we saw the importance of data management rise, and new solutions entered the market, putting data management and data quality back on the strategic agenda:
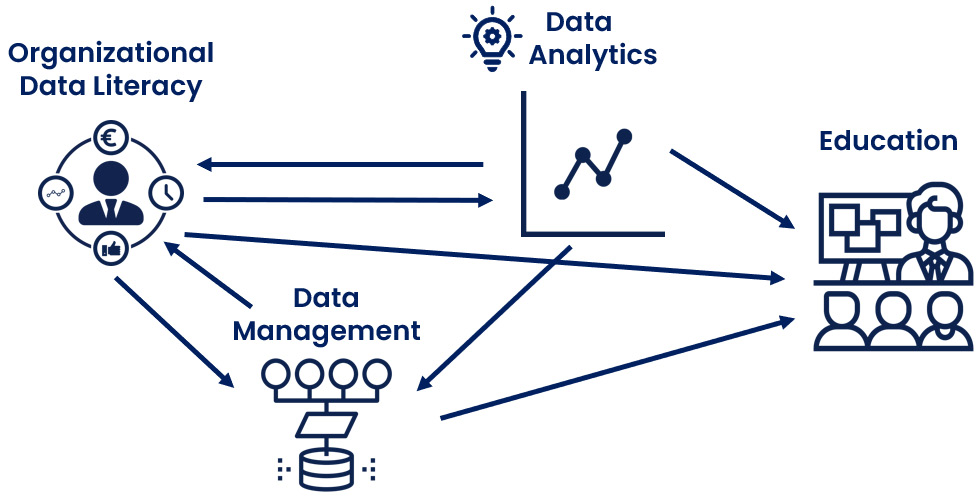
Figure 3.10 – There are various ways to use the pillars
The idea is that the organizational data literacy and education pillars must be addressed, while the data and analytics and data management pillars are dependent on the maturity of the organization and may be addressed in stages.
Summary
After reading this chapter, we have a better understanding of the four-pillar approach and how we can use it to be successful in our organizations’ use of data and analytics. It assists us in deciding what to consider when we want to professionalize our data and analytics environment or data and analytics teams.
In the following section, we discussed a brief overview of organizational data literacy and the steps you must take. The following section provided a brief overview of data management and why it is critical to implement this in your organization. This topic is covered in greater depth in Chapter 5, Managing Your Data Environment.
The following section concerned data and analytics, and it was not only about purchasing a tool that you wanted to use, but also about learning how to work with it and creating visualizations that people could actually read. The final component is education, which is required for all staff members within your organization; leading by example is essential for your organization to embrace data and analytics. Data and analytics should be in your company’s DNA! The educational component of the four-pillar model includes all chapters that embrace some form of learning.
We discussed how to approach projects and help your organization grow during its data literacy journey by using work experience stories as examples in our intermezzos.
In the following chapter, we will discuss organizational data literacy and how our framework can help you determine which steps you should take to become a successful data-literate organization.