
4
Google Looker Studio Overview
Google Looker Studio is a data visualization tool from Google that enables you to create data stories through interactive dashboards. It is a completely online (that is, web-based) tool that facilitates seamless collaboration. It has a simple drag-and-drop interface that enables both non-technical and technical users to easily build visuals and reports. At the time of writing, Looker Studio is provided by Google for free.
It was first introduced in 2016 as Looker Studio 360, which is a premium reporting platform for large enterprises and part of Google Analytics Suite 360. The free version of Looker Studio, targeted at individuals and smaller teams, was announced almost immediately. The product had been in beta status for a couple of years and in 2018, it became generally available. Google Looker Studio is tightly integrated with Google Marketing Platform, which is the expanded and rebranded version of Google Analytics 360 Suite, and Google Cloud Platform. It supports hundreds of non-Google data sources as well.
In a move to consolidate the multiple business intelligence offerings of Google Cloud under one umbrella, Google rebranded Data Studio as Looker Studio in October, 2022. Looker Studio is part of the Looker brand, which primarily comprises three offerings: Looker Studio, Looker Studio Pro, and Looker platform. This book only concerns itself with the free Looker Studio tool and its capabilities. Looker Studio Pro is the premium version of Looker Studio, which provides some enhanced enterprise capabilities, such as better asset management and team collaboration, and technical support on top of the free version.
This introductory chapter to Looker Studio will get you started with Looker Studio and provide an overview of its major entities – data sources, reports, and explorers. To leverage Looker Studio effectively, it is essential to understand the purpose of each entity and how these entities are related to each other. This chapter will walk you through performing several operations on these entities. You will learn how to work with and manage these entities, such as creating, sharing, copying, and publishing them.
In addition to building standard reports, Looker Studio allows you to explore data in an ad hoc manner through explorers. Explorer is still an experimental feature at the time of writing and is expected to go through major changes and improvements. Note that the Explorer tool within Looker Studio may look and behave in a very different way by the time you are reading this book. In fact, given the web-based nature of Looker Studio, the whole application undergoes frequent and rapid changes multiple times a month to offer new and expanded capabilities. Leverage and engage with Looker Studio’s vast community, Report Gallery, official help pages, and support forums to keep up to date, receive tips and recommendations, and more. All in all, Looker Studio is a flexible and simple tool that addresses the evolving needs of users.
In this chapter, you will create a simple report that visualizes call center data in Looker Studio. You will do this incrementally over the next few chapters, building upon what you’ve learned throughout. To start, you will create the data source and enrich it. All the chapters in this part of the book focus mainly on providing you with the tool know-how and include limited data storytelling insights. You will see a lot of these concepts coming together and applied to practical examples and walkthroughs in the later chapters, primarily from Chapter 8 onwards and to some extent in Chapter 6 and Chapter 7.
In this chapter, we are going to cover the following topics:
- Getting started with Google Looker Studio
- Working with data sources
- Working with reports
- Working with Explorer
- Leveraging Looker Studio Gallery
- Getting help with Looker Studio
- Building your first Looker Studio report – creating the data source
Technical requirements
To follow the implementation steps for the various operations described in this chapter, you will need to have a Google account so that you can create reports with Looker Studio. It is recommended that you use Chrome, Safari, or Firefox as your browser. Finally, make sure Looker Studio is supported in your country (https://support.google.com/looker-studio/answer/7657679?hl=en#zippy=%2Clist-of-unsupported-countries).
Getting started with Google Looker Studio
Google Looker Studio can be used by both individuals and organizations for their data exploration, visualization, and reporting needs. Whether you are a part of an organization or acting as an individual, you need a Google account to access and work with Looker Studio.
Organizations can leverage Google Cloud Identity directly to provision and manage Google accounts for its members. They can also synchronize users from other identity providers to Google Cloud Identity so that organizational users can access Google products and services. If the organization also uses Workspace (formerly called G Suite), a collection of collaboration and productivity tools, the administrators need to enable Looker Studio for the organization’s users.
As an individual, you can use your Google account (either a Gmail address or any non-Gmail address mapped to your Google account).
To get started, log into your Google account and navigate to datastudio.google.com. You will be taken to the home page of the tool, as shown in the following screenshot:

Figure 4.1 – Google Looker Studio home page
Like most Google products, the home page has a search bar on the top that lets you search the Looker Studio content that you have access to. You can search based on the name of the content, owner name or email, who you shared the content with, or who shared the content with you.
You can generate three types of content or files in Looker Studio – Reports, Data sources, and Explorers. These are arranged under the corresponding tabs under the search bar. You can switch between these views easily. By default, the home page displays the Reports tab, which shows the list of reports that you have recently accessed. The Reports tab also displays a template gallery widget at the top so that you can start creating a report easily by either using a template or starting from a blank report. The Create button at the top left allows you to create a report, a data source, or an explorer.
The left navigation panel allows you to filter the content to show recently accessed files, files owned by you, files shared with you, or files or content that have been deleted and are in the Trash area.
Before you can start creating content in Looker Studio for the first time, you need to choose the country you are in and accept the Looker Studio Terms of Service and Google Ads Data Processing Terms policies, as shown in the following screenshot:
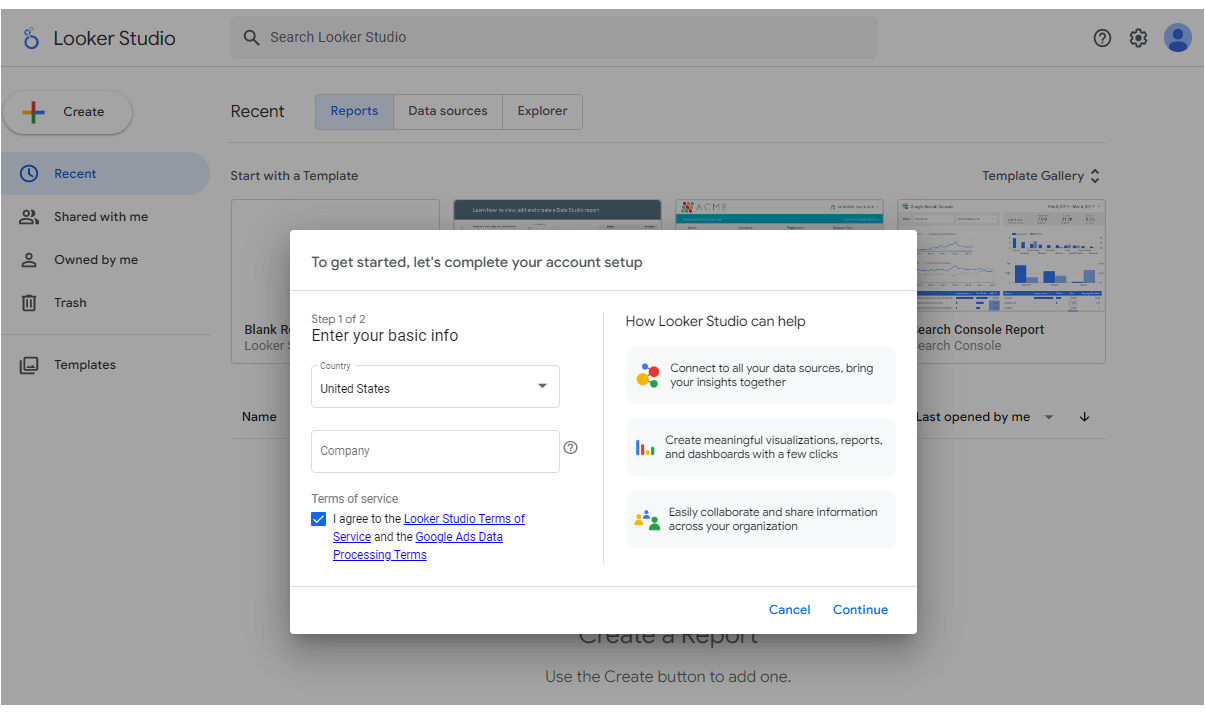
Figure 4.2 – Looker Studio account setup completion
Choose your email preferences regarding which updates you would like to receive on the next screen and complete your account setup.
Note
In the case of organizations, Cloud Identity or Workspace administrators can accept the terms of service on behalf of the organization so that the organization users or members don’t need to accept or sign the terms individually.
How it works
The four major entities in Looker Studio include a dataset, a connector, a data source, and a report. They are linked to each other as shown, in the following diagram:

Figure 4.3 – Major entities of Looker Studio and their relationship
A dataset is the physical data source in the form of files, database tables, Google Analytics views, and more that exists outside of Looker Studio. On the other hand, a Data source is the logical construct that manifests within Looker Studio based on the underlying dataset. It is the Connector entity that makes the connection between the two possible. The connector functions as the pipeline between the physical dataset and logical data source. Looker Studio offers over 500 connectors for a wide variety of data stores. A Report is a physical object in Looker Studio that you can use to create either a single-screen dashboard or a multi-page report. A report is built on top of the data source, and its fields and metrics are used to display information. A single report can use multiple data sources. Likewise, a single data source can be used to build several reports.
An Explorer is a relatively newer entity and is generated by the Looker Studio Explorer tool, which has been available as an experimental feature since 2018. Like reports, Explorers are built on top of a data source. Explorer allows you to explore the data in an ad hoc manner. The relationship diagram with Explorer added looks as follows:

Figure 4.4 – The Explorer entity is the newest addition to Looker Studio
The user who creates an entity – be it a data source, report, or explorer – is deemed the owner of that object and has full control over it, including setting up sharing options, deleting the object, and more. It is possible to transfer ownership of the reports and data sources you create to a different user through sharing options. Once the transfer is complete, you will retain edit access to those assets until the new owner updates your permissions. Organizational users using Google Workspace or Cloud Identity can only transfer ownership within their domain, whereas individual users can do so with any other Google account.
We will discuss these Looker Studio entities and how to work with them in a little more detail throughout this chapter.
Working with data sources
A data source is a foundational element in Looker Studio that lets you explore data and build reports. It is the logical representation of the physical data that resides in external systems such as files, databases, data warehouses, applications, and so on. It defines the schema of the fields sourced from the underlying dataset. It allows you to rename as well as update the data types and formats of the fields. You can also add calculated fields and metrics to enrich the dataset. All this results in a logical data model that facilitates analysis and reporting. Data sources in Looker Studio enable you to create a consistent definition of metrics and representation of data across reports.
Creating a data source
A data source in Looker Studio can be created in two ways: from within a report or directly from the home page. When the data source is created while creating or editing a report, it is scoped for just that report and is referred to as an embedded data source. An embedded data source is not available for use or editing outside the report it was created in. While collaborating with others on building a report, an embedded data source provides the greatest flexibility because all the report editors can edit and manage the data source as needed. In this scenario, the report authors do not have to worry about how the data source impacts other reports. Sharing a report that uses embedded data sources with others shares both the report and the data sources embedded in it with those users.
On the other hand, when the data source is created from the home page using the Create | Data source option, it can be used by multiple reports and is termed a reusable data source. A reusable data source enables you to create and use a consistent data model across the organization. You can share a reusable data source with others with appropriate permissions for them to be able to view, use, or edit the data source. After creating an embedded data source, it is possible to convert it into a reusable data source, if needed, to make it available outside the context of the associated report. A report can use both embedded and reusable data sources together.
Connectors to various data stores, systems, and platforms allow data sources to connect to the dataset and access the data. Google provides several free connectors for you to leverage. This includes connectors to Google products such as Google Sheets, Google Analytics, Google Ads, Search Console, Google Cloud Storage, Google Surveys, Google Marketing Platform, and more, as well as connectors to common database systems such as Google BigQuery, Amazon Redshift, Google Cloud SQL, Google Cloud Spanner, Microsoft SQL Server, MySQL, PostgreSQL, and more. Google also provides a File Upload connector to let users upload CSV data.
Beyond these types of connectors provided by Google, a large number of connectors that support a wide variety of data platforms, applications, and systems are offered by Looker Studio partners. Google enables anyone to create a custom connector through the Looker Studio Community Connectors Program, which is an open source project.
In the rest of this section, we will go through the steps to create these two types of data sources.
Creating an embedded data source
Create a new report by clicking on the Blank Report tile on the home page or by selecting the Report option after clicking the Create button above the left navigation panel, as highlighted in the following screenshot:
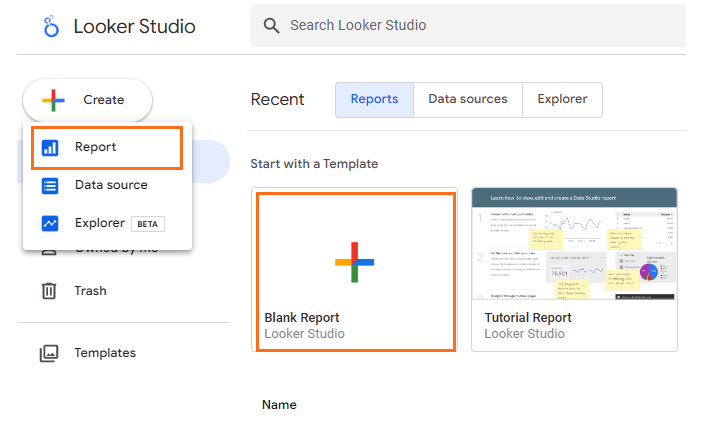
Figure 4.5 – Creating a new report
This creates a blank report and immediately displays the Add data to report screen, as shown in the following screenshot. Browse and search through the plethora of connectors made available by Google and Looker Studio partners. Choose an appropriate one to read the data from the source. For illustration purposes, choose the Google Sheets connector to create a data source from the data stored in a Google spreadsheet:
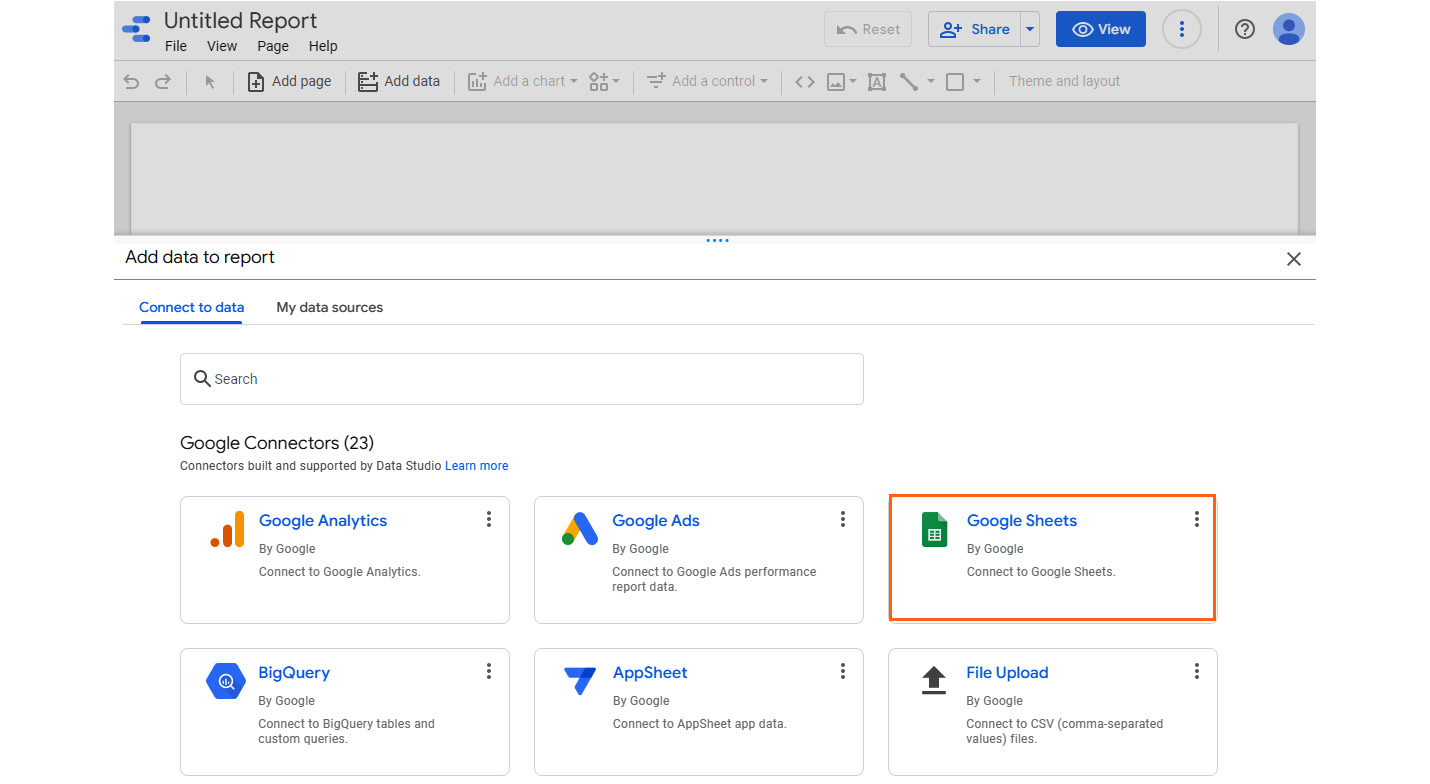
Figure 4.6 – Choosing a connector from the list available
By default, Looker Studio connects to Google Sheets under the same Google account you are using with Looker Studio. When you are adding data from Google Sheets for the first time, you need to authorize Looker Studio to make the connection. This is generally true for any type of connector you are using for the first time. Then, you must select the appropriate spreadsheet and the worksheet that contains the needed data. Under Options, you can confirm if the first row contains column headers and whether to consider any hidden or filtered cells. You can also choose a range of cells from the worksheet as the dataset. The options provided vary, depending on the connector type. Click the Add button and accept any confirmatory message to finish creating the data source:
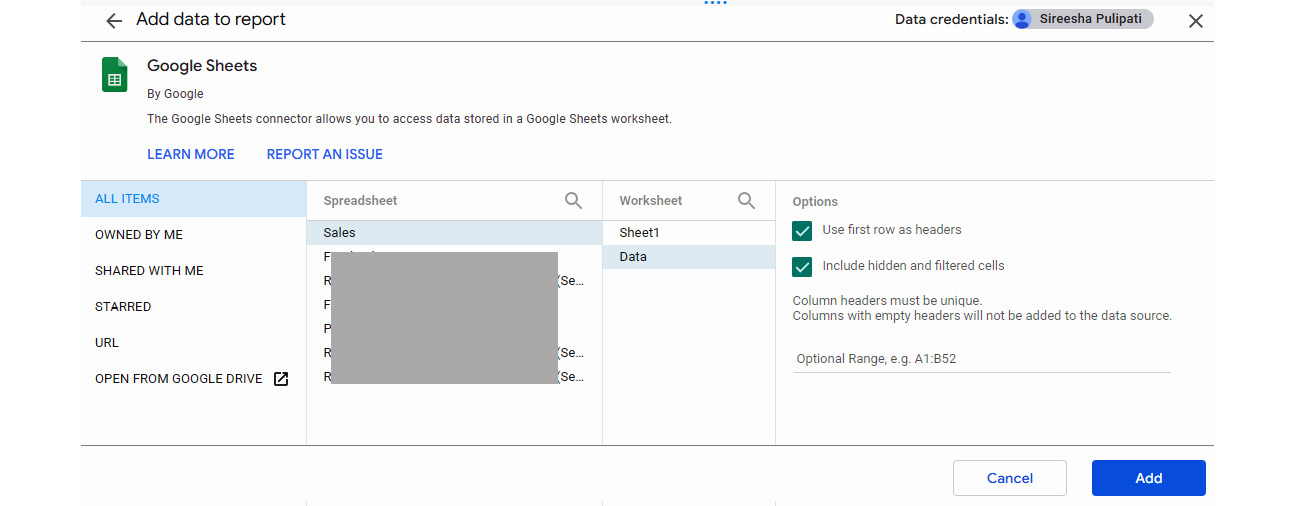
Figure 4.7 – Choosing the dataset – Google Sheets connector options
Follow these steps to create an embedded data source while creating a new report:
- Click on Create | Report or the Blank Report tile on the home page.
- Choose the connector from the Add data to report screen.
- Provide the connection details and authorize Looker Studio to connect to the dataset.
- Select the tables, files, and so on and click Add.
You can add a new embedded data source to an existing report by selecting the Add data icon from the toolbar. This brings up the same Add data to report screen as mentioned earlier. Here, you can proceed with the same steps of choosing a connector and selecting the source file, dataset, table, and so on:

Figure 4.8 – Adding a data source to an existing report
Another place where you can add an embedded data source to a report is from the data sources section of the report. This can be accessed by choosing the Manage added data sources option from the Resource menu:
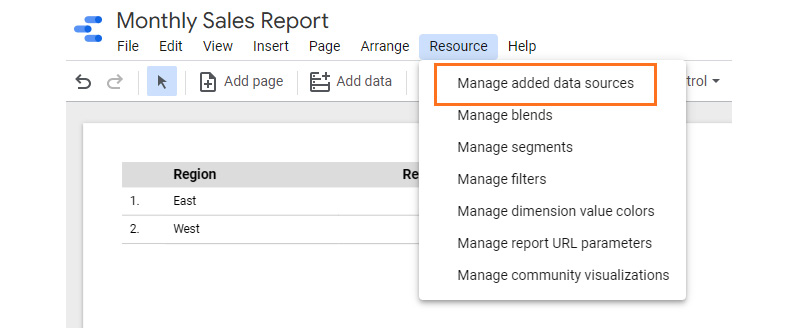
Figure 4.9 – Navigating the list of data sources that were added to the report
From the Data sources pane within the report, click on ADD A DATA SOURCE to add new data to the report:

Figure 4.10 – Adding a data source from the “Data sources” section in the report
Follow these steps to create an embedded data source from an existing report:
- Click on Add data from the toolbar OR choose Resources | Manage added data sources from the menu and click on Add a Data Source from the Report data sources screen.
- Choose the connector from the Add data to report screen.
- Provide the connection details and authorize Looker Studio to connect to the dataset.
- Select the tables, files, and so on and click Add.
You can also add data to the report from the Data panel on the right and the SETUP tab of the chart configuration.
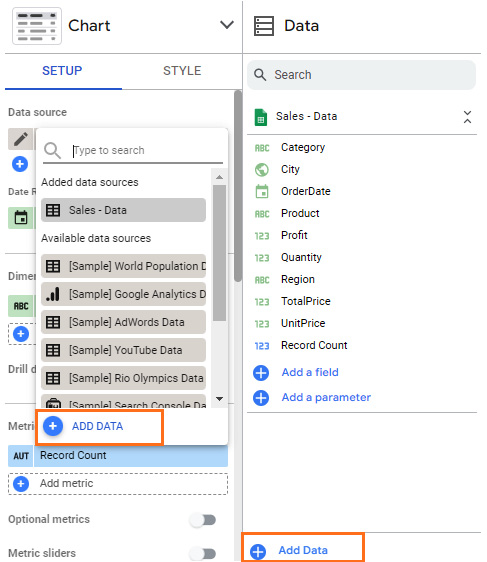
Figure 4.11 – Adding data to the report from the Data panel and SETUP tab
Looker Studio offers this flexibility to make the experience of working with the tool seamless.
Creating a reusable data source
A reusable data source can be created from the home page by clicking the Create button and choosing the Data source option. This brings up the Connectors page, as shown in the following screenshot, where you can find and select the appropriate connector. You can provide a name for the data source in the header:
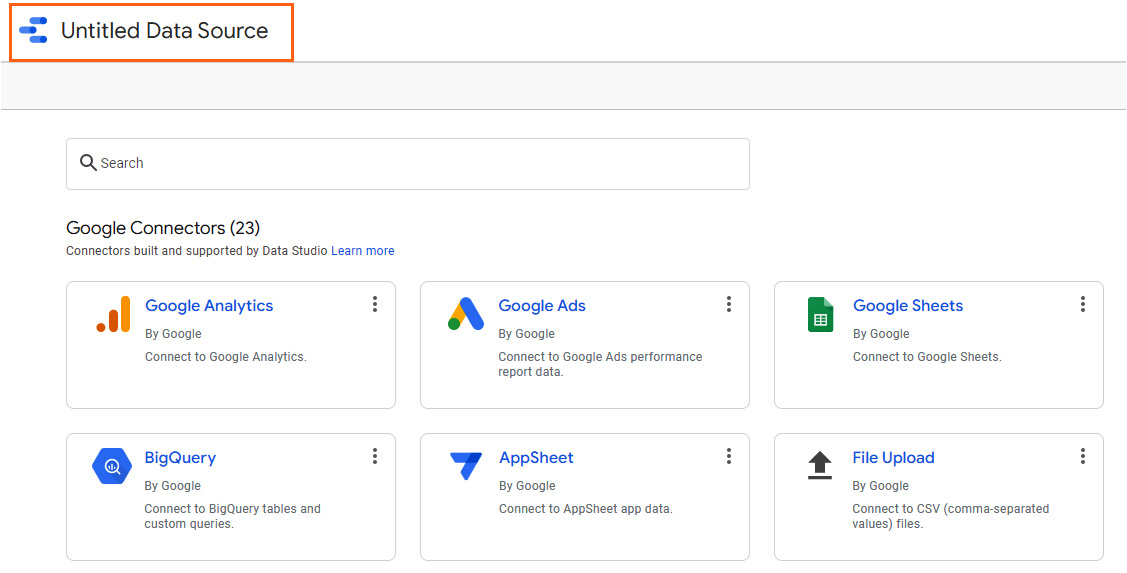
Figure 4.12 – Creating a reusable data source
Follow these steps to create a reusable data source:
- Click on Create | Data source on the home page.
- Choose the connector from the Add data to report screen and proceed with authorization, choosing the dataset steps:

Figure 4.13 – Converting an embedded data source into a reusable data source
You can also convert an embedded data source into a reusable one. However, this is only possible when you own the data credentials that were used for the embedded data source.
Follow these steps to convert an embedded data source into a reusable data source:
- From the report designer, select Manage added data sources from the Resource menu to view the data sources that have been added to the report.
- Click on the Make reusable link to make the data source available to be used with other reports:
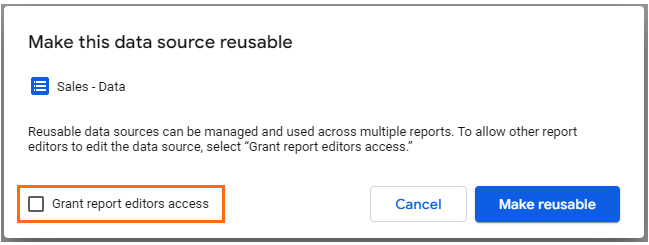
Figure 4.14 – Restricting the level of access to the reusable data source
While the other editors of the report can edit and change the newly converted reusable data source by default, you can uncheck the option to make it read-only for other report editors.
Managing data freshness
Almost always, data sources do not import data into Looker Studio but rather maintain a live connection to the underlying dataset. This is very beneficial in cases when the underlying dataset is huge or is getting frequently updated. Having a live connection ensures that the latest data updates are surfaced in the data sources and reports automatically. The one exception where the data is imported into Looker Studio is when connecting to CSV files.
The underlying dataset is queried separately for individual charts and components in the report. This means that Looker Studio pushes the aggregations and other computations back to the more powerful underlying data platforms whenever possible. However, retrieving the data from the underlying dataset every time can be slow and there is no value in running the same queries and computations again and again, especially when the underlying data doesn’t change. For these reasons, the query results are usually stored in a temporary cache within Looker Studio to provide better performance while exploring the data, building the visuals, or interacting with the reports.
The cache is refreshed automatically periodically. The refresh frequency options available vary, depending on the data source connection and the underlying data platform. For example, the default refresh rate for a Google Sheets data source is 15 minutes, with the other options being every hour, every 4 hours, and every 12 hours. A data source connected to Big Query, however, has a default refresh rate of 12 hours and provides more granular data freshness options, and can be set in increments of minutes and hours ranging from 1 to 12 hours. The appropriate data freshness frequency is generally guided by one or more of the following aspects:
- To match the update frequency of the underlying dataset
- To optimize the query cost of underlying paid data services
- To improve the performance of the Looker Studio reports
The last point implies that there is usually a performance impact on a report while its data source refresh is happening. Depending on the size of the report and the number of queries generated, the refresh may take a while. It’s important to set the data refresh rate that balances the data freshness needed, the performance of the report, and the cost incurred by the underlying platform, if applicable. You can view and choose the frequency of data freshness for a data source from its Edit screen:
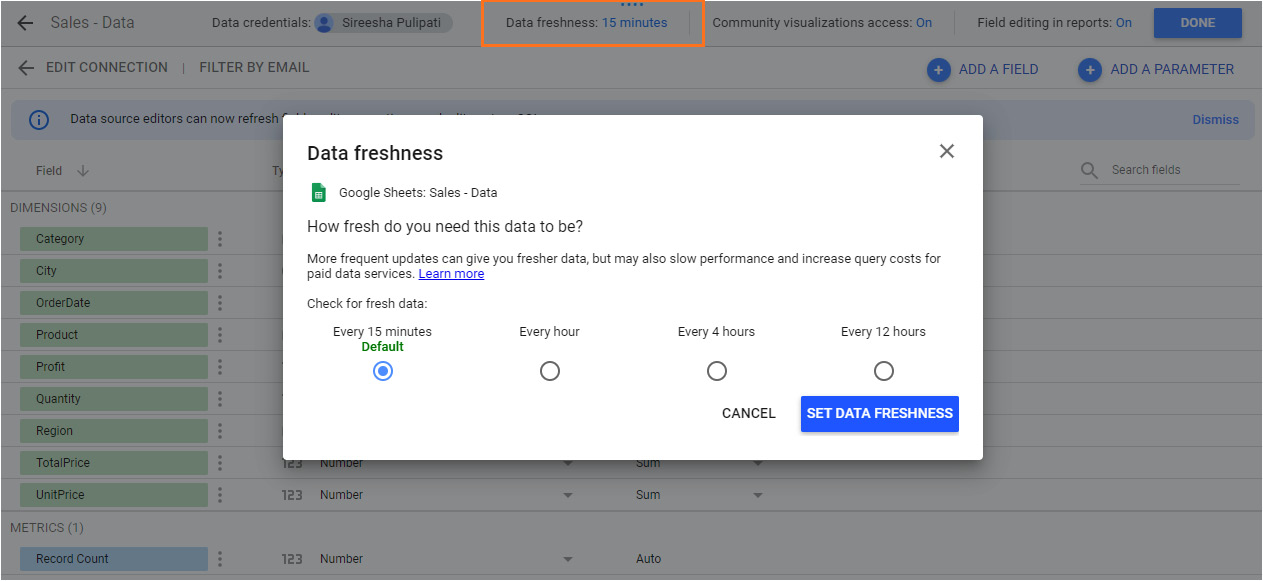
Figure 4.15 – Choosing the appropriate data freshness for the data source
One exception to the live connection is the File upload connector. If you have your data stored in local CSV files, it is not possible to make an online connection to the files. You need to upload the files to Looker Studio to create a data source for this dataset. Looker Studio stores these files in Google Cloud Storage, which is the object storage service provided by Google Cloud. There are certain restrictions as to the format of the files and limitations concerning the size and number of files that can be uploaded by a user.
At the time of writing, there is a 100 MB file size limit per dataset. Also, an individual user can only use 2 GB of storage in total across all such data sources. You can refer to the official Looker Studio documentation to learn more about these limitations.
If your dataset is split across multiple CSV files with the same structure – that is, the same fields are in the same order – Looker Studio allows you to upload these files together to form a single data source:
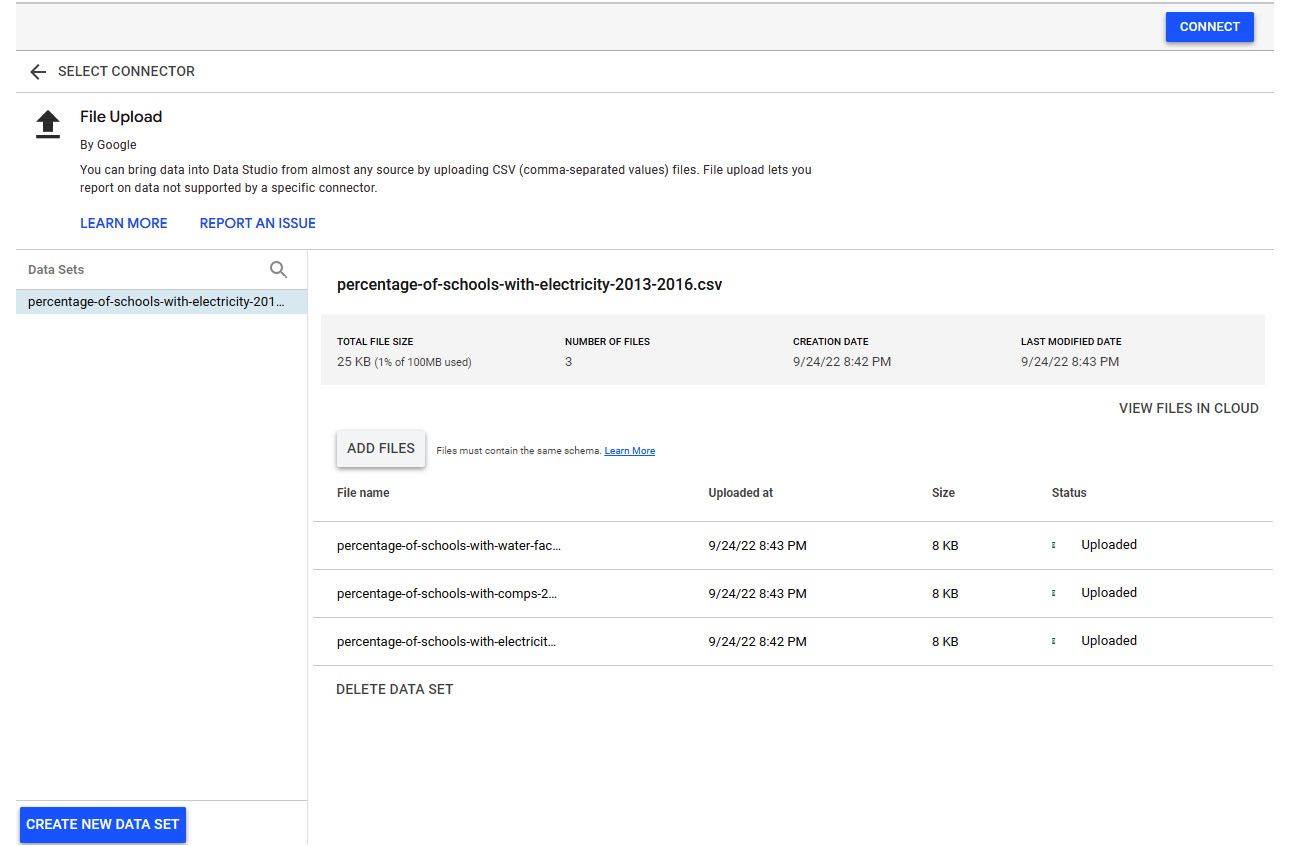
Figure 4.16 – Creating a data source from multiple files using the File Upload connector
Controlling data access
While creating a data source, you make the connection to the underlying dataset by providing your own data credentials. These are referred to as Owner’s credentials. When you share this data source or a report with others using this data source, they will be able to view the data, even if they do not have access to the underlying dataset. You can have a data source use Viewer’s credentials instead, which requires anyone who is using this data source to have their own credentials to access the data. You can change the type of credentials while editing the data source, as shown in the following screenshot:
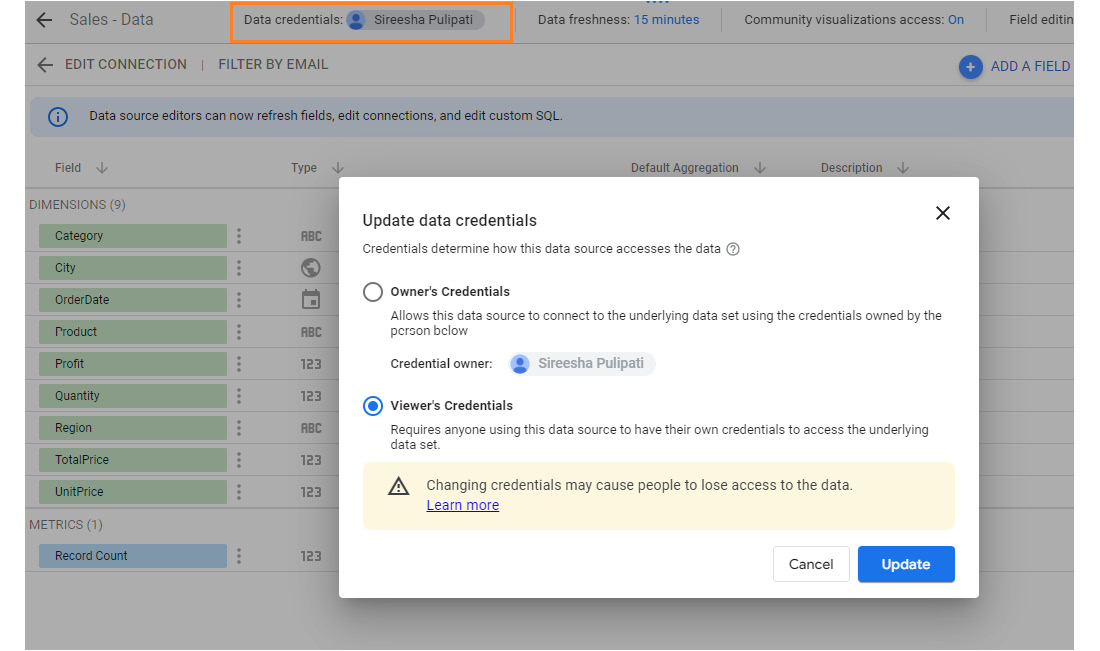
Figure 4.17 – Updating the data credentials for the data source
Using Viewer’s credentials with the data source provides better data security and ensures that unauthorized users cannot see the data, even if they could access the report itself.
Sometimes, you may want to restrict access to a subset of data in the data source based on who views the report. A common scenario is where different salespeople need to see different records of the sales data based on the territories they belong to. One approach is to build different data sources and corresponding reports pre-filtered for each territory or salesperson. But this would be a very inefficient and unwieldy approach resulting in a large number of data sources and reports to maintain. The best way to handle this is to define a single data source and filter the underlying dataset dynamically based on who is logged in. You can implement the email filtering feature for the data source, which lets you choose a field in the dataset that contains the email of the user who can see each row of data.
Follow these steps to enable email filtering for a data source:
- Select Resource | Manage added data sources from the menu and click the pencil icon for the concerned data source. This opens the Data source edit screen.
- Click Filter by Email at the top.
- Check the box for Filter data by viewer email and click Select email field to choose the field that contains the email address of the users to filter by. It is essential that this field contains the full email address and also that the text matches the case of the user account exactly. Any case mismatches will result in a filter mismatch:
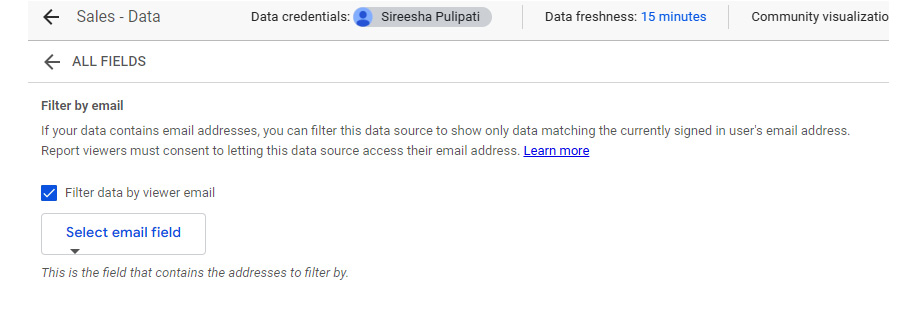
Figure 4.18 – Filtering the data based on the email of the user accessing the report
Generally, when a Looker Studio report is made publicly accessible, anyone will be able to view the report without requiring them to use a Google account. However, when the Filter by Email feature is enabled for a data source, report viewers must sign in to view the related reports and consent to allow their email address to be used by the data source to show them the relevant data:

Figure 4.19 – Users need to grant consent when email filtering is enabled for a data source
Email filtering applies to report editors as well. They will only be able to view the data that is mapped against their email ID. A user only needs to grant consent once per data source within a report. At any time, users can revoke their consent to stop providing their email addresses to the reports from Looker Studio’s Settings area, as follows:
- From the Looker Studio home page, click Settings (gear icon) at the top right.
- Select the Revoke Consent tab from the left panel and click the Revoke all button. This prevents all the reports and data sources from using their email addresses to filter the data:

Figure 4.20 – Revoking consent to allow reports and data sources to use your email address to filter the data
At the time of writing, it is not possible to revoke consent for individual data sources and reports. Once the consent is revoked for all content, the user can explicitly allow only specific reports and data sources to use their email address.
This is a simple example where each row in the data source can be viewed by only one user, with the email address field in the dataset storing only a single address. Often, you may want to allow multiple users to look at the same set of data. This can be achieved in Looker Studio using data blending, which we will cover in Chapter 7, Looker Studio Features – Beyond Basics.
Editing a data source schema
When you open a reusable data source or choose to edit an embedded one, you will find that all the fields from the dataset are listed under the Dimensions group. A default metric called Record Count is also added under the Metrics group. While the dimension field contains a value for each row of the dataset, a metric is a summary field that is computed across multiple rows of data on the fly when used in the charts. Dimension fields are typically used to group the data in charts and the metrics are aggregated for the selected dimensions. Dimension fields can be added as metrics in the chart configuration, which applies the Count Distinct aggregation to the non-numerical fields and the defined default aggregation method for the numerical dimension fields.
Looker Studio detects the data type of the fields automatically based on the underlying dataset. While Looker Studio does a decent job recognizing the appropriate data types, you may want to adjust them in the data source settings to meet your analytical and reporting needs. For example, defining the right geo dimension type is key to visualizing the data in maps. You can also set numerical fields as percentages or in terms of duration in seconds to allow the data to be represented appropriately in the charts.
For each field, you can define a default aggregation method in the data source. Default aggregation is the method of aggregation – that is, sum, average, median, and so on – and is computed in a visual by default when a field is added to it. By default, Looker Studio sets the default aggregation to None for all non-numerical dimension fields, Sum for all numerical dimension fields, and Auto for all metrics. The Auto method implies that the metric is already an aggregation and cannot be further aggregated. For numeric dimension fields, you can define the appropriate aggregation method. For example, you can change the default aggregation method for percentage or ratio fields to average or median. You can also rename the fields to be more user-friendly just by typing in the new name over the old one:
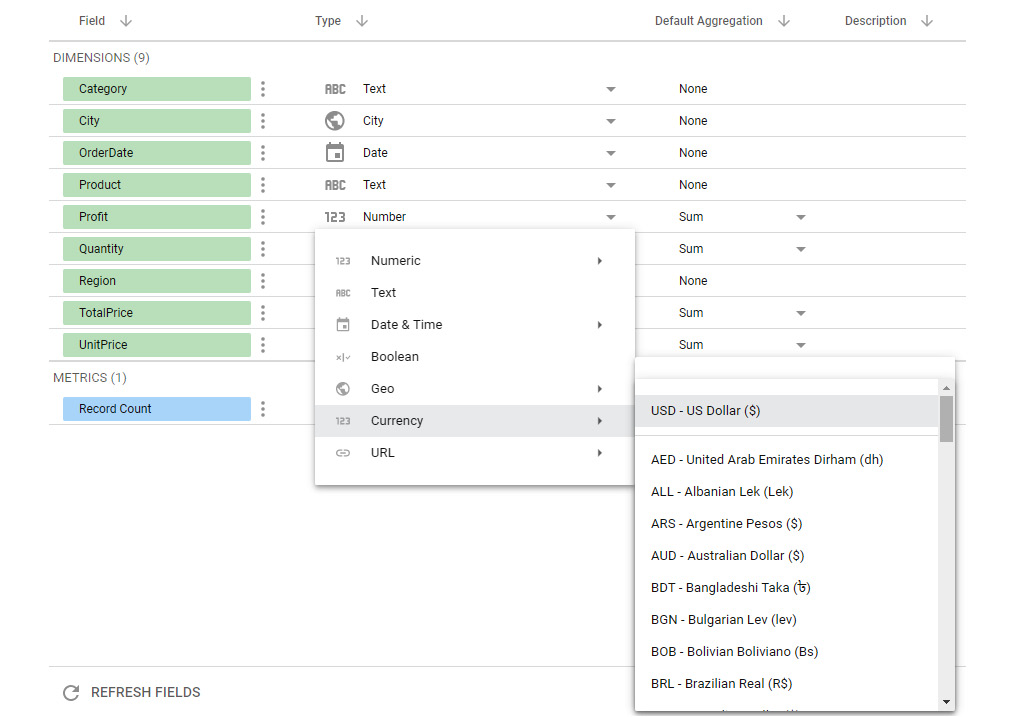
Figure 4.21 – Editing the data types of the data source fields
It is possible to change the aggregation method, data type, and format from the default choice to something else as needed in each of the charts while building a report. Making this change at the data source level, however, ensures that the right aggregations and data formats are used consistently across different visuals by default:


Figure 4.22 – Creating calculated fields
You can enrich the data source by adding new calculated fields derived from the native fields by applying business or conditional logic, performing arithmetic operations, and manipulating text fields. A calculated field can be a dimension or a metric. The preceding screenshot shows both examples.
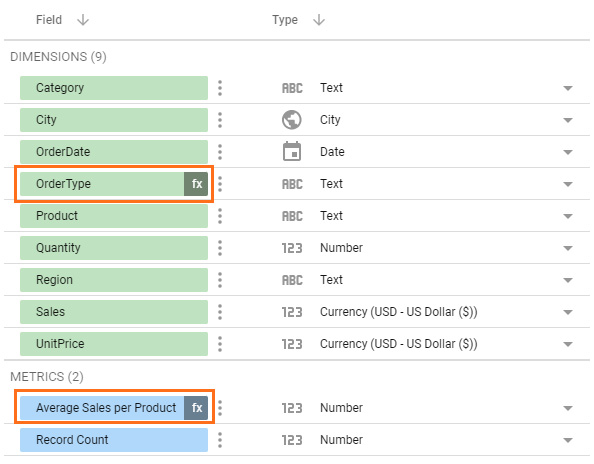
Figure 4.23 – Calculated fields in the data source field list
The calculated fields are denoted with “fx” in the fields list to differentiate them from the regular fields. We will go through some common functions and the calculated fields you can create from them in Chapter 7, Looker Studio Features – Beyond Basics.
You can hide any data source fields that you do not want to expose to report editors. Click the ellipsis for the field and choose the Hide option. The hidden fields are grayed out on the data source’s page and do not appear under Available Fields in the report designer. Exposing only derived fields and hiding the corresponding regular fields is a common scenario. For example, you can hide the “first name” and “last name” fields and show only the concatenated full name derived field. Another example is when you want to prevent report editors from changing the method of aggregation for any field. You can create a calculated field with the desired aggregation and hide the original field.
Report editors can change field definitions while configuring charts and controls. They can change the display name, data type, output format, and aggregation for any visible data source fields. By default, Field editing in reports is enabled for all new data sources. It can be disabled, if desired, from the top of the data source editor page. It helps you, as the data source editor, to completely control how the fields are displayed and used in reports.
Other common data source operations
Beyond editing the schema and managing data freshness and access, a few other common things that you can do with a data source include duplicating or copying the data source, sharing the data source, and more.
Copying a data source
You may want to copy a data source to make it easier for you to create different customized versions of the same dataset. When you create a data source copy, you may have to reconnect to the underlying dataset to confirm your access. The data source copy typically has the same list of fields, including the calculated fields, the same data types, aggregations, and more. If the reconnected dataset in the copied data source differs from the original dataset, you can see the changed fields and update any dependent calculated fields accordingly. If you are not the owner of the data source that you are copying, you can update the credentials for the copy with your own.
Copying an embedded data source creates another embedded data source within the same report. Copying a reusable data source from the home page will result in a reusable data source:
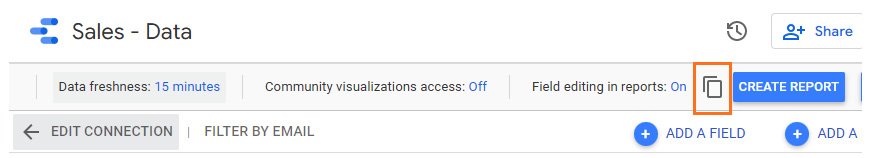
Figure 4.24 – Copying a reusable data source from the home page
However, when you duplicate a reusable data source from within a report, it results in an embedded data source. Be mindful not to create copies of data sources thoughtlessly if they do not serve any distinguished purpose as this proliferation can quickly become unmanageable and confusing.
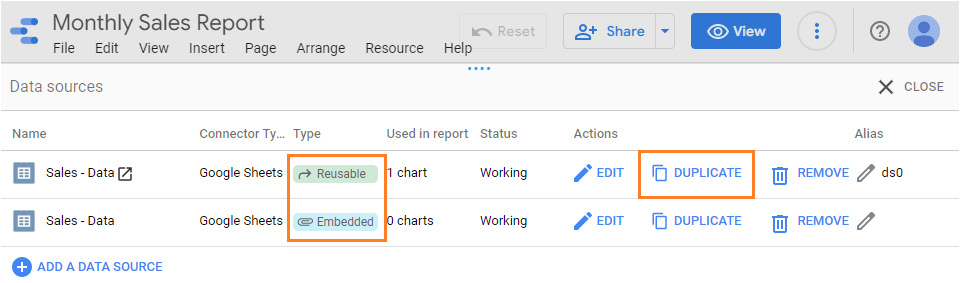
Figure 4.25 – Duplicating a data source from within a report
Sharing a data source
An embedded data source is part of the report it is created from and is shared through the report itself. You can share a reusable data source with others by selecting the Share option and providing the user’s emails and level of access (view versus edit). While sharing, you can manage access through controls such as disabling copying for viewers, preventing editors to add new people, and so on.
Follow these steps to share a data source with others:
- Open the data source and click on the Share button at the top right of the data source. Alternatively, from the home page, select Share from the options under the ellipsis on the right for the listed data source:

Figure 4.26 – Sharing a reusable data source
- Add the user’s emails and choose the appropriate access – that is, Can view or Can edit:
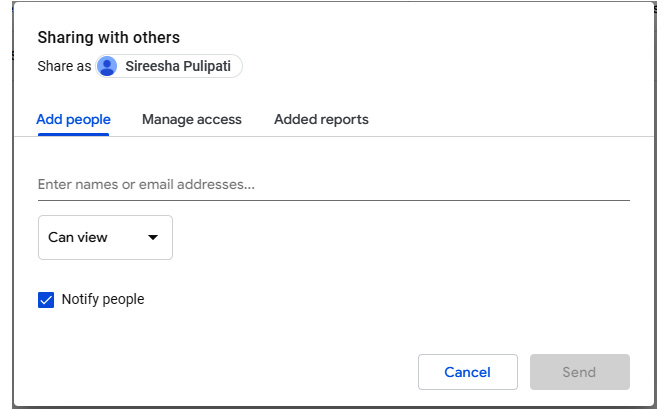
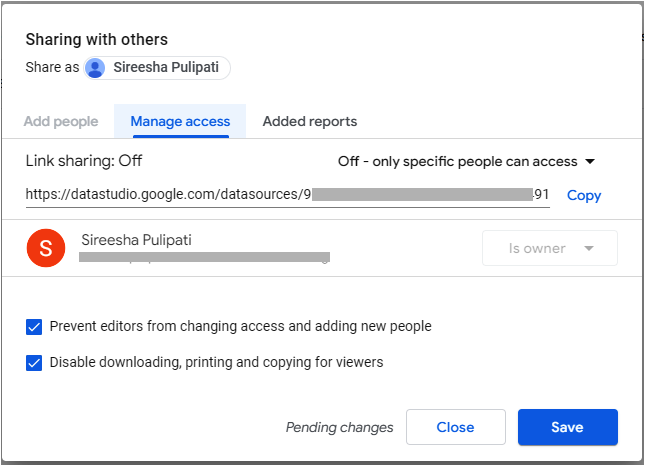
Figure 4.27 – The sharing options for a reusable data source
- Under Manage access, you can enable sharing through the data source link. You can choose to have the link work for anyone or only for those to whom you have explicitly given access.
The sharing dialog box also allows you to view the list of reports that have been added to this data source and remove the association for any, as needed:
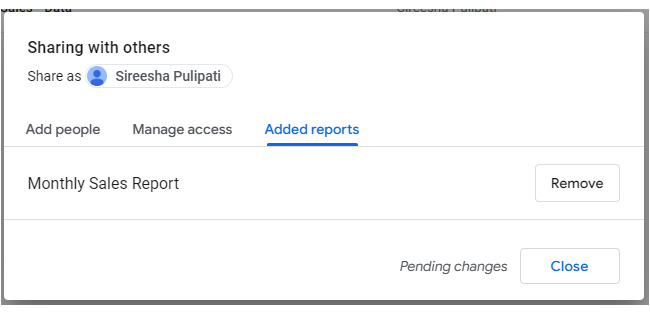
Figure 4.28 – View reports added to the data source
Transferring ownership
Any data source that you create is owned by you by default. An asset can only have a single user account as an owner at a time. You can transfer ownership to a different user through sharing settings. You can only transfer the ownership of assets that you own. One caveat is that it is not possible to transfer the ownership of a File Upload data source.:
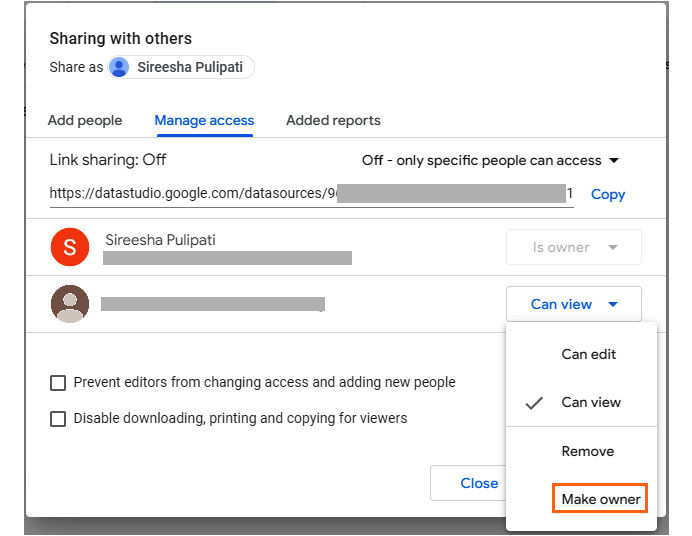
Figure 4.29 – Making a different user the owner of the data source
The steps for this are as follows:
- Open the Sharing with others dialog box from the top of the report.
- From the Manage access tab, make sure that the data source is shared with the new intended owner, either as a viewer or an editor. If not, add them from the Add people tab, click OK, and reopen the sharing options.
- From the Manage access tab, expand the dropdown beside the user and choose Make owner. Click Yes in the confirmation dialog box:

Figure 4.30 – Transferring ownership
The credentials that are used for the data source are retained post the ownership transfer until the new owner updates them. You can manually revoke your credentials post the transfer from the home page. Follow these steps:
- From the Looker Studio home page, select the Data sources tab.
- Find the data source in the list or search for it at the top.
- Expand the ellipsis and select Revoke credentials:
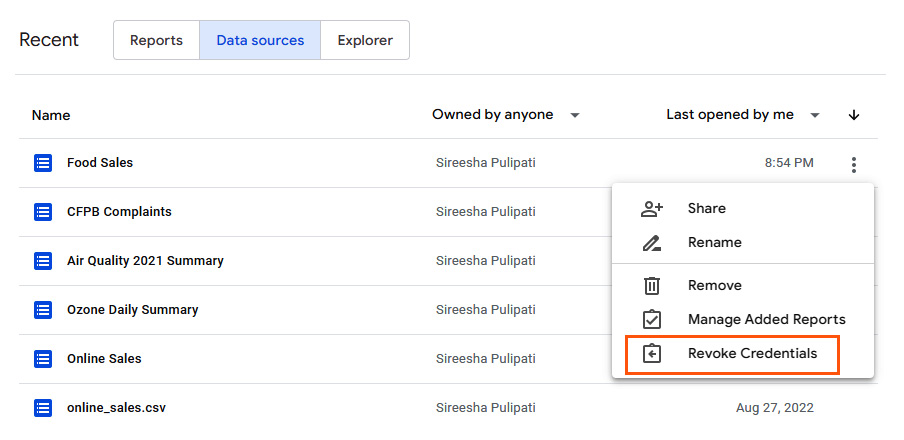
Figure 4.31 – Revoking data source credentials post ownership transfer
Once you revoke your credentials, the data source will not be able to connect to the underlying dataset until the data source credentials are updated.
Others
Apart from the operations we’ve discussed so far, you can also edit the connection details for a data source, refresh the fields, rename the data source, delete the data source, and more. For a reusable data source, you can view the list of all the reports using it and manage them using the Manage added reports option that’s available from the ellipsis menu on the home page. This allows you to see whether the data source has been set up properly for a report or detach a report from the data source:
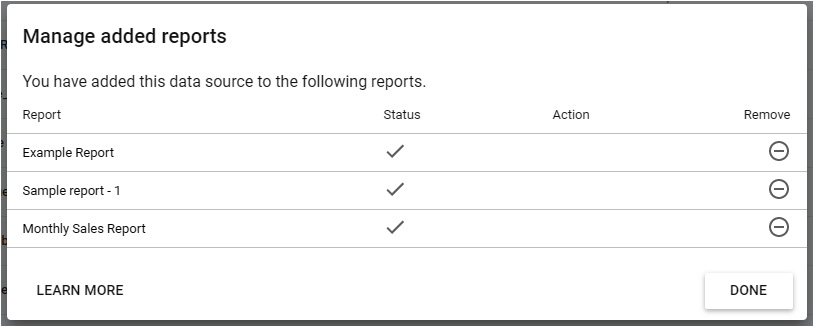
Figure 4.32 – Managing the added reports for a data source
You can also revoke the credentials that are used for a data source, which prevents the data source from connecting to the underlying dataset until the credentials are updated.
Working with reports
A report in Looker Studio is an asset or entity that enables you to build data stories in the form of dashboards and reports. Conceptually, a dashboard is a centralized tool that provides an at-a-glance view of key performance metrics. It is usually limited to a single page or screen and displays information at a summary level. On the other hand, a data report is an organized representation of data in visuals and text with enough detail. A report usually spans multiple pages to provide a comprehensive analysis of the concerned topic. A more detailed list of the differences between the two forms of data presentation was provided in Chapter 1, Introduction to Data Storytelling.
Creating a report
You can create a new report either from the home page or from within another report. The first step when creating a report is to add a data source to it. While creating the report, you can either create an embedded data source specific to that report or select an existing reusable data source.
Follow these steps to create a report from the home page:
- Go to the home page.
- Click on Create | Report OR click on the Blank Report template.
- Create a new data source or choose an existing reusable data source from the Add data to report screen:
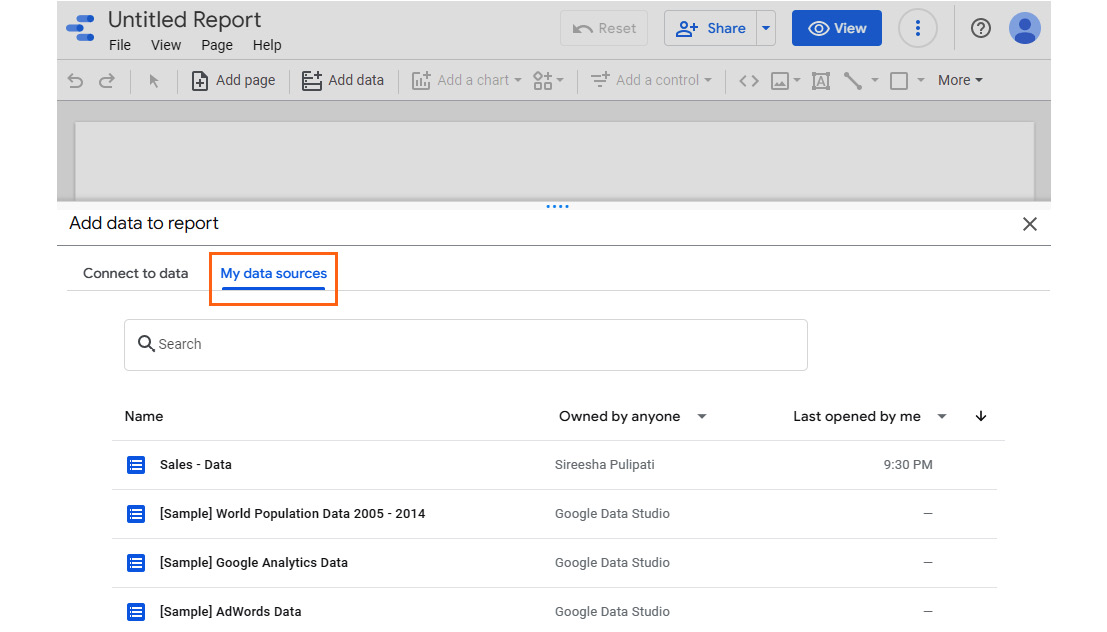
Figure 4.33 – Adding an existing reusable data source to the report
Now, you must create a new report from within another report:
- Make sure you have the report open in edit mode.
- From the menu, choose File | New Report.
You can also create a report directly from a reusable data source:
- Open the data source from the home page.
- Click on Create Report button at the top right.
A new report will open in a separate browser tab:
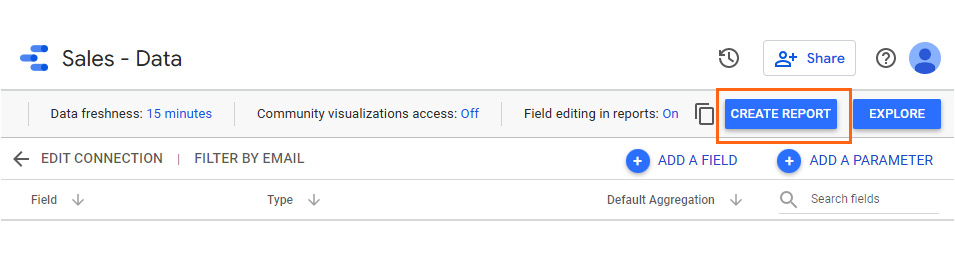
Figure 4.34 – Creating a report from the reusable data source
A report has two different modes that you can interact in – Edit mode and View mode.
When you have just created a new report, the report is opened in Edit mode. In this mode, you can design and build your report by adding and editing charts, pages, filter controls, and other components. You can preview the report by switching to the “read-only” View mode. View mode enables you to see and interact with the report as the end users would. Historically, Edit mode didn’t allow for much interactivity and required report editors to switch to View mode to understand how the visualizations change based on user interaction with filters and other controls. This has changed since November 2021 when interactivity was added to Edit mode, greatly improving the report-building experience:

Figure 4.35 – Toggling between the Edit and View modes
As a report owner or editor, you can switch between Edit and View mode by clicking on the toggle button at the top. Users with only view access to the report will not see the Edit toggle.
Creating a report from a template
A report template allows you to look at your data quickly and provides a ready-to-use finished product. It also serves as a great starting point when you need a customized report. The template gallery on the Looker Studio home page provides several report templates created by Google using datasets with a standard schema such as Google Analytics, Firebase application analytics, Ads, and so on using publicly available data.
A larger number of templates are available in the Report Gallery available at https://datastudio.google.com/gallery that have been submitted by partners and the community.
Report templates from Gallery come with data controls added at the top for each of the data source used in the template. Data controls allow you to quickly replace the default data with your data sources so that you can see how the template looks with your data. Alternately, a template can also just come with a data source that has been shared with you, in which case you can just make a copy by clicking Edit and Share and work with the report as needed. From the template's data controls, select Use my own data and click Replace data to choose your data sources:

Figure 4.36 – Adding data to a template in place to understand how it looks with your data
The list of fields and metrics available in your data source schema should match those in the data source that was used to build the report template. If any fields are missing or if there’s a mismatched data type, the charts and controls in the template may be broken. You cannot edit a template until you convert it into a report by clicking the Edit and share button. This creates a copy of the template as a report, which you can then edit to add data, modify charts, and so on just like any other report.
If you copy the template as a report without replacing the original data sources using Replace data, the report will contain errors if you have only view access to the data sources used with the template.
Follow these steps to create a report from a report template:
- Click on a template from the featured list on the home page. Alternatively, go to Template Gallery (from the left navigation panel or the top-right link on the Reports home page) to view the full list of templates available and click on the one you want to use. This opens the template.
- Select Use my own data from the top of the template and click Replace data to choose your data for each of the data sources
- Click the Edit and share button at the top right to turn the template into a report.
Publishing a report
By default, any changes made to the report are automatically shown to the report viewers. Often, when you are making substantial or time-consuming changes to a report that has already been shared with others, you may not want the viewers to see the work-in-progress state. The Report publishing feature allows you to control when the viewers can see the changes. You need to explicitly enable this feature for a report.
Follow these steps to enable Report publishing:
- Open a report in Edit mode.
- From the menu, choose File | Publishing settings.
- Toggle the manual Report publishing button on and click Save:
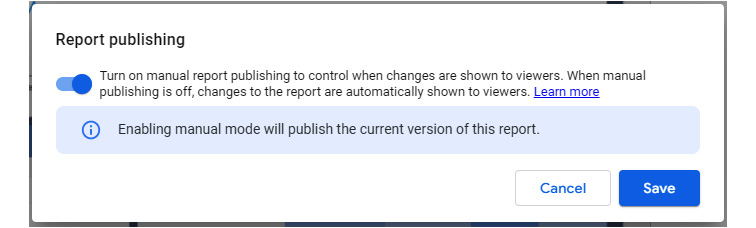
Figure 4.37 – Turning on manual report publishing
When Report publishing is turned on, the report designer displays a Publish button to allow report editors to manually publish the changes when appropriate. As a report editor, you can switch between the work-in-progress Draft version and Published version to view the differences and understand the changes:
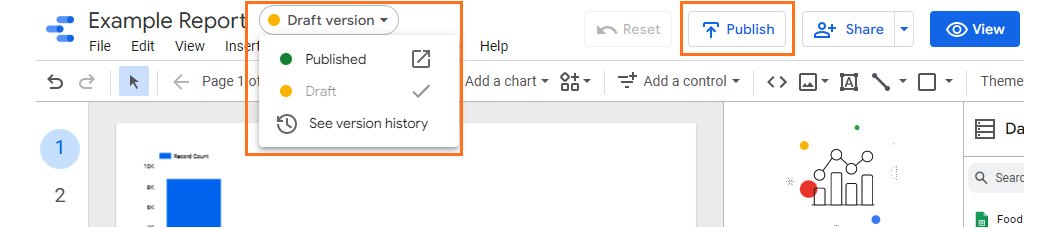
Figure 4.38 – Report features with publishing turned on
Sharing a report
You can share a report with others in different ways:
- Inviting people
- Scheduling email delivery
- Sharing the report link
- Embedding the report
- Downloading the report
As with data sources, you can share Looker Studio reports by providing the names or email addresses of the users and choosing the appropriate level of access.
Follow these steps to share a report with others by inviting them:
- Click on the Share button at top of the report or choose File | Share from the menu. This will open the Sharing with others dialog box.
- Under the Add people table, provide the names or email addresses of the people you want to add.
- Choose whether to give those people View or Edit access.
There are additional controls under the Manage access tab on the Sharing with others screen that affect what people with access can do with the report and how they can find and share the report:
- You can prevent report editors from sharing the report with more people or changing the access of the existing users.
- You can disable downloading, printing, and copying operations for report viewers.
- You can enable broader sharing of the report through a web link by turning on the Link sharing feature. This also allows you to restrict the level of access for users who have the report link:
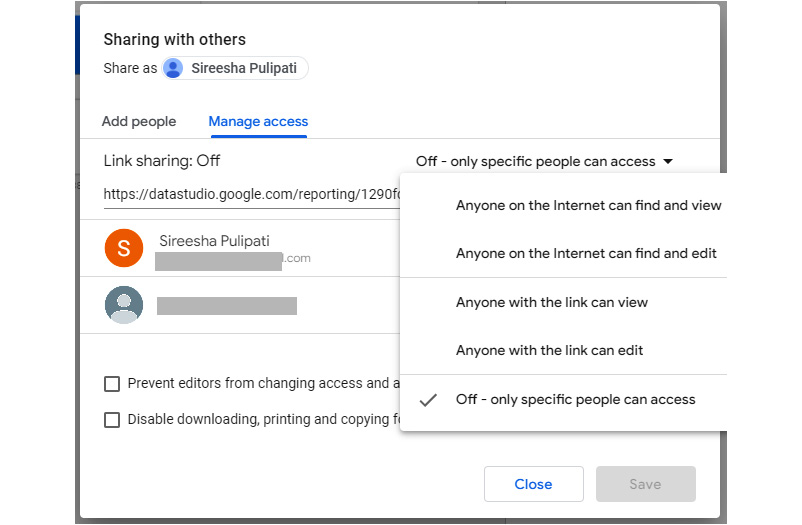
Figure 4.39 – Managing the access of the people that the report is shared with
You can also obtain the link to the report directly by selecting the Get report link option from the dropdown attached to the Share button.
Follow these steps to share a report using its link:
- You can get the report link in two ways:
- Expand the sharing options by clicking on the drop-down icon beside the Share button at the top of the report. Then, select Get report link.
- Click on the Share button at top of the report or choose File | Share from the menu. This will open the Sharing with others dialog box. Switch to the Manage access tab and find the link under the Link sharing section.
- Copy the link and share the link with the users through other means – email, chat, and so on.
Please note that whether the people who have the link can access the report depends on the Link sharing options you have set up, as shown in the following screenshot:

Figure 4.40 – Getting a link to the report for sharing with others
Another way to share a report is to email a snapshot of the report to the users on a scheduled basis.
Follow these steps to share the report via scheduled email delivery:
- Expand the sharing options by clicking on the dropdown icon beside the Share button at the top of the report. Then, select Schedule email delivery.
- Provide the email addresses of the recipients.
- Optionally, customize the email subject and message.
- Set the start date and time to begin the schedule. The time zone is set to that of your operating system.
- Choose the frequency of the email delivery – daily, weekly, monthly, every weekday, or define a custom frequency:

Figure 4.41 – Setting up scheduled email delivery of the report
Each recipient will receive an email with an attached PDF of the report. The email body includes a preview of the report and a link to it. One prerequisite for successful delivery is that the report PDF needs to be generated successfully. You will be notified by email if your scheduled email report fails to go out.
Note
Do not share a report that has email filtering enabled using scheduled email delivery. This is because the report PDF will be generated based on the access of the user creating the schedule rather than that of the recipient of the report. Always share such reports by sending the report link directly.
It is possible to embed Looker Studio reports in your applications, which enables you to distribute your report broadly and does not require viewers to visit the Looker Studio site. Looker Studio provides you with the embed code or URL that you can add to your applications. You can either embed the report as an iFrame using code or using the oEmbed format with the embed URL.
Follow these steps to embed a Looker Studio report:
- Expand the sharing options by clicking on the dropdown icon beside the Share button at the top of the report. Then select Embed report. Alternatively, choose File | Embed report from the menu.
- Select Enable embedding for the report, if you haven’t done so already.
- Choose either the Embed code or Embed URL option. You can set the iFrame size with the Embed code option.
- Choose COPY TO CLIPBOARD and add it to your application.
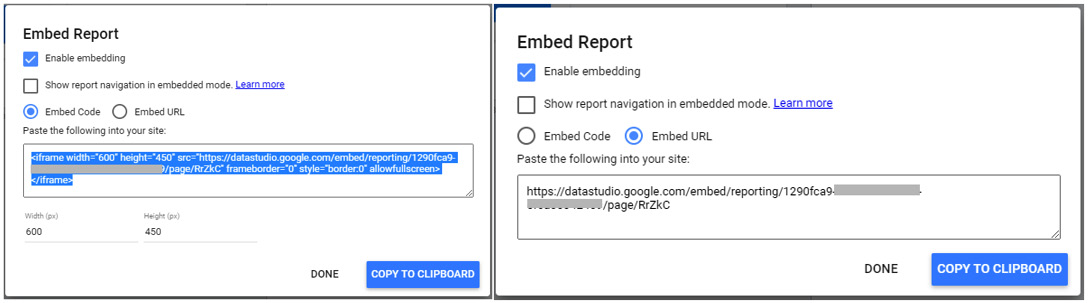
Figure 4.42 – Embedding a report
An embedded report is fully functional and the viewers can interact with the report components and navigate around just like they can when they view it on the Looker Studio site. The security and access controls you have set for the report are reflected in the embedded reports as well. If you have made your report publicly accessible, anyone viewing your application or website can view the report. On the other hand, if you have restricted access for the report to only specific users or groups, only those users can see the embedded report in your application. These users need to be logged into their Google accounts to be able to see the report. The same applies to the reports enabled with email filtering.
You can also download a snapshot of the report as a PDF, which can then be shared via other means. Downloading large, complex, multi-page reports may lead to network timeout issues and cause the download to fail or download only a partial report. You can try to download at a different time or consider downloading only a subset of the report pages. Keep in mind that once a report is exported and downloaded, any access restrictions that were put in place in Looker Studio no longer apply to that copy.

Figure 4.43 – Downloading a report as a PDF
Follow these steps to download a report:
- Expand the sharing options by clicking on the dropdown icon beside the Share button at the top of the report. Then, select Download report. Alternatively, choose File | Download report as | PDF from the menu.
- Choose to download all pages or specific pages only
- Optionally, choose one or more of the following options:
- Ignore custom background color
- Add a link back to the report
- Password protect report
- Click Download.
Transferring ownership
You can transfer the ownership of a report that you own to another user from the Sharing settings. Any user who can access the report can be made the owner by choosing Make owner from the permission options. Any data sources that the report uses will continue to use the previous credentials post-transfer. The new report owner can edit and update the connection settings and credentials for data sources embedded within the report. However, reusable data sources used within the report cannot be edited by the new report owner and need to be transferred separately.
You can transfer reports that use File Upload data sources. The new report owner will be able to view the data and, in the case of an embedding data source, edit the connection settings and refresh the data source.
Other common report operations
A couple more useful operations that you can perform on a report include creating a copy of the report and refreshing all the data within a report. Let’s take a look.
Copying a report
You can copy any report that you have view access to unless it is specifically disabled for viewers. Report editors and owners can always copy a report. Duplicating a report enables you to use and modify a report that you do not own. Making copies of a report also helps you easily create different variations of it without the need to build them from scratch.
Copying a report copies all the report components and controls. However, this operation does not copy the data source. While copying a report, you need to choose a data source to use with the copied report.
Follow these steps to copy a report:
- Select the Make a copy option from the ellipsis at the top of the report. Alternatively, in Edit mode, choose File | Make a copy from the menu.
- Select the new data source(s) to use with the copy. They can be the same as the original data sources or different.
- Click Copy Report.
If you do not have access to the original data source, it will be displayed as unknown in the Copy dialog box. Here, you must select a new data source that you have access to or create a new one that can support the report elements.
Refreshing the report data
The data displayed in a report could be served by directly querying the underlying dataset or serving it from the cache. The cache is automatically refreshed based on the Data Freshness frequency set for each of the associated data sources. However, report editors can refresh the data for a report on-demand by selecting the Refresh data option, as shown here:
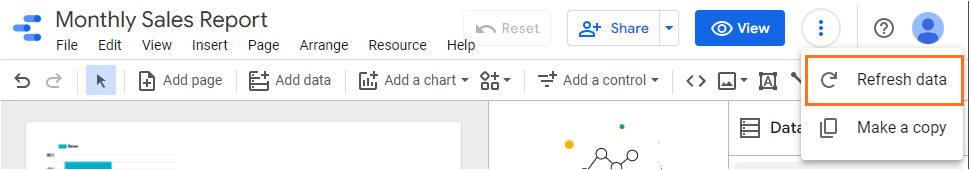
Figure 4.44 – Manually refreshing the report data
This updates the cache for all the data sources used in the report. If any schema changes are made in the underlying dataset, such as adding additional columns or modifying data types, those changes can only be reflected within the report by reconnecting to the data source. This requires edit access to the data source.
Working with Explorer
Looker Studio Explorer is an exploration tool that enables you to quickly examine the data and obtain insights faster. It provides you with a temporary scratch area where you can easily explore the data and perform ad hoc analysis. Within an Explorer, you create explorations in one or more tabs. Any work you do in an explorer is not saved automatically, unlike reports and data sources. However, you can save your exploration if you wish for later use. Even though Explorer has been available to users for a while, it is still an experimental feature at the time of writing. What this means is that the functionality may change at any time and swiftly, potentially in a disruptive manner.
You can either explore a data source or a chart in a report. Having a separate place to explore the data means that you do not have to create and manage a report if all you need to do is look at the data and understand it. Likewise, you can explore any chart in a report and perform ad hoc analysis on it without having to edit the report.
The Explorer interface provides the same chart controls and design elements that are available for reporting. You can add any charts you build in Explorer to a new or existing report:

Figure 4.45 – Explorer user interface
While explorations are and look different from reports in many ways, they differ in a couple of significant ways:
|
Report |
Exploration |
|
Reports and their changes are automatically saved |
Explorations and their changes are not automatically saved unless explicitly saved by you |
|
Can be shared with others |
Cannot be shared with others; you need to export visuals to a report and share the report |
Table 4.1 – Differences between a report and an exploration
Note
Given the experimental nature of the Explorer feature, it is very likely that the functionality described in this section may differ drastically by the time you read this. However, it is the expectation that the basic premise of “an exploration” as a temporary, private space for quick and dirty data exploration will still hold.
Creating an Explorer
You can create an explorer in one of three ways:
- Directly from the home page
- From the data source
- From a chart in a report
Follow these steps to create an explorer from the home page:
- Click on the Create | Explorer option at the top left.
- Select an existing data source or create a new one:
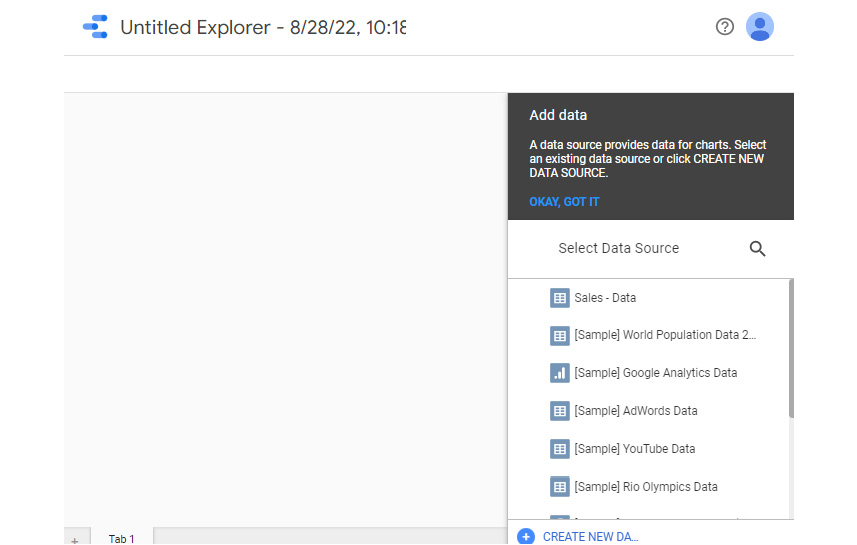
Figure 4.46 – Creating an explorer from the home page
You can only explore a reusable data source.
Follow these steps to create an explorer from a data source:
- Open the data source in Edit mode (from the home page or the report’s data sources screen).
- Click EXPLORE at the top right:
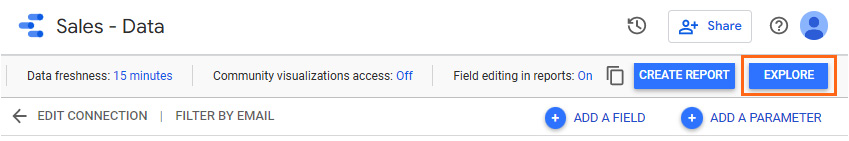
Figure 4.47 – Creating an explorer from a data source
Follow these steps to create an explorer from a report:
- Open the report
- Right-click on a chart in the report and choose Explore.
- The chart will open in Explorer with the appropriate fields and filter selections:

Figure 4.48 – Creating an explorer from a report
Two conditions need to be met for exploring a report:
You do not need to have edit access to the report itself.
Exporting from Explorer
You can export from Explorer either to a new report or an existing report. Since you cannot share an exploration with others, exporting it to a report is the only way to do so. Hence, exporting options are available as sharing options in Explorer. First, you need to save the exploration before you can share or export. Sharing only affects the components on the current tab of the exploration:

Figure 4.49 – Exporting from Explorer
Exporting a new report involves creating a new report connected to the data source used for exploration. On the other hand, exporting to an existing report involves the components on the current tab of the exploration being copied to the clipboard, which you can then paste into an existing report. The reusable data source that’s used with the exploration is added to the report if it’s not already present.
Using Explorer in an analyst workflow
An example workflow of an analyst starting from a data source may look like this:
- Say that a business analyst needs to find answers to some key questions around business performance and gets access to a Looker Studio data source that represents the relevant data.
- The analyst explores the data visually in Explorer and performs some analyses.
- The analyst finds the answers they are looking for and leaves Explorer without saving. Alternatively, they may save the exploration to revisit it at a later time:
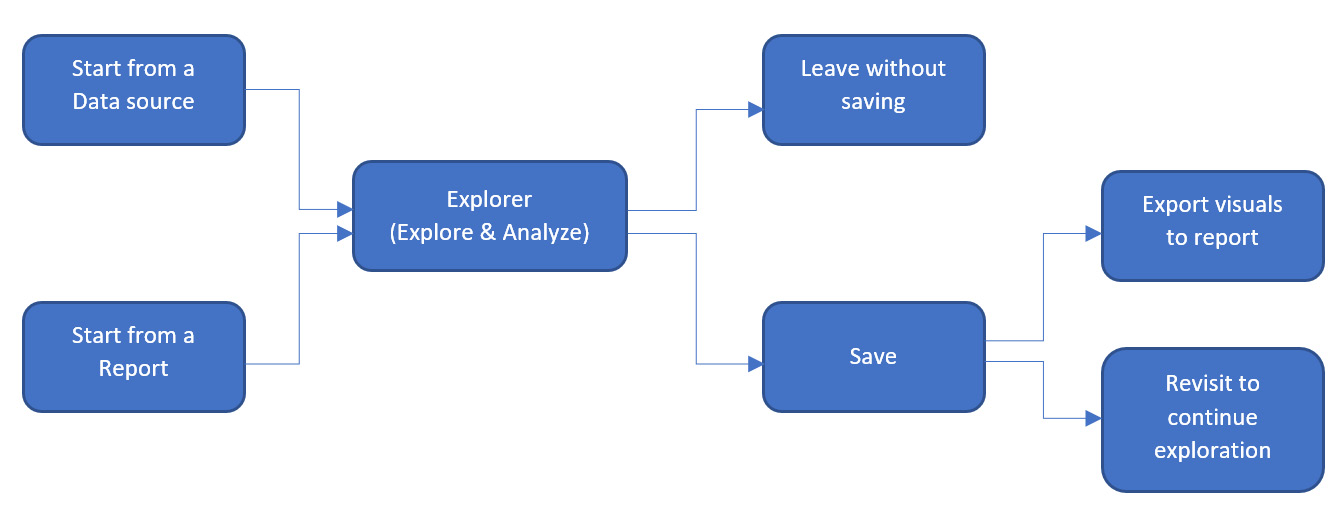
Figure 4.50 – Workflow of an analyst using Explorer
An example workflow of an analyst exploring a chart from a report may look as follows:
- An analyst is perusing a report and would like to explore a particular visual further by modifying or expanding it to find new insights.
- The analyst explores the visual in Explorer and draws new insights.
- The analyst saves the exploration and exports the visuals to a new report for sharing.
Leveraging Looker Studio Gallery
Looker Studio provides a gallery of reports showcasing various report templates and custom visualizations. These are created and published by the community using the developer tools that Google has provided for Looker Studio. You can access Report Gallery at https://lookerstudio.google.com/gallery.
Report Gallery is also a place where Looker Studio users can share their work with the larger community:

Figure 4.51 – Report Gallery with templates, reports, and community visualizations
Any report templates submitted by the community can also be found in Report Gallery. All submissions will be vetted by Google and made available in the gallery upon approval.
Getting help with Looker Studio
Looker Studio has a vibrant and active help community (https://support.google.com/looker-studio/community?hl=en) that enables users to find help, have discussions, provide and receive tips, and more. Google employees and Looker Studio experts around the world provide answers and engage enthusiastically. You will also find product announcements in this forum.
The official product documentation (https://support.google.com/datastudio/?hl=en) is a great resource to get help on how to work with Looker Studio.
Building your first Looker Studio report – creating the data source
As you learn about Looker Studio and explore its various capabilities, you will build a simple report in Looker Studio in an incremental manner. You will do this in this chapter to Chapter 6, Looker Studio Built-in Charts. You will work with the call center dataset of a fictional company that provides meal subscription services to customers in the United States.
The objective of this report is to visualize customer call trends and patterns concerning key factors such as call topics, customer attributes, and so on and also to monitor performance metrics such as Call Abandonment Rate and Average Speed of Answer. The dataset contains 6 months of customer call details from January to June 2022.
As the first step, you must create a reusable data source. The dataset is a CSV file that can be accessed at https://github.com/PacktPublishing/Data-Storytelling-with-Google-Data-Studio/blob/master/Call%20Center%20Data.csv. Download the file to your local machine. Make sure that you save it in UTF-8 compatible CSV format. Use the File Upload connector to create the data source, as follows:
- Click on Create | Data source from the home page.
- Choose the File Upload connector from the Add data to report screen and choose the file to upload. Please note that if the file is not saved as a CSV UTF-8 file, the upload may fail.
- Once the file is uploaded, set the data source name as Call Center and click CONNECT.
Now, review the available fields and update the schema. The dataset includes call details such as call time, duration, and topic, as well as information about the customer making the call, such as location and customer tier. The following screenshot shows the enriched data source that facilitates visualizing this data:

Figure 4.52 – Enriched data source of the call center dataset
Update the data source as follows:
- Modify the following field data types:
- AnsweredInSeconds: Numeric - Duration (sec.)
- CallDurationSeconds: Numeric - Duration (sec.)
- County Code: Geo - Country subdivision (2nd level)
- County Name: Geo - Country subdivision (2nd level)
- State: Geo - Country subdivision (1st level)
- Zipcode: Geo - Postal code
- Change the default method of aggregation for the two duration fields – AnsweredInSeconds and CallDurationSeconds – to Average.
- Each row in this dataset represents an individual call received by the call center. Hence, rename the Record Count default metric field to Calls by clicking on the field name to make it editable and provide the desired name.
- You will notice that the CallTime field, which represents the date and time the call was made, is interpreted as the Text type. Create the calculated field, CallDateTime, to parse these values as the Date & Time type. Use the following formula:
PARSE_DATETIME(“%Y-%m-%d %H:%M:%S”, CallTime)
- The call abandonment rate is an important performance metric for a call center. A high call abandonment rate is undesirable and implies that callers get frustrated and hang up before their problem can be fixed over the call. It is calculated as the percentage of abandoned calls out of total calls. Create the calculated field – Call Abandonment Rate – as follows and set its data type as Numeric → Percent:
SUM(IsCallAbandoned) / Calls
- The CustomerTier field represents the customer segment based on the lifetime value of the customer and includes four tiers – Bronze, Silver, Gold, and Platinum. To be able to sort these tiers in the increasing order of their value and importance, create a derived numerical field – CustomerTierNo – as follows:
CASE CustomerTier
WHEN ‘Bronze’ THEN 1
WHEN ‘Silver’ THEN 2
WHEN ‘Gold’ THEN 3
WHEN ‘Platinum’ THEN 4
END
In the next chapter, you will create a report and add this data source to it.
Summary
In this chapter, you learned how to access Looker Studio and understood its basic components. Looker Studio comprises four major entities – data sources, connectors, reports, and explorers. You use a connector to connect to the underlying dataset, be it Google Sheets, CSV files, Google Analytics, or anything else from the 500+ supported data platforms and systems. The connector creates a data source in Looker Studio, which is the logical representation of the underlying schema of the dataset. You can enrich the data source by modifying the data types, creating derived fields, and so on.
Reports are built using data from one or more data sources. You can explore data in a temporary environment called Explorer, which gets discarded at the end of your session by default. Explorers are private to you. You can choose to add your explorations to a report for sharing purposes. We reviewed how to create and work with data sources, reports, and explorers. We briefly touched upon the Looker Studio Report Gallery and ways to get help with using the tool.
In the next chapter, we will focus on the report designer and how to design and style various report components.