
Chapter 21
Dielectric Coatings for the Thermal Control of Geostationary Satellites: Trends and Problems 1
21.1. Introduction
Space is a complex and dynamic medium. It is filled with gravitational fields, made up of matter whose density becomes extremely weak, traversed by cosmic radii and by a very wide spectrum of corpuscular radiations, but also occupied by intense magnetic fields (of a greater/lesser extent). Furthermore, as they are connected by a very strong synergy, its components cannot be considered separately. Compatibility with such an environment is an essential element in the conception of any space vehicle. The constant quest for high reliability, a long lifetime and a high degree of autonomy, associated with the choice of an orbit and selection of materials, etc. means that all natural and/or artificial stresses need to be taken into account in order to best design space systems, sub-systems and equipment. On a satellite, the good functioning of any piece of equipment depends on its temperature. If temperature regulation is often made “naturally” in our terrestrial environment or in our laboratories, this is not the case in environment of space, where the obtaining of a correct temperature can only be achieved as a result of a specific science and technology called “thermal control of space vehicles”. Thermal control uses passive solutions as much as possible, i.e. thermal control radiators and external insulation. The materials brought into play are essentially dielectric polymers, directly subjected to the space environment.
One of the characteristics of the geostationary environment (the orbit of telecommunication satellites at 36,000 km from the Earth) is the permanent presence of electrically charged particles, presenting strong flux and associated with energies lower than 50 keV. These particles have a strong ability to charge external coatings. If these coatings accumulate the charges implanted on them, potential differences operate between diverse points in the satellite. When a configuration of electric field or of a critical potential is reached (respectively 107 V/m or 500 V), electrostatic phenomena such as discharges are produced and can damage the embedded electronics and the external coatings and structures of the vehicle/satellite. Electrostatic phenomena can also be produced on low orbits but the most “risky” ones remain those of the geostationary orbit.
This chapter describes the space environment and the electrostatic phenomena it induces on dielectric materials brought into play for the thermal control of satellites placed in geostationary orbit.
21.2. Space environment
21.2.1. Orbits
Artificial satellites placed around the Earth can circulate in different types of orbit [CNE 02]: the most common are called LEO (Low Earth Orbit) and GEO (Geostationary Orbit), at two different altitudes (Figure 21.1). In LEO orbit, also called “low orbit”, the satellites are situated between 700 and 800 km of altitude, orbiting the Earth in only a few hours. A trajectory at 90° with respect to the equator is known as a “polar” orbit, if the angle is different it is known as “inclined”, and at 0° it is known as “equatorial”. The GEO, or geostationary orbit, is situated at about 36,000 km of the Earth on the equatorial plane.

21.2.2. Free space
Space is empty. For an earthling, it is a difficult notion to conceive because down here, matter (in its three states, solid, liquid or gas) is everywhere: the air we breathe, water in the oceans, the rocks underground, the objects which surround us, etc. In reality, space is not absolute since we still find atoms (which make up a residual atmosphere, not very dense, up to an altitude of 1,000 km), solid debris, diverse radiations such as those coming from stars, etc. The quality of the vacuum and the nature of residual gases strongly depend on the altitude with respect to the Earth, but also on many other parameters including solar activity.
21.2.3. Microgravity
By definition, microgravity designates a state where the apparent gravity is very weak. We keep this term for a space environment in which the relative residual acceleration is of the order of 10−4 to 10−8 g. We meet these conditions almost perfectly in orbit above 250 km or in an Earth–Moon journey. Microgravity is the consequence of the orbital speed of the satellite. The most spectacular phenomenon ensuing from microgravity is the levitation of objects and of men during manned flights.
21.2.4. Thermal environment
The sun is a considerable source of energy for satellites. The energetic flux received by a satellite placed in geostationary orbit is on average 1,371 W/m2 [CNE 02].
The albedo solar flux, corresponding to the reflection and diffusion of the solar flux on the terrestrial atmosphere, is also an important source of heat. Its spectral distribution differs from that of the Sun because of the absorption bands in the atmosphere, whereas its intensity is a function of the angle and of the distance of the satellite from the Earth.
Similarly, the Earth radiates an infrared thermal flux.
The direct solar flux, the albedo and the terrestrial thermal flux are, therefore, in low terrestrial orbit, the 3 sources of heat outside the satellite. In geostationary orbit, the albedo and terrestrial fluxes are negligible because of the distance from the satellite to the Earth.
Conversely, the background of the sky is the only source of cold outside the satellite.
21.2.5. Atomic oxygen
One of the major components of the high atmosphere is oxygen in atomic form coming from the dissociation of molecules by solar UV and X-ray radiations, mainly during phases of strong activity (with a cycle of eleven years). The density of atomic oxygen decreases exponentially with altitude but remains significant up to almost 1,000 km. The issues related to atomic oxygen are therefore only critical for these low orbits.
21.2.6. Electromagnetic radiation
Space vehicles are permanently subjected to radiation covering the whole band of electromagnetic wavelengths.
Infrared radiation is divided into three categories, near and medium infrared (from about 0.75 μm to 3 μm) as well as far or thermal infrared (from about 3 μm to 100 μm). Thermal infrared constitutes a large part (10%) of solar radiation. Generally, the thermal radiation of the Earth and the planets is entirely situated in the infrared spectrum.
The visible flux (from 0.3 to 0.75 μm) has a strong influence on the thermal equilibrium of satellites.
The majority of ultraviolet or UV flux (from 0.12 μm to 0.3 μm) originates from the Sun and, even though they only represent a small part (1% to 2%) of solar energy, they have particularly harmful effects such as the degradation of the surface of materials. For example, they cause the breakdown of molecular chains of polymers by weakening the material and modifying its mechanical and optical characteristics.
X-ray and gamma radiations are of solar (eruptions) or galactic origin. They are dangerous for mankind and precautions are taken in the programming of extra vehicular activities. On the other hand, the total amount of these X-ray and gamma radiations is not sufficient to notably affect the thermal equilibrium of thermal control materials.
21.2.7. Charged particles [HID 05]
Electrons and protons originate from the sun and make up solar winds. Their density and their energy vary a lot as a function of solar activity. The simplified representation in Figure 21.2 presents the magnetosphere. Far from being static, solar winds assign to it calm periods and more turbulent times. The terrestrial atmosphere is permanently submitted to UV and X-ray radiations, to solar particles and other cosmic radiations, which, in interaction with atoms or molecules of the upper atmosphere, produce ions and electrons. For example, at very low altitude, the most energetic radiations such as cosmic radii are capable of making up a few thousand ions per cm3. It is only at about 50 km that the ionized part of the atmosphere really begins, called the ionosphere, and which extends up to around 1 Rt (1 Terrestrial Radius [Rt] ~ 6,378 km). With altitude, the ionization rate (ratio of the density of charged particles to the total density of particles) regularly increases to practically reach unity. In the ionospheric plasma, particles have an average energy of the order of 0.1 eV, and the probability to induce strong potentials on satellites is then practically zero. LEO satellites exist in this medium.
The ionosphere is dominated by the plasmasphere which is situated on the closed lines of the terrestrial magnetic field. It is a region of dense and cool plasma of mainly ionospheric origin, which can be split into two parts: the inner belt and the outer belt. These radiation belts are known as the Van Allen belts. The inner belt begins between 300 and 1,000 km of altitude as a function of latitude and extends up to 10,000 km. It mainly consists of electrons, whose energy can reach 1 MeV, and high energy protons (of several hundred MeV). The outer belt, also called the plasmapause, starts at about 10,000 km and extends up to about 5Rt. It is mostly composed of electrons and protons and marks the end of the plasmasphere.
Figure 21.2. Simplified schematic description of the magnetosphere in the noon–midnight meridian plane [HID 05]

The plasmic depression zone which surrounds the plasmapause is also situated in the closed lines of the terrestrial magnetic field. It is very thin and does not move with the Earth.
Above this zone is the plasmic layer which is a strongly agitated zone and the main cause of issues of satellite charges in geostationary orbit. This part of the magnetosphere is a reserve of energetic plasma of over 12 keV, under flux greater than 0.5 nA/cm2. It is composed of electrons and ions drifting in opposite directions because of the diverting action of the magnetic field. Unlike the others zones, it is only situated on the night side. In calm periods, the GEO orbit is situated outside the plasmic layer, but when the magnetosphere is agitated, during a stormy period, the plasmic layer is dilated and moves forward along the trajectory of the satellites until it reaches them.
As we have just seen, if the geostationary environment is very structured, the average energies characteristic of the particles which compose it are, however, subjected to variations. In a calm or stormy period, a zone can have its own type of particles, their density and their average energy radically changed. A satellite crossing these zones can have its functioning seriously altered if the characteristics of the medium exceed those for which it was designed.
Over the entire GEO orbit, satellites are subjected to particles trapped outside the Van Allen belt, made up of electrons whose energy varies from about 50 keV to a few MeV under an average flux of 50 pA/cm2 and protons whose energy is of several tens of keV.
In the midnight–6am sector (noon being at the center of the day side), in a calm period (when the plasmasphere is dilated) the GEO orbit is found in an ionospheric type atmosphere with energy (~ 0.1 eV) but less dense (~ 1 cm−3). A stormy period corresponds to a contraction of the plasmasphere (or forward movement of the plasmic layer) in the circulation zone of geostationary orbit satellites. In this type of environment, satellites are mainly exposed to electrons whose average energy is less than 50 keV under an average flux of 0.8 pA/cm2.
21.2.8. Meteoroids and cosmic debris
Around the Earth, we find much natural debris called meteoroids, formed at the same time as the solar system. Since the launch of the first satellite in 1957, several million pieces of artificial debris have been added to it, resulting from man’s activities in space. Their distribution is virtually uniformly in low orbits; the most dangerous zones are situated between 500 km and 800 km.
21.3. The thermal control of space vehicles
The functioning of any piece of equipment embedded on a satellite depends on its temperature and its variation. In space, obtaining a correct temperature is the result of the “thermal control of satellites and space vehicles”.
21.3.1. The definition of thermal control
Thermal control must guarantee a space system (a vehicle, instrument, equipment, etc.) a thermal environment which allows it to function normally during all phases of the mission.
For this purpose, it must:
– maintain structures, equipment and components in the ranges of temperatures specified for their proper functioning;
– limit, if required, the thermal gradients in space (dT/dx) or in time (dT/dt) for a structure, a piece of equipment or a component;
– guarantee conditions to the specified thermal limits at interfaces (heat flux, interface temperatures, couplings or thermal decouplings).
These needs vary as a function of the phases of the mission and the states of activity of the equipment.
21.3.2. Usual technologies for thermal control
The thermal control system resorts to numerous technologies to heat or cool a space system. Readers can find further details on these technologies in the space technology lessons of the CNES [CNE 02]. Amongst them, we find external insulation and radiators which implement films and polymer coatings of a dielectric nature.
21.3.3. Coatings for thermal control
The global temperature of a satellite results from the good equilibrium between the dissipation of the equipment and the absorbed external flux (sun, albedo and planetary infrared) or radiated (infrared) towards the space background. The external surfaces of the satellite will, then, need to be conceived and proportioned to ensure this thermal equilibrium at its best. Surfaces which are not used (or non-usable) as radiators will be radiatively neutralized by superinsulating mattresses. The surface and coatings of radiators will be defined and proportioned to absorb and radiate the required amount of flux.
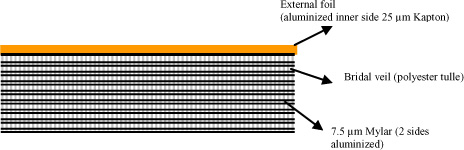
21.3.4. Multilayer insulations (MLI)
Multilayer insulations (MLI) are made by the superposition of radiative screens composed of films (most often in Mylar or Kapton) aluminized on both sides. Polyester tulles (a “bridal veil”) are inserted between these films to reduce the conductive couplings (Figure 21.4). The external foil of these MLI will be chosen to resist the aggressive space environment (UV, particles, atomic oxygen, etc.). We usually use an external Kapton foil aluminized on one side (the inner side). It is this Kapton which gives the gilt yellow color of the external MLI of the satellites.
In free space, the thermal efficiency of MLI is spectacular. For example, a MLI composed of twelve layers has a thickness of about 3 mm and could have a surface conductance of 0.03 W/m2.K. An equivalent polystyrene foam type insulating material should have a thickness of 1 m for the same efficiency.
21.3.5. Radiator coatings
In order to dose the right need of absorbed and emitted flux, these coatings are selected according to their thermo-optical properties. Let αs be the solar absorption coefficient (solar energy absorbed by the material) and εIR the infrared emissivity (energy emitted by the material in the infrared spectrum).
We could resort to warm coatings such as black paint, or cool coatings such as white paint or quartz mirrors called Optical Solar Reflectors (OSR). We could also opt for a mixture of several coatings. Most often, cool coatings are used, having a weak solar absorptivity, to free ourselves from solar and albedo fluxes which are always variable in orbit.

21.4. Electrostatic phenomena in materials
As we have described, space vehicles placed in GEO orbit are submitted to the presence of electric charges, mainly in the form of electrons. It is now important to describe the electrostatic phenomena caused by these charges and experienced by the materials.
21.4.1. Electrical conductivity
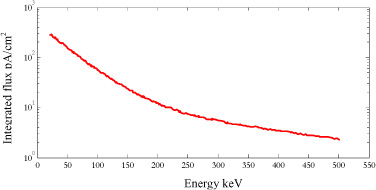
Statistical data coming from flight statements during periods of strong geomagnetic activity have allowed a listing of the energetic spectra of electronic fluxes to be established. Depending on the geomagnetic activity level, the spectra are listed according to an index Kp [VIE 02] ranging between 0 and 9. In Figure 21.5, a spectrum designated by index Kp > 5 is presented. The characteristics of index Kp>5 are described for the simulation of environmental conditions of a geostationary orbit. They come from an agreement between the rate of storms and their power. The spectrum Kp>5 therefore represents strong amplitude storms likely to occur.
The effects of the energetic dispersion of electrons on the external coatings are multiple and all of them are not negative [LEV 96]. The most degrading energies are those which permit the storage of electrons in the external dielectric. They are of the order of a few tens of keV and depend at the same time on the type and the thickness of the dielectric. For example, the average penetration depth of electrons of energy E = 20 keV in polyimide (Kapton) type polymeric materials, in fluorocarbon (Teflon) polymers or in silicones, is of the order of 7 to 10 μm.
When dielectrics are irradiated by electrons, numerous phenomena come into play. The emission of secondary electrons are produced during the penetration of the electrons in the material, then, when those are stored, the intrinsic conductivity of this material permits the charges to be evacuated more or less rapidly depending on the nature of the dielectric. This effect can be accelerated if the material is irradiated by strong energy electrons which flow through the dielectric and produce induced conductivity along their path.
21.4.1.1. The secondary electronic emission
When a surface is irradiated by electrons of given energy E, we observe the emission of secondary electrons. The ratio of the current incident (or primary) electrons to the secondary electrons is a function of the energy E of the incident electrons. This ratio, called secondary emission efficiency, is presented in Figure 21.6a, and noted δ(E):
When the primary electrons have an energy E greater than E2, energy of the second cross-over point (characteristic of the material), the secondary emission efficiency being less than 1, the material is charged. The surface potential increasing, the following incident electrons must overcome this barrier created by their predecessors. They then get to the surface of the material with a low energy E, thus getting closer to the second cross-over point E2. When the incident electrons energy is equal to E2, we find as many secondary electrons as primary electrons. In this case, the surface potential of the material no longer evolves. If a single electron gets to the surface with an energy below the second cross-over point E2 then the secondary emission efficiency becomes greater than 1. The amount of electrons emitted by the surface therefore becomes greater than the amount of implanted electrons. The potential decreases. The barrier opposite to the primary electrons is smaller, the incident electrons energy increases. In this way, an equilibrium settles around the second cross-over point E2.
Leung expresses the variation of δ(E) as a function of the maximum energy of the secondary emission efficiency (Emax) and the second cross-over point (E2) through the equation:
Figure 21.6. (a) Secondary emission efficiency of Teflon [PAY 96], (b) different charge cases of dielectric materials [LEV 96]
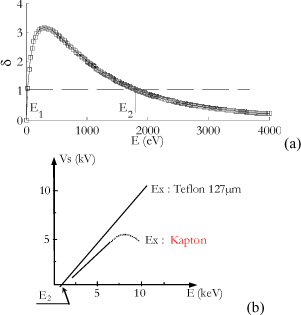
This secondary emission phenomenon induces a delay on the surface potential of the dielectric as a function of energy, as presented in Figure 21.6b. For example, for Teflon (Figure 21.6a) which has a very weak conductivity, the surface charge is governed by the secondary emission. For Kapton, in a thin layer which has a higher conductivity, the surface charge is controlled by the secondary emission and the intrinsic conductivity. This naturally causes a slower rate of charge accumulation.
When we increase the energy to exceed that for which the electron path becomes equivalent to the material thickness, this charge decreases. The electrons are then transmitted rather than stored in a capacitive form. This modifies the conductivity of the material irradiated over its entire thickness. This phenomenon is known as radiation-induced conductivity.
21.4.1.2. Intrinsic conductivity
The electrical conductivity of materials plays a crucial role in the value of the internal charge level of dielectrics. If a constant current is applied to a material, the internal electric field increases until an equilibrium is created, in which the current entering and the conduction current are both equal. For a material of thickness d, the maximum electric field at equilibrium, Emax, is calculated from Ohm’s law:
where V is the potential, I the current, R the resistance, j the current density, σ the conductivity and S the surface.
The calculation of the internal charge of dielectric materials can quickly become complex because their conductivity is not constant. It can be strongly affected by numerous factors such as the temperature, the electric field or radiations. The measurement techniques of conductivity in dielectric materials and moderately conductive materials are respectively defined by the norms: [AST 93, 87].
21.4.1.3. Radiation-induced conductivity
Under the effect of strong energy radiation (electromagnetic particles or waves), an insulating material is ionized and its electrical conductivity increases [SES 99] [ARK 93]. The radiation excites the electrons towards the conduction band, generating charge carriers, in direct proportion to the rate of absorbed energy (or dose) by the polymer. The conductivity is related to the density of carriers by:
where σ is the conductivity, n the number of free electrons by cm3, e the charge of the electron and μ the mobility.
Its value, for a given material, is therefore a function of the absorbed radiation dose and of the temperature. The induced conduction process is outlined in Figure 21.7.
Figure 21.7. Energy bands diagram of an insulating material. Kinetics of trapping/detrapping of carriers following an ionizing radiation. A represents the energies of the valence band, B the theoretically forbidden levels, and C the usually empty energy levels of the conduction band [HID 05]

When an electron of band A is excited by a sufficiently energetic radiation, it moves into the conduction levels. After a certain time, it can either directly recombine with a hole, or be temporarily trapped before being thermally detrapped towards the conduction band. The trapping/detrapping process can be repeated several times before the electron falls into an energy level sufficiently low for its recombination with a free hole to be more probable than a thermal excitation.
The equation which described the conductivity σ of an irradiated dielectric material was developed by Fowler in 1956 [FOW 56]:
The parameter σ(E) [O−1.m−1] represents the intrinsic conductivity of the material as a function of the electric field E [V/m]. The term KDΔ represents the conduction induced under radiation. K [O−1.m−1rad−ΔsΔ] is the conductivity coefficient induced under radiation, which is a function of the irradiated material nature. D [rad.s−1] is the dose output absorbed by the material, i.e. the average energy quantity transmitted by the ionizing radiations to a volume element divided by the mass of this volume and by unit time. The exponent Δ is a coefficient with no unit, ranging between 0.5 and 1, depending on the irradiated material. It takes values rather close to 1 for amorphous structure materials and 0.5 for crystalline materials. It is associated with the ambient temperature and a coefficient T1 homogenous to a temperature. This coefficient is a characteristic of the material, representative of the increased rate of the traps density. It can be described by the equation:
For a dielectric with surface S [cm2], density d [g.cm3], normally irradiated to its surface by electrons whose average penetration is r [cm], with acceleration voltage V [V] and absorbed current I [A] in the irradiated zone S × r, the dose output Do is given approximately by the formula [SIG 89]:
21.4.2. Electrostatic discharges in the geostationary environment
The internal charge of dielectric materials only becomes an issue when the accumulated charge induces a single phenomenon of electrostatic discharge or dielectric breakdown. In geostationary orbit, this phenomenon generally appears after the immersion of a satellite in a geomagnetic storm. In this case, the energetic plasma of the plasmic layer causes the differential charge of diverse parts of the satellite and, if a field or potential configuration exceeding a critical threshold appears, an electrostatic discharge is then initiated. It causes the creation of a very brief (a few hundred ns) and very intense (able to reach several amperes) current impulse. The configuration is known as critical if one of the cases presented in Figure 21.8 appears [ECS 98]. In this part, we shall designate the initiation and propagation modes of an electrostatic discharge when it is initiated in a dielectric and when it is initiated by peak effect in a metal.

21.4.2.1. Dielectric discharge
When a dielectric is submitted to a bombardment of electrons, some of them are trapped near the surface. Their accumulation creates a negatively charged layer, source of intense electric fields within the insulating material (Figure 21.9a). If the field becomes too intense, a breakdown (or boring) of the dielectric can result from it. In this case, the material becomes locally conductive over its entire thickness, the charges situated on both sides of the insulating material recombining on this path (Figure 21.9b). This phenomenon initiator of surface discharges (called flash-over) and space charge expansion (called blow-off) appears under the influence of an electric field and, in the presence of a desorbed gas, there can be propagation of the discharge (Figure 21.9b). During dielectric boring, the emitted energy creates a local temperature rise which leads to the creation of a conducting plasma. Under the influence of a transversal electric field, a neutral desorbed atom is split into an ion and an electron (Figure 21.9c). The electron, following the electric field, joins the closest surrounding mass and the positive ion comes to compensate the charge settling on the surface and desorbs another neutral atom. This atom is then ionized and the discharge is thus continued until total compensation of the charge.
In parallel to this discharge, a space charge expansion phenomenon appears. Unlike the surface discharge, the space charge expansion generates discernible and measurable currents in the structure of a satellite. The space charge electrons, attracted to their image charge, move along the field lines and create a current between the metallization of the dielectric and the metal structure of the satellite. It is in fact an electrostatic re-equilibrium current.

21.4.2.2. Metal discharge
Metal discharge is about the potential rise of metallization near a dielectric and concerns the electrons present in the metal. The release of the discharge is produced when the metal becomes more negative than a dielectric of about 500V (critical potential) [ECS 98]. By field effect, electrons are extracted from the metal and ejected towards the dielectric (Figure 21.10).
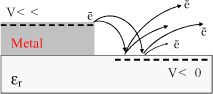
These incident electrons strike the surface of the dielectric material and by secondary emission extract several other electrons. This causes an increase in the potential difference between the metal and the insulating material and thus causes an even stronger field emission. This phenomenon is produced until the avalanche which totally discharges the material. For a better understanding of the mechanisms of this phenomenon, we shall explain in detail the phenomena of field emission and peak effect.
21.4.2.2.1. Field emission
Field emission is a phenomenon which is produced when the surface of a conducting material is submitted to an intense electric field which tends to send the electrons away. If we consider two electrodes submitted to a potential such that the created electric field is greater than 104 V/cm, then there is an emission of electrons from the cathode to the anode. Field emission law is in exponential form. It is governed by the tunnel effect process and its expression is that of Fowler and Nordheim. In a slightly simplified form, it can be written [PAY 96]:
where J [A/cm2] is the current density, E [V/cm] is the electric field, Φ [eV] is the potential barrier height to cross with the electrons and ν is a function of the y parameter:
Table 21.1 gives a few values of the parameter ν(y).
This equation only plays a part in a strong field and was experimentally verified up to current densities of 107 A/cm2. Figure 21.11 presents the current density as a function of the electric field for a barrier φ of 4 eV.

21.4.2.2.2. The peak effect
Electric fields likely to induce the field emission (E > 107 V/m) are generally generated by peak effect. This phenomenon takes place when a conductor, which presents an extremity of very weak diameter, is submitted to a potential. In this case, the charges tend to arrange themselves in a uniform way on the surface of the conductor. Some of them are therefore pushed towards the smallest extremity, which tends to increase very strongly the charge density at this point and therefore generates an intense electric field.
To represent this, we can idealize a point by representing it with two spheres connected by a wire, which permits them to be at the same potential (Figure 21.12).

If we ignore the weak influence of the wire on the electric field and we consider that the sphere of radius a has a charge q, its potential will then be:
The presence of the other sphere naturally influences the distribution of charges, such that there is not really a spherical symmetry. If, despite everything, we are only interested in an estimation of fields, the electric field in the immediate neighborhood of the surface of the sphere will be:
The electric field is therefore a function of the inverse of the curve radius of the peak.
21.5. Conclusion
In space, satellites placed in geostationary orbit are in the flux of huge particle accelerators: the Sun and the Earth. At the end of a complex interaction process between the medium and the satellite materials, a charge potentially of several thousand volts can result from it, followed by electrostatic discharges and electromagnetic perturbations of the onboard electronics, which can lead to the loss of the vehicle. The aim of this chapter was to describe the phenomena which come into play between the charged particles of the space environment and the surface dielectric materials outside the satellites, intended for thermal control.
Today, we reduce the risk of breakdown by preventing dangerous potential increases. For this purpose, we now seek to reduce the resistance of coatings in order to send the charges towards the parts lit by the Sun, in order to take advantage of photoemission. Also, any conductive material is related to the common mass by a resistance permitting the flow of charges. Finally, very insulating dielectrics, capable of storing the charge for several hours, are prohibited.
To attempt any digital simulation, only a single simulated test, in an empty chamber, under a flux of electrons at a representative spectrum, will allow the electrostatic equilibrium of the satellite to be determined.
21.6. Bibliography
[ARK 93] ARKHIPOV V.I., RUDENKO A.I., SESSLER G.M., “Radiation-induced conductivity and charge storage in irradiated dielectrics”, J. Phys. D: Appl. Phys., 26, p. 1298, 1993.
[AST 87] AMERICAN STANDARD TEST METHODS, “Standard test methods for DC resistance or conductance of moderately conductive materials”, ASTM D 4496–87, 1987 (Approved again in 1998).
[AST 93] AMERICAN STANDARD TEST METHODS, “Standard test methods for DC resistance or conductance of insulating materials”, ASTM D 257–93, 1993 (Approved again in 1998).
[CNE 02] CNES, Cours de technologie spatiale, Techniques et Technologies des Véhicules Spatiaux, Conseil international de la langue française, vol. 1 and 3, September 2002.
[ECS 98] EUROPEAN CORPERATION FOR SPACE STANDARDIZATION, “Spacecraft charging: Environment-induced effects on the electrostatic behaviour of space systems”, ECSS-E-20-06, Noordwijk, Holland, 1998.
[FOW 56] FOWLER J.F., “Radiation-induced conductivity in solid state, and some applications”, Proc. Royal Soc., London, A 236, p. 464, 1956.
[HID 05] HIDDEN G., Développement d’un nouveau revêtement de contrôle thermique pour satellite géostationnaire: Etude de l’influence de nanoparticules conductrices sur les propriétés thermo-optiques et électriques du composite, PhD thesis, Paul Sabatier University – Toulouse 3, 2005.
[LEV 96] LEVY L., “Charges des matériaux et systèmes de l’environnement spatial”, Environnement spatial: Préventions des risques liés aux phénomènes de charge, CNES -Cours de technologie spatiale, Cépaduès Editions, France, p. 169, 1996.
[PAY 96] PAYAN D., “Les décharges électrostatiques induites par l’environnement géostationnaire”, Environnement spatial: Préventions des risques liés aux phénomènes de charge, CNES - Cours de technologie spatiale, Cépaduès Editions, France, p. 289, 1996. [SES 99] SESSLER G.M., YANG G.M., “Charge dynamics in electron-irradiated polymers”, Brazilian Journal of Physics, vol. 29 no. 2, p. 233, 1999.
[SIG 89] SIGUIER J.M., “Contribution à l’étude des décharges électrostatiques sur les satellites: étude de la résistivité des matériaux de régulation thermique”, Mémoire Ingénieur CNAM, Toulouse, 1989.
[VIE 02] VIEL V., REULET R. “Tests et moyens d’irradiation”, Environnement spatial: Préventions des risques liés aux phénomènes de charge, CNES - Cours de technologie spatiale, Cépaduès Editions, France, p. 289, 2002.
1 Chapter written by Stéphanie REMAURY.