Creating a Local Cube
Office 2000 includes all the necessary pieces to create and use local cubes. A local cube functions much the same as a server-based cube. It has dimensions (complete with hierarchies) and measures. You typically store much less data in a local cube than in a server-based cube, and a local cube doesn’t include many of the capabilities of a server-based cube. For example, a local cube doesn’t include aggregations, member properties, shared dimensions, virtual dimensions, virtual cubes, partitions, or write-back tables.
Any client application that can interact with a server-based cube can also use a local cube because the client application communicates with the PivotTable Service and the PivotTable Service can communicate with either the Analysis server or with a local cube. The PivotTable Service is also the component that creates local cubes.
Office 2000 offers two different approaches for creating a local cube. With either approach it’s actually the PivotTable Service that creates the local cube, but the steps you go through are different in each case. One option is to connect to an Analysis server by using an Excel PivotTable report and then use the PivotTable report to create a local cube that is a subset of the server-based cube. The other option is to use Microsoft Query to define a local cube based on a relational data source.
Create a Local Cube from a PivotTable Report
Using a PivotTable report to create the local cube is simple, but you must have an existing server-based cube.
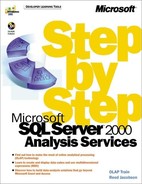
1. | In Excel, open the Chapter 5 workbook. Press the Ctrl key as you drag the Chart Report sheet tab to the right. Double-click the sheet tab, type Cube Report as the name for the new sheet, and press Enter. The PivotTable report has the Time dimension on the page axis, the State dimension on the column axis, the Product dimension on the row axis, and the Sales Units measure in the data area. | |
2. | Drag the State Name caption away from the report, leaving no dimension on the column axis. This is one possible starting point for creating a local cube from a PivotTable report.
| |
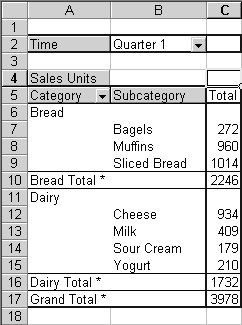
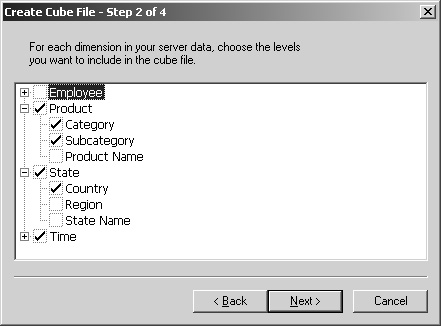
3. | On the PivotTable toolbar, click the PivotTable menu and click Client-Server Settings. Click the Create Local Data File button, and click Next to pass step 1 of the Create Cube File wizard. Step 2 of the wizard appears, showing the Employee, Product, State, and Time dimensions, with a check mark in the box next to the Product and Time dimensions.
Note Dimensions containing multiple hierarchies (as described in Chapter 3) and virtual dimensions (as described in Chapter 10, “Dimension Optimization”) do not appear in the Create Cube File wizard. | |
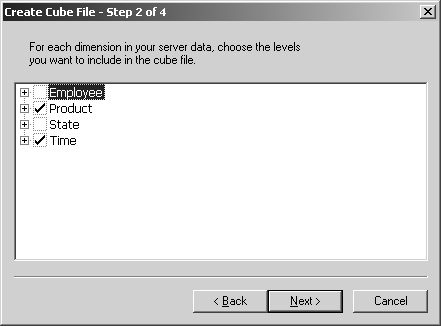
4. | Expand the Product dimension. The three levels appear, with Category and Subcategory already selected. The wizard defaults to select levels that are currently displayed on the report.
| |
5. | Expand the State dimension. The three levels for the State dimension appear, but none of the check boxes are selected. | |
6. | Select the State dimension check box. All the levels are automatically selected when you select the dimension. Clear the Region check box. When you remove a level, all levels below that level in the dimension are automatically removed.
| |
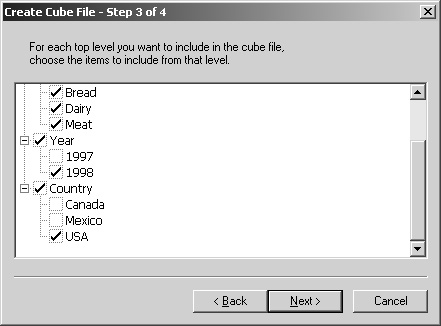
7. | Click Next to continue to step 3 of the wizard, and expand all four items. This step displays the name of the top level for each selected dimension, including the measures dimension. Each level name expands to show the members of that level. In addition to the preselected items, select Sales Dollars from the Measures level and USA from the Country level. Then click Next.
| |
8. |
Once the cube file exists, you can switch the Excel PivotTable report between the cube file and the server-based cube by using the Client-Server Settings dialog box which you access from the PivotTable menu. Also, within the Client-Server Settings dialog box, the caption of the Create Local Data File button changes to Edit Local Data File to allow you to redefine the local cube. Once the cube file exists, you can also access it by using other client applications, such as the MDX Sample application that will be explained in Chapter 7, “MDX Sets.”
Create a Local Cube from a Relational Data Source
Even if you don’t have an Analysis server available to you, you can create and use a local cube by creating one directly from a relational data source. The PivotTable Service, which is included with Office 2000, can create and access a local cube. To create a local cube directly from a relational data source, you use the Microsoft Query application. Microsoft Query includes a wizard for turning a relational data set into a cube.
When you create a local cube, you first create a relational rowset by using standard SQL. In that rowset, you can join dimension tables with the fact table and create calculated columns. Once you have the relational rowset, you then use the OLAP Cube Wizard to design dimensions, hierarchies, and measures for the cube. To simplify the process of creating a rowset, the Chapter 5 database included on this book’s companion CD contains a query named CubeSource that already includes the joins needed to create a Sales cube.
Note
You cannot create a local cube that contains a parent-child dimension, so the local Sales cube will not contain the Employee dimension.
1. | |
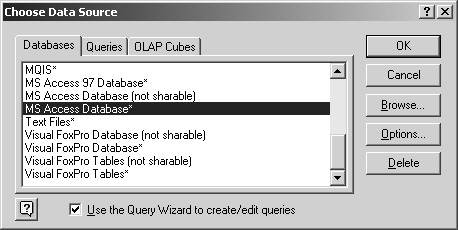
2. | In the Select Database dialog box, navigate to the folder containing the sample files for this book, select the Chapter5.mdb database file, and click OK. |
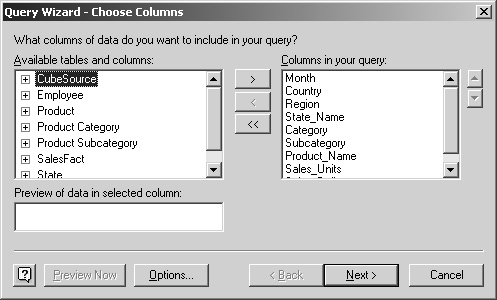
3. | On the Choose Columns screen of the Query Wizard, select the CubeSource table and click the add columns (>) button, adding all the columns from the table to the query.
|
4. | |
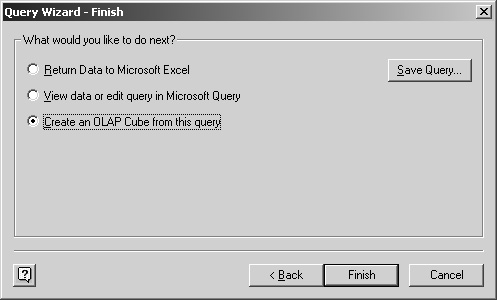
5. | Click the Create An OLAP Cube From This Query option, and click Finish. This launches the OLAP Cube Wizard, which will be covered in the following section. |
When you create a server cube by using Analysis Manager, you can create SQL expressions as part of a dimension level or measure definition. When you create a local cube, however, all SQL expressions must occur in the relational view, whether you create that view in Microsoft Query or in the relational data source.
Use the OLAP Cube Wizard to Create a Cube File
Once you have created a rowset in Microsoft Query, you can use the OLAP Cube Wizard to define the dimensions and measures for the cube. The OLAP Cube Wizard is like a miniature version of the Analysis Manager application.
1. | Click Next to skip the welcome screen of the OLAP Cube Wizard. In step 1 of the wizard, make the measure names more readable: Select the Sum Of Sales_Units data field name, and type Sales Units as the new name. Then select the Sum Of Sales_Dollars data field name, and type Sales Dollars as the new name. Click Next. 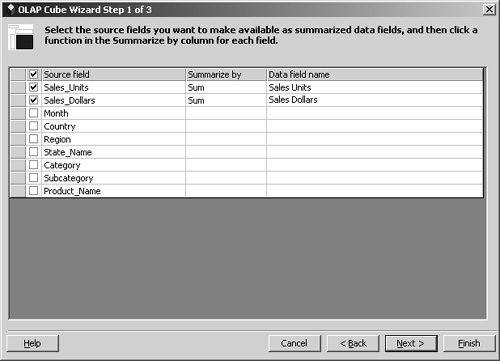
| |
2. | In the Source Fields list, double-click Country, Category, and Month. This creates three new dimensions. The Month dimension has a proposed hierarchy automatically created. 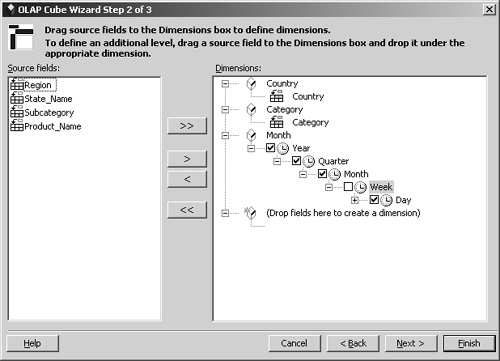
| |
3. | Clear the check box next to the Day level for the Month dimension. From the Source Fields list, drag Region to the Country level, and drag State_Name to the Region level. Then drag Subcategory to the Category level, and drag Product_Name to the Subcategory level. 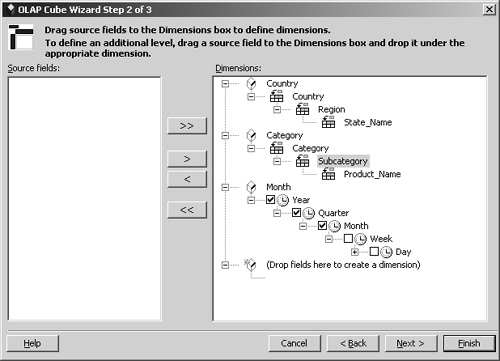 You can rename a dimension or a level by right-clicking the name and clicking Rename. You can rename dimensions and levels to match the Sales cube in the Chapter 5 database on the Analysis server.
| |
4. | Type Product as the new name for the Category dimension, remove the underscore from the Product_Name and State_Name levels, type State as the new name for the Country dimension, and type Time as the new name for the Month dimension. Click Next. 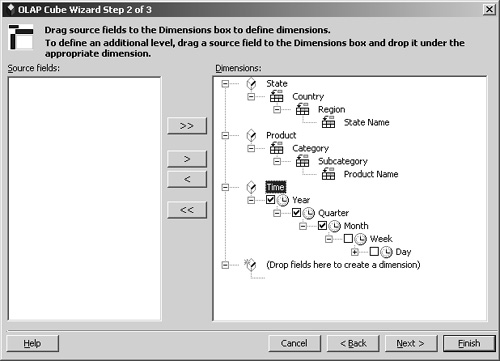
| |
5. | On the final page of the OLAP Cube Wizard, click the Save A Cube File Containing All Data For The Cube option, type C:AnalysisNewSales.cub as the name of the cube file, and click Finish. 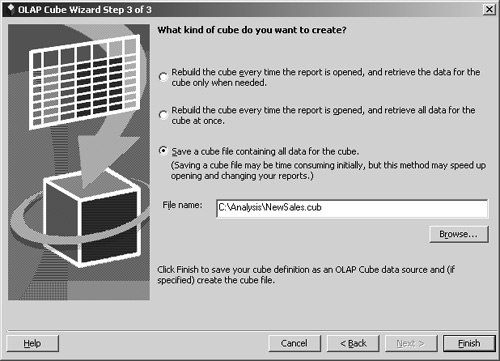
Note The first two options on the final page of the OLAP Cube Wizard allow you to create a cube that exists only in the PivotTable Service cache. The first option creates the equivalent of a relational OLAP (ROLAP) cube, retrieving values into the PivotTable Service cache directly from the relational data source only as they are needed. The second option creates the equivalent of a multidimensional OLAP (MOLAP) cube (with no aggregations) completely in the PivotTable Service cache. With either of the first two options, the cube exists only as long as the client application remains connected to the cube. For information about aggregations and ROLAP and MOLAP cubes, see Chapter 8, “Storage Optimization.” | |
6. | ||
7. | When the OLAP Cube Wizard returns you to Excel, it puts you into step 3 of the PivotTable And PivotChart Wizard. Click Finish to create the PivotTable on the active sheet. 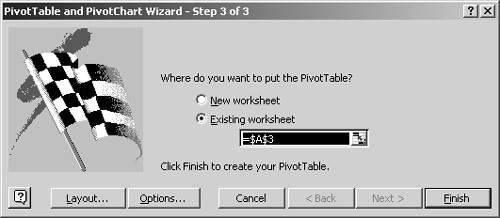
| |
8. | In Excel, a new PivotTable report connects to the cube file you just created. 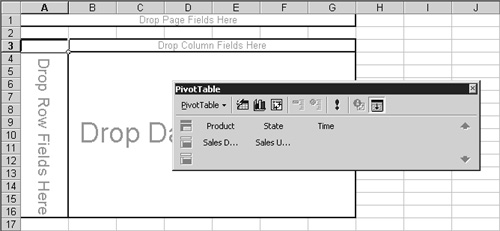
|
Once you’ve created a local cube, it’s almost indistinguishable to a client application from a server-based cube. As explained in “Enable write-back for a cube” in Chapter 4, “Advanced Dimensions and Cubes,” you can even write back to a local cube; the cube simply won’t retain the write-back values once you close the connection to the cube.