CHAPTER 3
Rediscovering Scale
“Concentrate your energies, your thoughts, and your capital.”
—ANDREW CARNEGIE
The Industrial Age was a moment in history—a singular, transformative flash—yet it still frames how we look at the world.
Many of us may romanticize the period as a simpler time. It was the era of industrial titans: Carnegie, Rockefeller, J. P. Morgan. Sure it took vision, ambition, and capital, but if you brought just the right ingredients together, and added just enough hard work, you just might create a spark and ride a virtuous cycle of scale economies to amazing heights.
It is tempting to think we are still there, a less ambiguous time when bigger was better, and the rules of the game were much clearer. In the Industrial Age, with its low levels of complexity, it was generally sufficient to think of scale as the overall volume or overall revenue of the business. Profitability was a function of revenue—in fact, it was driven by it. There were economies of scale to be had, and as revenue increased so did profitability. In this age, the thinking was that:
Profitability ≈ Revenue
So, bigger is better. It is tempting to think this way, but it will lead us astray. Take for example the industrial tool company that had lost 40 percent of its sales volume (and all of its profitability) after the economic downturn. With such a devastating shock to its business, management was keenly aware of the direness of the situation. If only it could get its volume back, management thought, the company could recover, regain its profitability, and survive the crisis.
So management did everything it could to capture every revenue dollar possible. In a desperate act, it rapidly expanded the product portfolio. Anything customers might want to buy, it quickly added to the catalog—even including clothing and toys.
But the expansion backfired. Category managers and salespeople struggled to keep up with the ever-expanding product line. The supply chain struggled to deliver ever greater variety of small-volume products. Product availability and on-time delivery performance fell short. Service suffered and customers became unhappy. Profitability dropped through the floor. In a well-intended quest for growth, the company saddled itself with so much complexity that it impaired its ability to execute and deliver. What customers prized was product availability. What the company focused on was portfolio breadth. The Industrial Age mindset suggested: if we add revenue, we will become more profitable. Instead they just became more complex. They confused revenue with scale.*
This is an all too common a story: we still operate with an Industrial Age rulebook. But of course the rules have changed. The world is also more crowded. We have passed the Age of Exploration where European nations raced to claim greater portions of the new world. Today, the landscape is full, with every gain being someone else’s loss.
Similarly, much of the world has passed the point where a self-perpetuating cycle of consumption created amazing levels of new opportunity; where companies and entrepreneurs raced to capture a piece of a rapidly growing pie with seemingly room for all. Sure, there will continue to be amazing innovations and substantial gains, and likely at an ever accelerating pace, but along with these will be staggering losses for others, also likely at an ever accelerating pace.
In some regards, the world today better resembles the Preindustrial Age, where economies of scale were not so significant, where scale tended to fall under its own weight, and where instead of sparking and riding a virtuous cycle of growth and profits, one had to slog it out one step at a time and fight for each foot of ground.
A Framework for Scale in the Twenty-First Century
Scale still matters. In fact, the primary management challenge today can be summarized as: grow your revenue faster than you grow complexity. But to do so requires a more nuanced understanding of scale, and what erodes it. If you fail to understand or manage the complexity in your business, you will find the fruits of scale frustratingly out of reach.
The relationship between revenue, complexity, and profitability is captured in the following useful rule of thumb: adding complexity faster than revenue will reduce your profitability, whereas adding revenue faster than complexity will increase your profitability. This rule of thumb is helpful for separating out good from bad complexity.
Compare two companies, both with a total sales volume of one million units. The first company has one product. The second company has 1,000 different products. In terms of true scale, these two companies are worlds apart. So, variety becomes just as important as volume, and the previous relationship becomes:
![]()
What this means is that today you can no longer focus on revenue more than you think about your level of complexity, as they both have an equal impact on profitability. Revenue can be a misleading indicator of scale—a “false scale.” It is a paradox of growth that focusing just on the numerator (growth) but not the denominator (complexity) will impede not just your profitability but also your ability to grow. Whereas focusing on complexity in conjunction with revenue will not only protect your profitability, but improve your ability to dramatically and sustainably grow.
Economies of scale certainly still exist today, but they are often less defined by the overall size of the company or business unit. Rather, real scale exists at much lower levels within the company, for example in the sales per a particular product, the volume of a particular task, or the volume with a particular customer or supplier. Real scale is now found more at the micro level than the macro level. Offerings, processes, organizational structures, resource allocations, work practices, and technology all affect real scale, and some useful metrics like inventory turns are a measure of real scale.
At this point it is helpful to introduce the notion of density. Just as in physics where density is mass per volume (such as grams per cubic centimeter), in businesses we think of density in terms such as sales per store, volume per product, or revenue per region. Density is volume (or sales or size) divided by complexity. Today, it is more effective to think of economies of scale as economies of density, where real scale is found in the pockets of density within and across a company. Introducing the notion of density updates our expression to:
![]()
Think of a company as a pile of rocks (intending no offense to anyone). In the Industrial Age a bigger pile of rocks had more scale than a smaller pile of rocks. Today, however, it is instructive to ask whether a smaller pile of rocks has more real scale than a much larger pile of sand (see Figure 3.1).
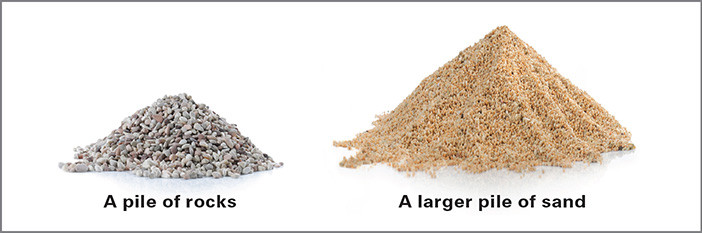
FIGURE 3.1: Which Has More Scale? In many industries today the largest companies (the “larger pile of sand”) are less profitable than many smaller ones (the “smaller pile of rocks”).
But there are many good reasons to want to grow the size of your pile of rocks. First, it is often true that if you are not moving forward, you are moving backward. In this sense, growth is a defensive strategy to ensure continued existence. Second, growth also reflects a natural and commendable human desire to create and to build, and in this sense growth is very satisfying. Third, as Berkshire Hathaway’s Annual Report from 1992 points out, “The best business to own is one that over an extended period can employ large amounts of capital at very high rates of return.” Certainly a larger company with a healthy rate of return is preferable to a smaller company with the same rate of return. In this sense, growth is a means to creating greater economic value.
In the Industrial Age there was also fourth reason for growth: as a means to become more profitable. And becoming more profitable reinforced the first three reasons, making growth an even more effective defensive strategy, more satisfying, and more economically valuable.
In the Age of Complexity, however, growth itself can no longer be counted upon as a means to greater profitability. Unfortunately, the opposite is more often realized, making growth less sustainable, less satisfying, and less valuable. In the current age, the challenge has become how to grow while retaining profitability, as only profitable growth is truly sustainable over the longer term,3 and behind that question is the question of how and where to build real scale, meaning how and where to build density.
Today, profits beget growth, more than the other way around.
Economies of Density
With nearly half a trillion dollars of annual revenue, Wal-Mart Stores, Inc. is the world’s largest retailer and one of the world’s largest companies by revenue. Only the largest oil and gas companies are bigger.
If you were to sum up what has made Walmart so successful, most would point to its overwhelming size, deep pockets, and ability to beat price discounts out of its suppliers. A few admirers would point to its sophisticated technology and operations. But the competitive advantages most of us associate with Walmart were not the drivers of Walmart’s success, but rather the fruits of it. We tend to view Walmart through an Industrial Age lens, seeing its size as the source of its competitive strength, as some sort of virtuous cycle. But Walmart was already highly successful, and more profitable, long before it was bigger than its competitors. Indeed, Walmart was more profitable than KMart even when Walmartwas just one-tenth KMart’s size, long before it would have the clout to allegedly beat up suppliers. Further, Walmart’s high-water mark for profitability was in the mid-1980s, when it had just around 860 stores versus its more than 11,000 today.
It wasn’t Walmart’s size that made it so successful. Rather it was Walmart’s strategy of concentration—its economies of density. In their excellent book Competition Demystified, Columbia Business School professor Bruce Greenwald and investment manager Judd Kahn show how, after eliminating other explanations, Walmart’s success resulted primarily from its strategy of concentration and the significant “local economies of density” it afforded.4 Their thorough analysis, which they refer to as “Big Where It Counts” and “From Great to Good,” goes into much more detail than we can cover here, but to summarize from their work:
For the three years ending January 31, 1987, Walmart had average operating earnings of 7.4 percent; Kmart’s were 4.8 percent. The difference was due entirely to much lower overhead costs. As a percentage of sales, Kmart had lower cost of goods sold . . . but it dissipated this advantage by spending more, per dollar of sales, on selling, general, and administrative expenses (SGA) . . .
What accounts for [Walmart’s] thrift? . . . the geography of market concentration. We have seen that in 1985, more than 80 percent of its stores were in Arkansas, adjacent states, or their immediate neighbors. Though much smaller than Kmart overall, it was far larger in its home territory. Kmart had its own area of concentration in the Midwest, but any benefits it might have derived from this regional strength were diluted by its lower density in other parts of the country. Walmart, by contrast, was able to make the most of its strategy of concentration, which accounts for most of its superior profitability. . . .
The superior efficiencies in these three functions were due to local economies of scale. [emphasis in the original]*
Kmart’s sales were actually three times those of Walmart in those years, the authors reported. But that sales number was an amalgamation of national and international stores, with “little bearing on the physical movement of goods, on advertising designed to reach the customers who shopped in their stores, or on the supervision the company employed to manage its retail operations.”
As Walmart began its aggressive national expansion in the mid-1980s, returns on sales and on capital declined steadily. By the mid-1990s, when Walmart was a national institution, but with less regional concentration than it had had in its golden days, returns bottomed out at around 15 percent of invested capital. Then, as Walmart added density by filling in the gaps, returns began to recover. The exception to this pattern was the international division, where Walmart was widely dispersed across many countries. As we would expect, international returns on sales and capital appear to have been only about one-half to one-third those of the core U.S. supercenter business.
The Temporal Dimension of Scale
A core strategic issue is that we have more data at our fingertips that at any point in history, yet we have less knowledge about the future. This unpredictability hampers our ability to build scale, as scale investments usually take some time to pay off.
In his book Team of Teams, General Stanley McChrystal illuminated the issue:
While we might think our increased ability to track, measure and communicate . . . would improve our precise “clockwork universe” management, the reality is the opposite: these changes produce a radically different climate—one of unpredictable complexity—that stymies organizations based on Taylorist efficiency.
Taylorism refers to the notion of Scientific Management, developed by Frederick Taylor in the 1880s, with a focus on the analysis of work flows and in particular labor productivity in manufacturing. It rested on a foundation of stability: incrementally removing seconds or minutes of waste in a (stable) production line for a stable demand. So while it is tempting to see technology as the means to perfect the machine, outside the world is no longer Taylorist. So scale today also requires adaptability:
Profitability ≈ (Density × Adaptability)
Adaptability means that companies need to leverage different strategies for rapidly creating scale, such as network orchestration—a business model where companies coordinate the participation of a network of providers, rather than providing all the value themselves. In fact, if the factory is a symbol of scale in the Industrial Age, then network orchestration may be the equivalent for today’s world. Given how quickly any advantage can quickly be competed away—in combination with rapid geopolitical, demographic, and economic changes—the expected life span and versatility of investments must be considerations as any organization aspires to build scale.
Network orchestrators create value by forming partnerships with multiple parties—networks—to extend their organization in a low-cost, flexible, and valuable way. By leveraging the network, a company can access lower costs in the value chain, by allowing each subnetwork or individual actor to identify opportunity, structure in a cost-efficient manner, and leverage economies of scale where possible. Empty capacity becomes someone else’s problem. It also offers much greater market flexibility, as the organization is longer defined by its assets—it can extend reach through the network. Global sourcing titan Li & Fung, by its own definition, is a network orchestrator in the purest form. The company owns no factories and employs no factory workers. It started as a trading broker in Canton, China, in 1906 and over the next hundred years grew into an exporter, then a multinational corporation, then finally into its role as an orchestrator. It now orchestrates 15,000 suppliers in more than 40 countries to produce more than $18 billion in garments, consumer goods, and toys.
Winners and Losers
The data suggests that companies are struggling to build scale. According to our analysis, almost half of S&P 500 companies are actually seeing less scale as they grow (see Figure 3.2). What is striking here is that this is not driven by industry. Dissecting the data (see Figure 3.3) reveals that that in most industries there are scale winners and scale losers. Some companies seem able to improve economies of scale, while others don’t. And this includes industries where you would expect to uniformly see economies of scale, such as software-related industries, and others where you wouldn’t, such as the restaurant industry.
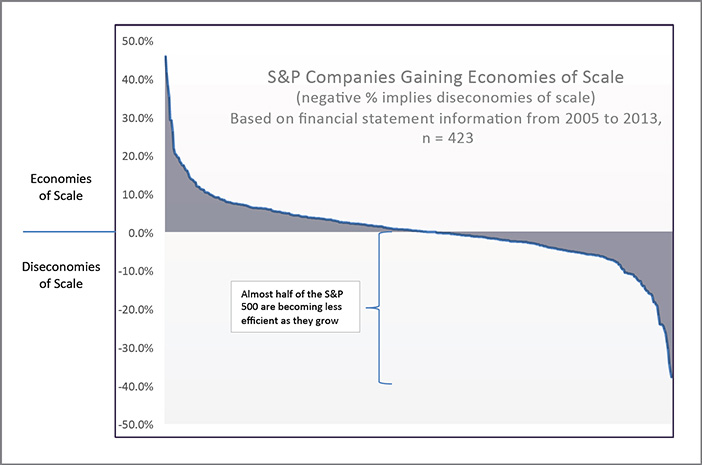
FIGURE 3.2: Winners and Losers in the S&P 500
Note: Here we are defining scale as the change in revenue CAGR (2005–13) and operating income (OI) growth over the same time period. This means that companies that saw profit growth (as measured by OI) exceed revenue growth the most rank the highest.
Source: Company financial statements; WP&C analysis

FIGURE 3.3: Scale Is Not a Function of Industry
Source: Company financial statements; WP&C analysis
Let’s consider the restaurant industry for a moment. If we look at where a few notable brand names fall in the economies of scale ranking (out of 423 companies), you’ll see significant disparity among them:
![]() #28 Chipotle
#28 Chipotle
![]() #118 McDonald’s
#118 McDonald’s
![]() #289 Yum! Brands
#289 Yum! Brands
![]() #359 Darden Restaurants
#359 Darden Restaurants
Yes, they are organizations with substantive differences. Some are relative upstarts while others are very established. Some have many brands and some have just a few. But that’s precisely the point. Some of these differences—complexity factors—end up driving their ability to achieve scale, and therefore profitability. As you can see from Figure 3.4, there is a strong correlation between drivers of complexity and their ranking.
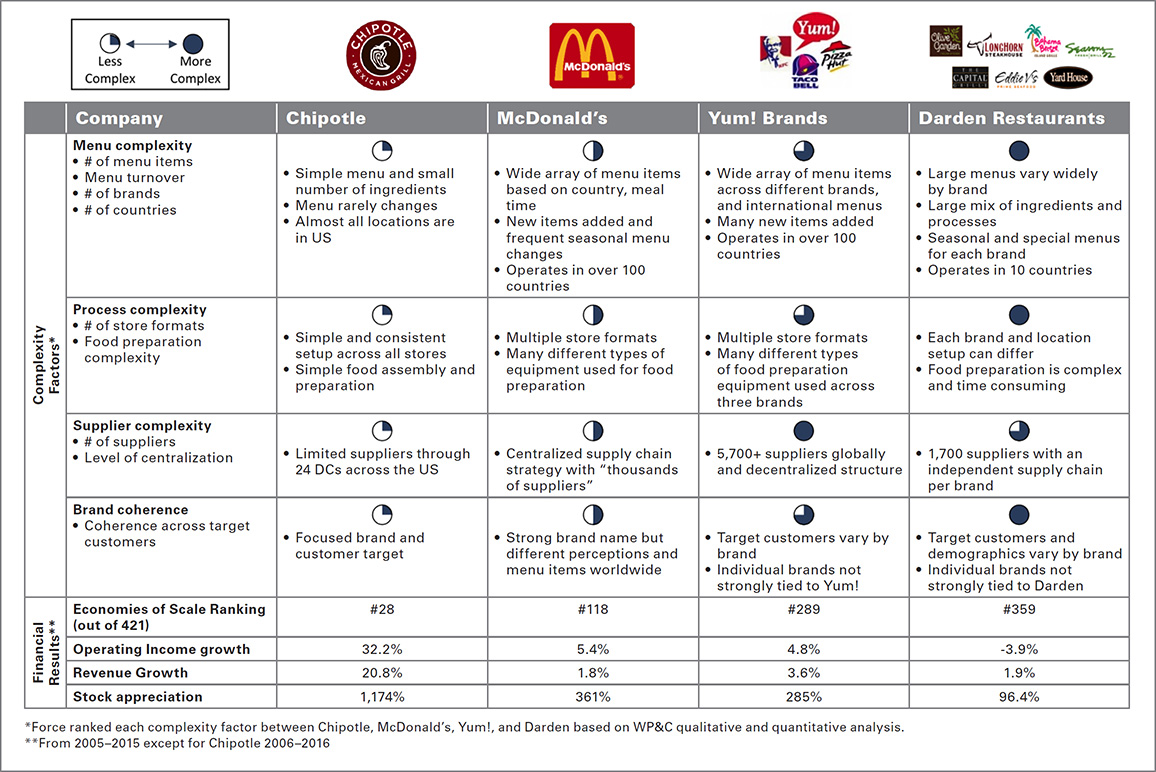
FIGURE 3.4: Scale in the Quick-Serve Restaurant Industry
Source: WP&C analysis
To understand what’s behind these rankings, consider how these complexity factors are multiplicative, not additive. With more products going to more brands with more formats, the amount of coordination and associated cost tends to increase and process issues multiply.
McDonald’s, for example, expanded its menu by 70 percent between 2007 and 2013 to include 145 items, including new products like the McWrap. As a result, service slowed to a point that some franchisees called their stores “operational nightmares.”5 Drive-through times increased by 13 percent in the same time period and were about 20 percent longer than those of Taco Bell and 30 percent longer than those of Wendy’s.
“It’s gotten to the point where the operation has kind of broken down and that’s all a symptom of the complication of the menu,” said Richard Adams, a San Diego–based restaurant franchisee consultant and former McDonald’s store owner. “They can’t make the food fast enough.”6
In fact, a vast menu may not be the top priority in fast food, according to research from Nation’s Restaurant News and consultant WD Partners. In the study, menu variety ranked below food quality, cleanliness, value, and service in terms of important attributes. This is borne out in the experience—and growth—of Chipotle Mexican Grill Inc., which has a very limited menu and saw its revenue grow by 9.6 percent in 2015.7
“Part of the reason why Chipotle works so well is that it’s simple,” said Peter Saleh, a New York–based analyst at Telsey Advisory Group.8 “If they added four more items, it would screw up the entire process.”
Less a Growth Than a Complexity Issue
Another striking factor from our research is that lack of scale is usually not a growth problem. In fact, in our analysis we have found that the companies whose economies of scale were deteriorating the quickest actually had the highest revenue growth! In the S&P data used, the bottom 20 percent of companies (those with the greatest diseconomies of scale trend) were the ones with the highest CAGR. What is going on here? No doubt every case is different. But to frame it in the context of our experience, what we’ve seen is that in the pursuit of top-line growth, many companies create more complexity and undermine the economic basis that launched these growth strategies in the first place.
To frame in the context of the rest of the book, these companies are falling prey to the Siren Song, pursuing growth strategies that actually erode profitability and ultimately erode the potential for sustainable growth.
Thomas Kuhn, an American physicist who wrote extensively about science, was of the mind that scientific thought did not progress in a linear fashion. Instead, he asserted, it went through periods of revolutionary transformation, or paradigm shifts, which were then followed by periods of “normal science” when scientists returned to work within that paradigm.
We all use mental models and rules of thumb to simplify our lives and remain effective. But Kuhn’s observation suggests a trap. These models work only within a period of normal science. But during a period of shift, these models can lead you astray and need updating.
Unfortunately, many companies are constructing growth strategies for the Age of Complexity with outmoded mental models. The result is they fall victim to the Sirens of Growth and their alluring Siren Song. We will show how to resist the Siren Song and chart a course for growth in Part II.
 CALL TO ACTION
Diagnose the Complexity in Your Business
Opportunity:
Complexity can be the single biggest determinant of your cost competitiveness and a drag on resources and growth. Efforts to drive growth are undermined by high levels of non-value-add complexity that currently exist in many companies. Therefore, it is important to diagnose and attack this complexity to ensure that your top-line initiatives are successful and yield bottom-line impact.
Key questions for discussion:
![]() Do you have too much complexity in your business? Is it limiting your ability to grow?
Do you have too much complexity in your business? Is it limiting your ability to grow?
![]() Are you growing revenue faster than complexity, or the other way around?
Are you growing revenue faster than complexity, or the other way around?
![]() Where do you have the biggest issues with complexity? Is it product complexity, process complexity, or organizational complexity?
Where do you have the biggest issues with complexity? Is it product complexity, process complexity, or organizational complexity?
![]() How is complexity impacting your ability to serve customers or to react to changes in the market?
How is complexity impacting your ability to serve customers or to react to changes in the market?
![]() What are the biggest barriers to reducing complexity in your business?
What are the biggest barriers to reducing complexity in your business?
![]() But what would it mean to your ability to grow if you could reduce your level of complexity?
But what would it mean to your ability to grow if you could reduce your level of complexity?
Areas to investigate:
![]() Plot the sources of complexity in your business; identifying the impacts of that complexity on your process, organizational, and business performance.
Plot the sources of complexity in your business; identifying the impacts of that complexity on your process, organizational, and business performance.
![]() Quantify the true profitability of your products and services, accounting for complexity costs.1
Quantify the true profitability of your products and services, accounting for complexity costs.1
![]() Understand your customers’ true key buying factors and your alignment to those relative to competitors.
Understand your customers’ true key buying factors and your alignment to those relative to competitors.
![]() Assess your true scale (revenue/complexity) versus your competitors.
Assess your true scale (revenue/complexity) versus your competitors.
* Fortunately, the story didn’t end there. The company began to regain its focus. Under new leadership, it developed a coherent product strategy and reversed course to rationalize its catalog. It stripped complexity out of its product line and its processes, and it was able over time to bring back up its service levels.
* The lower costs of Walmart’s concentration strategy came from three areas: inbound logistics, advertising, and executive supervision. As Greenwald and Kahn explain: (1) with its greater density of stores and proximity to distributions centers, trucks didn’t travel as far and could carry goods on both routes (from vendors to distribution centers and from centers to stores), (2) for retailers, advertising is local, so with three times the local sales of competitors, Walmart’s advertising costs, as percentage of sales, were about one-third that of competitors, and (3) greater store density meant that management spent more time in stores and less time driving between them—to supervise the same number of stores, a Kmart or Target executive had to cover a territory three to four times as large.