
CHAPTER
13
The temporal dimension in end
user programming for the Web
Eytan Adar,1 Mira Dontcheva,2 James A. Fogarty,3 Daniel S. Weld3
1University of Michigan
2Adobe Systems
3University of Washington
ABSTRACT
Despite the dynamic nature of the Web, most people only view and interact with a static snapshot. Search engines, browsers, and higher-level end user programming environments only support observing and manipulating a single point in time – the “now.” We propose that moving beyond this static viewpoint is important because (1) maintaining a temporal view of the Web allows users to more clearly understand the behavior of their “programs,” both in static and dynamic contexts; and (2) temporally changing information on the Web is interesting in its own right. In this chapter we discuss the opportunities and challenges of integrating the temporal dimension in end user programming environments and our experiences with Zoetrope, a tool for interacting with the ephemeral (i.e., dynamic) Web.
INTRODUCTION
Despite the dynamic nature of the Web, most people are only exposed to a static snapshot. Search engines, browsers, and higher-level end user programming environments only support observing and manipulating a single point in time – the “now.” To better support interactions with historical data, we created the Zoetrope system (Adar et al., 2008) that provides a visual query language and environment for end user manipulation of historical Web content. By supporting such interactions from within the context of the Now Web (i.e., through the “present” copy of a page), the Zoetrope user does not need to identify the location of historical content. For example, a user may place a lens – a visual marker – on the “current” lowest used book price on an Amazon page, and have the historical price automatically extracted and visualized over the history of the page. Although it is focused on access to the ephemeral Web, the design of Zoetrope has a number of implications to the design of many end user programming environments in its ability to “debug” such programs on historical content and generate additional training data. Integrating the temporal dimension provides both new challenges and many new opportunities, which we explore within the context of Zoetrope.
ZOETROPE
Zoetrope functions as a complete system, providing a custom crawler, content store and indices, an internal dataflow language for representing queries on data, and a front end for “programming” queries and visualizing output. The main visual operator in Zoetrope is a lens. Lenses are rectangular objects drawn on any part of a Web page (see Figure 13.1). Each lens can be manipulated through a slider, giving users interactive access to historical content from “past” to “present” and providing the illusion of dynamic content from static information. Data selected within the lens can then be visualized in a number of different ways: time series for numerical data, movies constructed from many static images, timelines, and so on. Although there are a number of different types of lenses to target different types of data, all are highly interactive and respond to the user’s manipulation of the slider instantly. Interactivity is a key feature and distinction for Zoetrope, driven by the fundamental observation that most applications that rely on screen-scraping style extractions will fail at some point because of a drastic change in page structures. By allowing the Zoetrope user to see how their selection functions over time, corrections can be made at points in history where the extraction has failed.
Additional lens features include filtering with keywords or other features and the binding of multiple lenses (on the same and different pages) to explore correlated data (e.g., gas prices on one page versus oil prices on another, versus news stories mentioning the Middle East on yet a third).
As described in Adar et al. (2008), Zoetrope contributes:
• A novel visual programming toolkit and a set of interactions for rapidly building and testing temporal Web queries,
• A semantics (formal model) for temporal data streams,
• A set of recomposable operators to manipulate temporal data streams,
• Indexing structures for fast processing and interaction with Web content over time, and
• A unique dataset collected by a new crawler design.
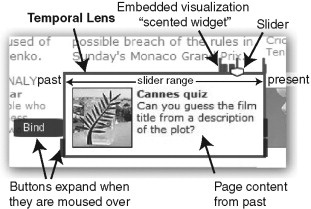
FIGURE 13.1
Anatomy of a lens.
In this chapter we explore in detail the particular design choices for Zoetrope and how the notion of time can be employed in end user programming environments regardless of their emphasis on past or present. These applications share a common goal with Zoetrope in their desire to function as well as possible into the future.
THE ZOETROPE ARCHITECTURE
Zoetrope consists of a number of components that, taken together, provide a complete solution for collecting, storing, and querying historical versions of the same page. This architecture is illustrated in Figure 13.2.
Crawler
The Zoetrope crawler is a modified Firefox with two (also modified) plugins. The first, WebPage-Dump (Pollak & Gatterbauer, 2007), outputs the browser-internal Document Object Model (DOM) representation of the page. Capturing this representation is important as it is (1) a compliant XML file that can be indexed in an XML database, and (2) a frozen version of the page that does not contain any JavaScript and can thus be guaranteed to render the same way each time the page is loaded. The modified WebPageDump waits some period until the JavaScript on the page has either stopped executing or some waiting period has expired. Though sometimes imperfect, this allows any JavaScript code that modifies the DOM to complete the process. In addition to the serialized DOM, the plugin stores a single CSS page specifying formatting and all objects (images, flash files, etc.) associated with the page. A second plugin, Screengrab! (http://www.screengrab.org), produces a screen capture of whatever is being displayed in the browser. Using these plugins, the crawler collects an accurate representation of the page as it looked at the time of retrieval (through an image) and sufficient data so that the page can be correctly re-rendered if necessary. Though strictly only the unrendered content is needed, by storing and caching the rendered content, we are able to better support a number of the interactive features.
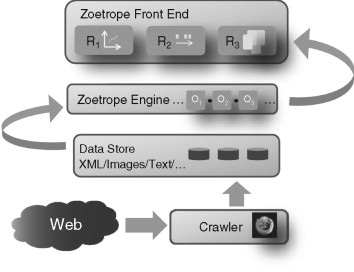
FIGURE 13.2
The Zoetrope architecture.
At present, the crawling infrastructure resides on a “headless” Linux server (i.e., one without a display system). Firefox instances, running in the background, collect nearly 1000 pages every hour. This is not a limit of the machine but rather the population of pages we have chosen to crawl. Each page is crawled once per hour at the fastest rate with a backoff protocol that speeds up or slows down the crawl as needed from a maximum of once an hour to a minimum of once a day (if the page remains unchanged). Although crawling speed can be greatly increased (further increasing version granularity), there are “politeness” limits that need to be respected. A machine would likely be able to crawl many times this number of pages, and one could envision a service that collects page snapshots at different intervals. Furthermore, using a Firefox plugin has the further advantage that people can add to their own database as they browse the Web. The combination of personal visit archives and periodic snapshots might be sufficient for a number of applications.
Storage and data
The DOM for each version of a page are loaded into an in-memory XML database. Saxon (http://www.saxonica.com) provides XPath query functionality and allows us to rapidly find matching elements or entire versions of pages. An in-memory index also tracks DOM elements by their rendered x and y coordinates. This structure allows us to quickly find which elements are clicked or selected. An early analysis of storage needs (Adar et al., 2008) revealed that each incremental copy for a 5-week crawl (crawled once an hour) was 15% (2 Kb average, 252 bytes median) the size of the original, compressed copy of the page. This is encouraging from the perspective of managing many copies of the same page.
The Zoetrope engine
Internally, Zoetrope is built on a simple dataflow architecture where operators act on a content stream. Conceptually, a content stream is a sequence of tuples (i.e., pairs), <Ti, Ci>, where Ci is a content item, such as a Web page or some piece of a page, and Ti is the time when that content was sampled from the Web. When a person creates a lens or some other visualization, Zoetrope generates a sequence of operators, which process the content stream. There are presently three main types of abstract operators which act on content streams in different ways:
• Transform operators modify the content payload of tuples. Each tuple is processed by this operator, and one or more new operators are generated, replacing the processed tuple. For example, if the content item is an image, a transform operator may crop the image.
• Filter operators modify the content stream by removing or allowing a given tuple to pass through. For example, a filter operator may only allow tuples with data greater than some number or only tuples where the content contains a certain string.
• Finally, render operators interface between the engine and GUI by rendering some visualization of the content stream that contains one or many tuples. A time series renderer, for example, will depict the fluctuations of numerical values over time.
The Zoetrope interface1
The primary Zoetrope interface is a zoomable canvas based on Piccolo (Bederson, Grossjean, & Meyer, 2004) within which the user can explore past versions of any number of Web pages. Though most Zoetrope features can be implemented in modern Web browsers, interactivity is still technically challenging and was best implemented in a custom application (though this will likely become less of a problem as new browser technologies are released). Zoetrope lenses are drawn directly into this interface as well as any visualizations, providing a single workspace for exploration. Although Zoetrope displays the rendered Web page as an image, the system maintains the interactivity of the live Web page. Clicking on a hyperlink opens a browser for the present version of the hyperlink target (or the historical version corresponding to the slider selection, if it exists within Zoetrope).
Figure 13.3 displays a Zoetrope workspace where the user has loaded the Amazon home page, selected an element on the page (the number of presales of the last Harry Potter book), and then visualized those presales in a time series. Zoetrope supports binding between multiple lenses or between lenses and visualizations.
Each lens drawn on a Web page has a corresponding slider at the top that can be moved from one end of the lens to the other. The leftmost end of the slider represents the first captured instance of the page available to Zoetrope, whereas the rightmost is the most recent capture. Although motion of the slider is continuous, in reality snapshots are discrete. To provide the illusion of continuity Zoetrope “rounds” to the nearest value. As the user moves the slider, a small textual overlay displays the nearest matching date (changing as the slider moves). Lenses in Zoetrope can be “bound,” so that motion in one slider causes motion in all other lenses that it is bound to. Without binding, lenses act independently, potentially creating a page that is an amalgam of different pieces of the page from different points in time. How to properly notify users of this amalgam state is an interesting interface design challenge and research opportunity.
Lenses are in part inspired by the Video Cube (Klein et al., 2002) and Magic Lenses work (Bier et al., 2003). The former allows video stream frames to be layered and “sliced” to find an abstraction of the video. In the latter, a magic lens is a widget that can be placed directly on a document to illuminate the underlying representation while maintaining the visual context of the document. Architecturally, a number of database visualization systems are related to the stream and operator design in Zoetrope. Particularly, DEVise (Livny et al., 1997) was originally constructed to operate on streams of data that required visualization (though operators in DEVise tended to concentrate on the mapping of data to visual elements and less on transformation and filtering). Similarly, Polaris (Stolte et al., 2002) operates to visualize relational data. In both, the operators provided by the system are primarily targeted at the rendering step (deciding how graphs, charts, and other visualizations should be constructed).
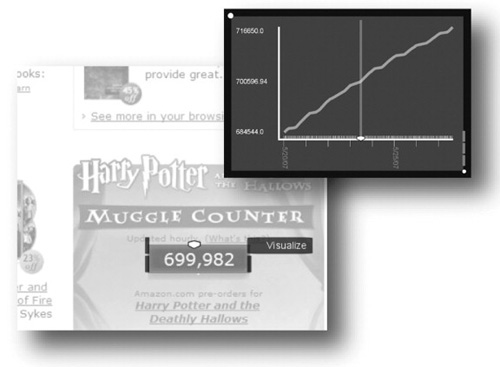
FIGURE 13.3
A time series visualization displays the Harry Potter book presales, or “Muggle Counter,” over time.
ZOETROPE LENSES
A lens allows a person to select some content and track it over time (i.e., the temporal extraction). Although there are various flavors of lenses, their creation and use is nearly identical. A person creates a lens simply by drawing a rectangular area on the Web page surface. In the underlying semantics of the Zoetrope system, the creation of a lens produces a parametrized transform operator that acts on the original page content stream, an optional filter (or set of filters) that processes the transformed stream, and a renderer that displays the historical data in the context of the original page. The specific selections of transforms and filters depends on the lens type.
Lenses come in three distinct flavors: visual, structural, and textual. The different variations are intended to track content on the page based on its stability. For example, content that is stable in rendered coordinates can be tracked with a visual lens. On the other hand if the content being extracted by the lens is visually in a different place, but is always retrievable by the same path through the DOM hierarchy, this content can be tracked through a structured lens.
Visual lenses
The simplest Zoetrope lens is the visual lens. To create this type of lens, a person specifies a region on the original page (e.g., a portion of the BBC home page as in Figure 13.4). The specification produces a lens with a slider. The slider is parameterized on the width of the lens and the range of data being displayed. As the slider moves, the lens renders the corresponding data. Figure 13.4 illustrates how a visual lens is implemented using the internal Zoetrope operators. When created, each version of the page becomes a tuple in the content stream. Each of these tuples is then rendered (or looked up if cached), cropped, filtered, and then rendered inside the lens. Visual lenses are particularly useful for extracting portions of information that is generally statically placed on the page and has the same size (e.g., portion of a weather map, or part of a continuously updating Webcam image).
Structural lenses
Not all Web pages possess sufficient stability for a visual lens. Slight shifts in rendering or more significant movement of elements can cause distracting jumps when a person moves the lens slider. To counter this effect, and to allow for more precise selections, Zoetrope provides structural lenses. Structural lenses are created in the same way as visual lenses, by drawing a rectangle around an area of interest, but they track selected HTML content independent of visual position. Specifically, when created, a structural lens defines a DOM forest within the structure of the page. This is specified through an XPath expression (Berglund et al., 2007) that can be used to select a subtree of the structure. For example, in Figure 13.5, in order to track price over time in the page, the user selects the price element using a structural lens. The structural lens then parameterizes a transform operation which is able to pull out the element containing the price information over many past versions of the page.
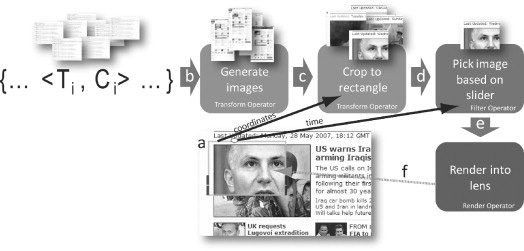
FIGURE 13.4
A visual lens in action. The user specifies a visual lens (a) on top of the page. This causes Zoetrope to take all versions of the document in a content stream and push those to a transform operator (b) that renders (or looks up) how the page looked at every time step. The tuples, which now contain rendered page images, are pushed (c) to a second transform which crops the images to the dimensions specified by the original placed lens. This stream is then pushed (d) to a filter operator that is parameterized to the slider state and which picks the single tuple closest to that time. Finally, a render operator takes (e) that single tuple and displays it inside the original lens (f).
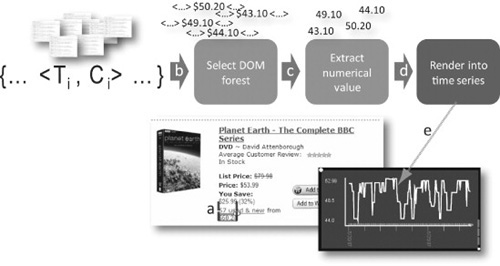
FIGURE 13.5
A structural lens and time series visualization. The user specifies a structural lens (a), selecting the used price of the DVD. Zoetrope takes all versions of the document in a content stream and pushes them to a transform operator (b) that selects a portion of the document corresponding to the selection (i.e., the XPath). A second transform operator (c) strips the text and extracts the numerical value which is pushed to a renderer (d) and finally a visualization (e).
Textual lenses
Visual and structural lenses are dependent on certain types of Web page stability. A visual lens relies on stability of the rendering, whereas a structural lens takes advantage of structural stability. Both are reasonable in many scenarios, but it is also worth considering selections based on unstable or semi-stable content. For example, consider tracking a specific team in a list of sports teams that is ordered by some changing value, such as rank (see Figure 13.6). As teams win and lose, the team of interest will move up and down the list. Specifying a rectangle at (100,400), or the fourth row in the list, will not work when the team moves from this position. To address this type of selection, we introduce the notion of a textual lens, which tracks a textual selection regardless of where the text is located on the page. A textual lens can track exactly the same string (e.g., a blog story) or approximately the same string (e.g., a sports team name with a score, where the score changes from time to time).
In its most general form, a textual lens tracks arbitrary text regardless of where it appears on the page, which DOM elements contain the text, and the size of those elements. This generalization is unfortunately too computationally intensive, even in scenarios where the text is unchanging, and the problem becomes intractable for an interactive system. To make our textual lenses interactive, we restrict the search space by making use of the document structure. Textual lenses often track items that appear in tables, lists, or structurally similar subtrees (e.g., posts in a blog all have similar forms). We take advantage of this structural similarity to only search among DOM elements that have similar tree structure to the original selection. From this initial set of possibilities, Zoetrope will compare the text in the original selection to the possible matches, picking the most likely one. The comparison is currently done through the standard Dice coefficient, which calculates the overlap in text tokens between two pieces of text (i.e., SIM(A,B)=2*|A∩B|/(|A| + |B|), where A and B are sets of words).
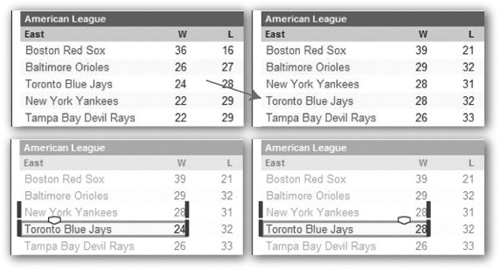
FIGURE 13.6
A textual lens can track content regardless of where it appears on the page. For example, the Toronto Blue Jays move from being the 3rd to the 4th ranked team (top two images). A visual or structural lens created in the first time series would show the Blue Jays at first but the Yankees when the slider is moved back. A textual lens, on the other hand, tracks the Blue Jays no matter where they are in the list (bottom two images).
Applying filters to lenses
Given the large volume of data encoded in a content stream, it is natural to want to focus on specific information of interest. Zoetrope uses filters to provide this capability. We have already seen a few different kinds of filter operations, but it is worth considering additional types:
• Filtering on time: One may wish to see the state of one or more streams at a specific time or frequency (e.g., 6 PM each day).
• Filtering on a keyword: The selection condition may also refer to C1, the content half of the tuple <Ti, Ci>. If Ci contains text, then keyword queries may apply. For example, one might only be interested in headlines that contain the word “Ukraine.”
• Filtering on amounts: One may also select content using an inequality and threshold (e.g., >k). If the content is numeric and the inequality is satisfied, then the tuple is kept; otherwise it is filtered. Similarly, one can select the maximum or minimum tuple in a numeric stream.
• Duplicate elimination: It may also be useful to select only those tuples whose content is distinct from content seen earlier in the stream.
• Compound filters: Logical operations (conjunction, disjunction, negation, etc.) may be used to compose more complex selection criteria.
• Trigger filters: An especially powerful filter results when one stream is filtered according to the results of another stream’s filter. For example, Ed can filter the traffic page using a conjunction of the 6 PM time constraint and a trigger on the ESPN page for the keyword “home game.” We will return to this when considering lens binding.
Because filtering is useful for many tasks, it is provided as an option whenever a visual, structural, or textual lens is applied. When selecting a region with filtering enabled, a lens is created based on the underlying selection and a popup window asks for a constraint to use in the filter, such as a word or phrase. Other appropriate constraints include maximum, minimum, and comparison operators.
Filtering is visually depicted with a scented widget (Willett, Heer, & Agrawala, 2007) which is displayed as a small embedded bar graph (Figure 13.1). The bar graph is displayed above the slider, indicating the location in time of the matching tuples. As a person moves the slider, the slider snaps to the bars, which act like slider ticks. Note that the bars need not be all of the same height and may reflect different information. A tall bar can indicate the appearance of new content that matches a filter, and a short bar can indicate content that appears previously but still matches the filter.
Binding lenses
People are often interested in multiple parts of a page or parts of multiple pages, as they may be comparing and contrasting different information (e.g., what does traffic look like on game days?). Zoetrope flexibly allows for the simultaneous use of multiple lenses. Lenses can act independently or be bound together interactively into a synchronized bind group. Sliders within a group are linked together, causing them all to move and simultaneously update their corresponding lens (see Figure 13.7).
Users may bind lenses for different reasons. For example, to check traffic at 6 PM on home game days, a user can bind a lens for traffic maps at 6 PM with a lens for home games from his favorite baseball site. Each lens in a bind group constrains its matching tuples to only include versions allowed by all other lenses in the group. Recall that this is achieved through a trigger filter. Each lens can add a new trigger filter parameterized to the time intervals that are valid according to other members of the bind group. Only tuples that satisfy all trigger filters are allowed. Thus, the resulting stream shows traffic data at 6 PM only on days for which there are home baseball games.
Lenses can also be bound disjunctively. For example, one may want to find when book A’s price is less than $25, or when book B’s price is less than $30 (i.e., one of the two books has dropped in price). Zoetrope supports this type of bind, which is currently obtained by holding the shift key while performing the bind operation. However, this operation creates an interesting twist as it causes data to be unfiltered. When binding two lenses in this way, filter operators can be thought of as operating in parallel rather than serially. A tuple passes if it matches any filter.
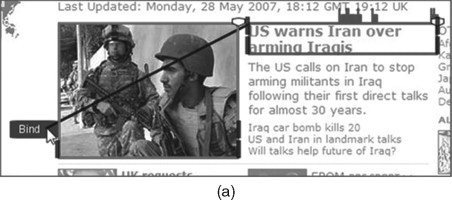
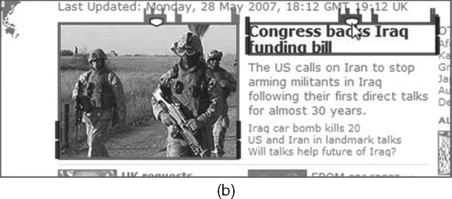
FIGURE 13.7
An example of a bind operation. The user constructs two separate lenses (a) and drags from one bind “port” to another. In this example, the user binds a lens that is filtering news stories about Iraq to the image posted next to the article. The two lenses become synchronized (b) so that motion in the slider of the first lens will automatically move the slider in the second.
Stacking lenses
In addition to binding, Zoetrope also supports the stacking of lenses. For example, consider a person who creates one lens on a weather page, filtering for “clear” weather, and would like to further apply a filter that restricts the selection to between 6 PM and 7 PM daily. Explicitly drawing one lens over the other and then binding them is visually unappealing and does not take advantage of the underlying semantics of the language. Instead, we introduce the notion of lens stacking. The toolbar in the Zoetrope window, which allows users to select the type of the lens, can also be used in a specialized binding operation which we call stacking. By dragging a lens selection from this toolbar to the bind button of the lens, a person indicates that they would like to further filter the existing lens. The original lens is replaced, and a new combined lens is generated, which takes the transform and filter from the original selection and augments it with additional transforms and filters. This new lens satisfies both the selection and constraints of the original lens as well as the new one. Furthermore, because some filters and transforms are commutative, stacking provides the opportunity to reorder the internal operations to optimize the processing of tuples.
Finally, we consider the partial stacking of lenses where a person wants to make a subselection from an existing lens. For example, a person may apply a textual lens that tracks a specific team in the ranking. The textual lens will track the team no matter where they are in the ranking, but the user would further like to pull out the wins for that team at various time points. Thus, they may create a second structural lens that consumes the selection of the textual lens and selects the wins. While most lenses can be easily stacked without modification, lenses that stack on top of textual lenses require a slight modification to utilize relative information (paths or locations). This subtle modification is necessary because the textual lens selects information that is not in a fixed location in either the x,y space or the DOM tree. Because the textual selection is variable, the structural lens must use a path relative to the selection rather than an absolute path.
ZOETROPE VISUALIZATIONS
Lenses enable viewing of Web content from different moments in time, but this exploration is likely just the first part of satisfying an information need. For example, a book’s cost at specific points in time is interesting, but a person may also want to graph the price over time, calculate averages, or test variability. To facilitate this type of analysis, we have created a number of renderers that visualize or otherwise represent selected data. Visualizations, like lenses, create a sequence of transforms, filters, and renderers to display results. Although visualizations can exist independently of a lens, a lens typically defines the data displayed in the visualization. Lenses can thus also be used as a prototyping tool for testing selections and aggregations.
The transforms, filters, and processed streams generated by the lens can be directed to visualization rendering components that implement the visualization itself. For example, in a typical workflow, one might place a (potentially filtered) lens on a book price, move the slider to test the selection, and click on the visualization button to graph the price over time. Internally, the visualization step reuses the transform module of the lens and connects it to a time series renderer. Clearly, many temporal visualizations are possible (e.g., Silva & Catarci, 2000; Aigner et al., 2008), and could be implemented in Zoetrope or externally. Presently, Zoetrope only offers limited support for version-to-version comparisons. Filters, for example, note if the content at one time step is different from the previous time step (but do not currently indicate what those differences are). Many such visual comparison (i.e., “diff”) algorithms exist (e.g., Douglis et al., 1998; Chen et al., 2000; Fishkin & Bier, 2004; Jatowt, Kawai, & Tanaka, 2008) and could be added as well. As we describe below, a number of default renderers provide visualization alternatives in the current implementation.
Timelines and movies
The simplest Zoetrope visualization type is the timeline (see Figure 13.8), which displays extracted images and data linearly on a temporal axis. This visualization allows, for example, viewing weather patterns over the course of a year, headline images in stories that mention Iraq, or unique articles about a favorite sports team (all ordered by time). As before, the rendered images visualized in the timeline are live and a person can click on any of the links. Double-clicking on any image in the visualization synchronizes the page (or pages) to the same time, allowing a person to see other information that appeared on the page at a particular time. This visualization can also eliminate duplicates and display a line next to each image depicting its duration. This type of display shows when new content appears and how long it stays on a page (e.g., a story in the news, a price at a store). To prevent the timeline from running indefinitely to the right, the visualization can fold the line into a grid with each row denoting activity over a day (or other interval).
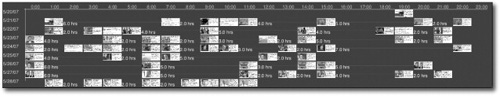
FIGURE 13.8
This timeline visualization shows the duration and frequency of news articles on the cbc.ca Web site.
The timeline visualization gives an instant sense of everything that has happened over some period. However, other examples are best served by cycling through the cropped images to produce an animated movie. Although this is equivalent to simply pulling the slider through time, a movie visualization automates and regulates transitions and looping while the visualization cycles through the images. For example, a static U.S. Geological Survey (USGS) earthquake map can be transformed into an animation of earthquakes over time, helping to pinpoint significant events.
Clustering
Our timeline visualization is a simple example of a grouping visualization, where extractions are grouped by some variable (time in this case). However, other more complex groupings are also possible. Clustering visualizations group the extracted clips using an external variable derived from another stream. For example, a clustering visualization can merge data from two different lenses, using one lens to specify the grouping criteria while the other lens provides the data. For example, in a cluster visualization of traffic and weather data we create a row for every weather condition (e.g., sunny, clear, rain), and every instance from the traffic selection is placed in the appropriate row depending on the weather condition at the time of the clipping. If it was rainy at 8:15 PM, for example, the traffic map from 8:15 PM is assigned to the rainy group (e.g., Figure 13.9).
Time series
A variety of interesting temporal data is numerical in nature, such as prices, temperatures, sports statistics, and polling numbers. Much of this data is tracked over time; however, in many situations it is difficult or impossible to find one table or chart that includes all values of interest. Zoetrope automatically extracts numerical values from selections of numerical data and visualizes them as a time series (e.g., Figure 13.3). The slider on the x-axis of the time series visualization is synchronized with the slider in the original lens selection. When the person moves the lens slider, a line moves on the time series visualization (and vice versa).
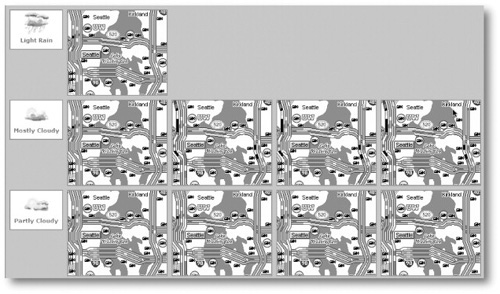
FIGURE 13.9
An example clustered visualization.
Exporting temporal data
The current version of Zoetrope implements many visualizations but is also designed for extensibility, and data extracted using Zoetrope lenses is also usable outside of Zoetrope. Systems such as Swivel (http://www.swivel.com) or Many Eyes (Viégas et al., 2007) excel in analysis and social interactions around data, but are not focused on helping people find the data in the first place. Zoetrope is able to generate a temporal, data-centric view of different Web sites to meet this need. To export data outside of Zoetrope, we created a Google Spreadsheet “visualization” that sends the lens-selected values to the external Google Spreadsheet system. When a person selects this option, appropriate date and time columns are generated along with the content present at that time interval (either strings or numerical data). This scheme expands the capabilities of Zoetrope by allowing people to leverage external visualizations, integrate with Web mashups, or perform more complex analyses.
CONCLUSIONS AND IMPLICATIONS FOR END USER PROGRAMMING
The World Wide Web is generally treated by users and system designers as a single snapshot in time. This limited view ignores the importance of temporal data and the potential benefits of maintaining a Web history. By considering the past, end user programming environments can be enhanced for the future. Zoetrope represents one possible solution in the space, concentrating specifically on how a user might analyze and visualize data from the temporal Web from the familiar context of the Now. By maintaining historical copies of the Web, Zoetrope provides users with the ability to simulate programs on historical data. This has implications for other end user programming tools for the Web which similarly depend on structural stability and benefit from allowing a user to test and validate their selections.
One feature of Zoetrope’s interface is that it allows users to quickly detect failures in selections. Such functionality is desirable, perhaps even necessary, for end user programming environments as page templates will likely change at some point, causing the program to fail (Kushmerick, 1999; Kushmerick, 2000; Dontcheva et al., 2007a; Little et al., 2007; Adar et al., 2009). For end user programming environments and Web-based Programming by Demonstration (PBD) systems, dealing with this issue requires complex heuristics or learning algorithms to deal with the eventual failure. A change to a Web page represents a potentially fatal change in the “API” utilized by end user programs. Clearly addressing such failures, and building more robust systems, is critical in the construction of programs that can run without constant maintenance.
With a tool such as Zoetrope, users can interactively detect failures in the extraction and refine their selection, adding or removing restrictions, improving filtering conditions, or creating another lens for the “failed” interval. Although this may not solve all future failures, users may improve the robustness of their extractions by observing failures in the past – either refining their programs manually or providing additional training data to the system. User-specified failures give the system an opportunity to automatically adjust its behavior. For example, by identifying a failure on past data, the user is providing examples to the system, which can be used to train a failure detection mechanism. Supplying a “fix” to this failure can help train exception handling mechanisms that will allow a program to continue working or adapting despite future changes to page structure.
Users, as constructors of these programs and extractions, have a unique ability to determine if a program has succeeded. Additionally, historical data can be used in simulation. By simulating the program – whether an extraction, or something more sophisticated – on historical data, the programmer can identify failure conditions that may recur in the future and increase the robustness of his programs. Such a facility is interesting not only for systems targeting extraction tasks (e.g., Chapter 12 and (Dontcheva et al., 2007b), but also to PBD systems (e.g., see Chapter 5 and Leshed et al., 2008) and complex mashups (e.g., Chapter 8 and Fujima et al., 2004; Bolin et al., 2005). By retaining historical Web data, end user programming environments can allow users to test their programs. For example, a system like Clip, Connect, Clone (see Chapter 8 and Fujima et al., 2004) might allow a user to “clip” a stock price from one page, submit that value to a currency conversion system on a second page, and multiply by the number of owned shares on yet a third page. Historical data, such as that provided by Zoetrope, would allow for testing the application with different values. A simple slider on top of the stock price selection, for example, might allow a user to test the program on different historical values of the stock very simply. Such a system also raises interesting design and research questions as the conversion step may not use the conversion rate from the present rather than the time the user has set the slider to.
The incorporation of the temporal dimension in end user Web programming represents an interesting departure from the traditional Now Web view of the world. In addition to providing users with access to data that may no longer be available in an easy to manipulate way, retaining such information has broader implications for Now Web applications that are dependent on the ill-defined and constantly changing interfaces exposed by the Web. Temporal Web data can provide users with the ability to test, debug, simulate, and strengthen their programs into more robust end user programs.
This work is based on earlier work: “Zoetrope: Interacting with the Ephemeral Web,” in Proceedings of the 21st Annual ACM Symposium on User Interface Software and Technology (UIST), © ACM, 2008, http://doi.acm.org/10.1145/1449715.1449756.
ZOETROPE
Intended users: |
All users, scientists |
Domain: |
All Web sites |
Description: |
Zoetrope is a visual query language for the ephemeral Web. The system allows a user to extract, visualize, and correlate data from historical versions of Web pages, from within the context of the “present” version. “Lenses” give fine-grained control over the data that is extracted and provide a quick test to validate these extractions. |
Example: |
Correlate historical gas and oil prices with news events about “war.” The user draws lenses on one page containing today’s gas prices, another on a page containing today’s per-barrel oil price. Zoetrope extracts these prices from historical versions of the page, creating time series visualizations. Selecting the headline article on the news page, and filtering for “war,” causes Zoetrope to identify historical articles that have appeared on the page and contain the term. A visualization can be created that links them for user exploration. |
Automation: |
Yes, the system automates certain historical extractions. |
Mashups: |
Yes, historical data from different pages can be aggregated. |
Scripting: |
No, Zoetrope provides a visual query language but not a traditional scripting language. |
Natural language: |
No, Zoetrope is a visual language. |
Recordability: |
No. |
Inferencing: |
Yes, using cues from the user, the system attempts to identify historical content relevant to the query. |
Sharing: |
Yes, extracted data can be pushed to public/shared pages (e.g., Google spreadsheets). |
Comparison to other systems: |
Zoetrope is unique in that it specifically targets historical Web data. Zoetrope’s techniques might be useful in other systems for testing programs on historical versions of Web pages. |
Platform: |
The Zoetrope front end is implemented as a Java application; the crawling infrastructure is based on a Firefox plugin. |
Availability: |
Not publicly available. |
1A video demonstration of Zoetrope is available at http://cond.org/zoetrope.html.