10. Marketing And Finance
Introduction
As marketers progress in their careers, it becomes increasingly necessary to coordinate their plans with other functional areas. Sales forecasts, budgeting, and estimating returns from proposed marketing initiatives are often the focus of discussions between marketing and finance. For marketers with little exposure to basic finance metrics, a good starting point is to gain a deeper understanding of “rate of return.” “Return” is generally associated with profit, or at least positive cash flow. “Return” also implies that something has left—cash outflow. Almost all business activity requires some cash outflow. Even sales cost money that is only returned when bills are paid. In this chapter we provide a brief overview of some of the more commonly employed measures of profitability and profits. Understanding how the metrics are constructed and used by finance to rank various projects will make it easier to develop marketing plans that meet the appropriate criteria.
The first section covers net profits and return on sales (ROS). Next, we look at return on investment (ROI), the ratio of net profit to amount of investment. Another metric that accounts for the capital investment required to earn profits is economic profits (also known as economic value added—EVA), or residual income. Because EVA and ROI provide snapshots of the per-period profitability of firms, they are not appropriate for valuing projects spanning multiple periods. For multi-period projects, three of the most common metrics are payback, net present value (NPV), and internal rate of return (IRR).
The last section discuses the frequently mentioned but rarely defined measure, return on marketing investment (ROMI). Although this is a well-intentioned effort to measure marketing productivity, consensus definitions and measurement procedures for “marketing ROI” or ROMI have yet to emerge.

10.1 Net Profit and Return on Sales
Net profit measures the profitability of ventures after accounting for all costs. Return on sales (ROS) is net profit as a percentage of sales revenue.

ROS is an indicator of profitability and is often used to compare the profitability of companies and industries of differing sizes. Significantly, ROS does not account for the capital (investment) used to generate the profit.
Earnings Before Interest, Taxes, Depreciation, and Amortization (EBITDA) is a rough measure of operating cash flow, which reduces the effect of accounting, financing, and tax polices on reported profits.
Purpose: To measure levels and rates of profitability.
How does a company decide whether it is successful or not? Probably the most common way is to look at the net profits of the business. Given that companies are collections of projects and markets, individual areas can be judged on how successful they are at adding to the corporate net profit. Not all projects are of equal size, however, and one way to adjust for size is to divide the profit by sales revenue. The resulting ratio is return on sales (ROS), the percentage of sales revenue that gets “returned” to the company as net profits after all the related costs of the activity are deducted.
Construction
Net profit measures the fundamental profitability of the business. It is the revenues of the activity less the costs of the activity. The main complication is in more complex businesses when overhead needs to be allocated across divisions of the company (see Figure 10.1). Almost by definition, overheads are costs that cannot be directly tied to any specific product or division. The classic example would be the cost of headquarters staff.
Net Profit: To calculate net profit for a unit (such as a company or division), subtract all costs, including a fair share of total corporate overheads, from the gross revenues.
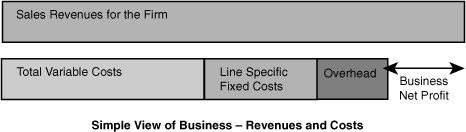
Figure 10.1 Profits = Revenues Less Costs
Net Profit ($) = Sales Revenue ($) - Total Costs ($)
Return on Sales (ROS): Net profit as a percentage of sales revenue.
Earning before interest taxes, depreciation, and amortization (EBITDA) is a very popular measure of financial performance. It is used to assess the “operating” profit of the business. It is a rough way of calculating how much cash the business is generating and is even sometimes called the “operating cash flow.” It can be useful because it removes factors that change the view of performance depending upon the accounting and financing policies of the business. Supporters argue it reduces management’s ability to change the profits they report by their choice of accounting rules and the way they generate financial backing for the company. This metric excludes from consideration expenses related to decisions such as how to finance the business (debt or equity) and over what period to depreciate fixed assets. EBITDA is typically closer to actual cash flow than is NOPAT (discussed later in the chapter).
EBITDA can be calculated by adding back the costs of interest, depreciation, and amortization charges and any taxes incurred.
EBITDA ($) = Net Profit ($) + Interest Payments ($) + Taxes Incurred ($) + Depreciationand Amortization Charges ($)
Data Sources, Complications, and Cautions
Although it is theoretically possible to calculate profits for any sub-unit, such as a product or region, often the calculations are rendered suspect by the need to allocate overhead costs. Because overhead costs often don’t come in neat packages, their allocation among the divisions or product lines of the company can often be more art than science.
For return on sales, it is worth bearing in mind that a “healthy” figure depends on the industry and capital intensity (amount of assets per sales dollar). Return on sales is similar to margin (%), except that ROS accounts for overheads and other fixed costs that are often ignored when calculating margin (%) or contribution margin (%). (Refer to Section 3.1.)
Related Metrics and Concepts
Net operating profit after tax (NOPAT) deducts relevant income taxes but excludes some items that are deemed to be unrelated to the main (“operating”) business.
10.2 Return on Investment
Return on investment is one way of considering profits in relation to capital invested.
Return on assets (ROA), return on net assets (RONA), return on capital (ROC), and return on invested capital (ROIC) are similar measures with variations on how “investment” is defined.
Marketing not only influences net profits but also can affect investment levels too. New plants and equipment, inventories, and accounts receivable are three of the main categories of investments that can be affected by marketing decisions.
Purpose: To measure per period rates of return on dollars invested in an economic entity.
ROI and related metrics (ROA, ROC, RONA, and ROIC) provide a snapshot of profitability adjusted for the size of the investment assets tied up in the enterprise. Marketing decisions have obvious potential connection to the numerator of ROI (profits), but these same decisions often influence assets usage and capital requirements (for example, receivables and inventories). Marketers should understand the position of their company and the returns expected. ROI is often compared to expected (or required) rates of return on dollars invested.
Construction
For a single period review just divide the return (net profit) by the resources that were committed (investment):
Data Sources, Complications, and Cautions
Averaging the profits and investments over periods such as one year can disguise wide swings in profits and assets, especially inventories and receivables. This is especially true for seasonal businesses (such as some construction materials and toys). In such businesses it is important to understand these seasonal variations to relate quarterly and annual figures to each other.
Related Metrics and Concepts
Return on assets (ROA), return on net assets (RONA), return on capital employed (ROCE), and return on invested capital (ROIC) are commonly used variants of ROI. They are also calculated using net profit as the numerator, but they have different denominators. The relatively subtle distinctions between these metrics are beyond the scope of this book. Some differences are found in whether payables are subtracted from working capital and how borrowed funds and stockholder equity are treated.
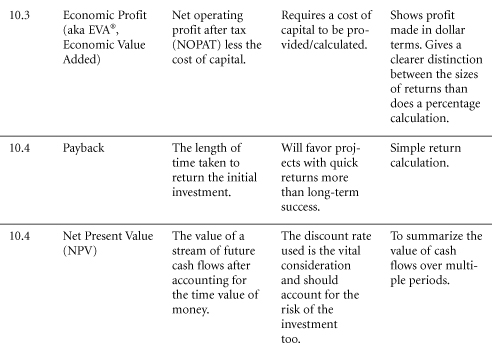
10.3 Economic Profit—EVA
Purpose: To measure dollar profits while accounting for required returns on capital invested.
Economic profit, sometimes called residual income, or EVA, is different from “accounting” profit—in that economic profit also considers the cost of invested capital—the opportunity cost (see Figure 10.2). Like the discount rate for NPV calculations, this charge should also account for the risk associated with the investment. A popular (and proprietary) way of looking at economic profit is economic value added.1
Increasingly, marketers are being made aware of how some of their decisions influence the amount of capital invested or assets employed. First, sales growth almost always requires additional investment in fixed assets, receivable, or inventories. Economic profit and EVA help determine whether these investments are justified by the profit earned. Second, the marketing improvements in supply chain management and channel coordination often show up in reduced investments in inventories and receivables. In some cases, even if sales and profit fall, the investment reduction can be worthwhile. Economic profit is a metric that will help assess whether these trade-offs are being made correctly.
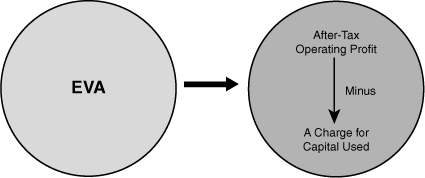
Figure 10.2 EVA Is After-Tax Profit Minus a Charge for Capital Usage
Construction
Economic profit/economic value added can be calculated in three stages. First, determine NOPAT (net operating profit after tax). Second, calculate the cost of capital by multiplying capital employed by the weighted average cost of capital.2The third stage is to subtract the cost of capital from NOPAT.
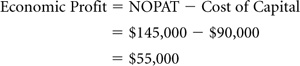
Economic Profit ($) = Net Operating Profit After Tax (NOPAT) ($) - Cost of Capital ($)
Cost of Capital ($) = Capital Employed ($) * WACC (%)
Economic Profit: If your profits are less than the cost of capital, you have lost value for the firm. Where economic profit is positive, value has been generated.
EXAMPLE: A company has profits—NOPAT—of $145,000.
They have a straightforward capital structure, half of which is supplied by shareholders. This equity expects a 12% return on the risk the shareholders are taking by investing in this company. The other half of the capital comes from a bank at a charge of 6%:
Weighted average cost of capital (WACC) therefore
= Equity (12% * 50%) + Debt (6% * 50%) = 9%
The company employs total capital of $1 million. Multiplying the capital employed by the weighted average cost for the capital employed will give us an estimate of the profit (return) required to cover the opportunity cost of capital used in the business:
Economic profit is the surplus of profits over the expected return to capital.
Data Sources, Complications, and Cautions
Economic profit can give a different ranking for companies than does return on investment. This is especially true for companies such as Wal-Mart and Microsoft that have experienced (achieved) high rates of growth in sales. Judging the results of the giant U.S. retailer Wal-Mart by many conventional metrics will disguise its success. Although the rates of return are generally good, they hardly imply the rise to dominance that the company achieved. Economic profit reflects both Wal-Mart’s rapid sales growth and its adequate return on the capital invested. This metric shows the magnitude of profits after the cost of capital has been subtracted. This combines the idea of a return on investment with a sense of volume of profits. Simply put, Wal-Mart achieved the trick of continuing to gain decent returns on a dramatically increasing pool of capital.
10.4 Evaluating Multi-period Investments
Multi-period investments are commonly evaluated with three metrics.
These three metrics are designed to deal with different aspects of the risk and returns of multi-period projects.
Purpose: To evaluate investments with financial consequences spanning multiple periods.
Investment is a word business people like. It has all sorts of positive connotations of future success and wise stewardship. However, because not all investments can be pursued, those available must be ranked against each other. Also, some investments are not attractive even if we have enough cash to fund them. In a single period, the return on any investment is merely the net profits produced in the time considered divided by the capital invested. Evaluation of investments that produce returns over multiple periods requires a more complicated analysis—one that considers both the magnitude and timing of the returns.
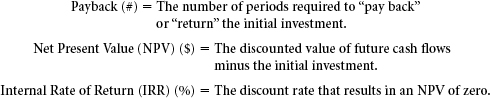
Payback (#): The time (usually years) required to generate the (undiscounted) cash flow to recover the initial investment.
Net Present Value—NPV ($): The present (discounted) value of future cash inflows minus the present value of the investment and any associated future cash outflows.
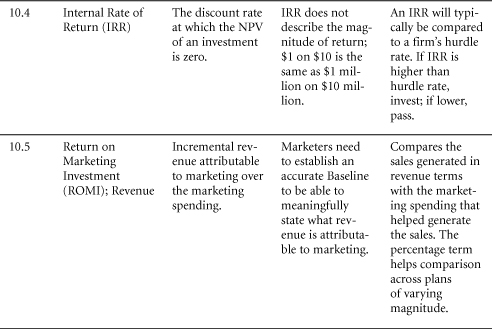
Internal Rate of Return—IRR (%): The discount rate that results in a net present value of zero for a series of future cash flows after accounting for the initial investment.
Construction
Payback: The years required for an investment to return the initial investment.
Projects with a shorter payback period by this analysis are regarded more favorably because they allow the resources to be reused quickly. Also, generally speaking, the shorter the payback period, the less uncertainty is involved in receiving the returns. Of course the main flaw with payback period analysis is that it ignores all cash flows after the payback period. As a consequence, projects that are attractive but that do not produce immediate returns will be penalized with this metric.
Net Present Value
Net present value (NPV) is the discounted value of the cash flows associated with the project.
The present value of a dollar received in a given number of periods in the future is
This is easiest to see when set out in spreadsheet form.
A 10% discount rate applied to $1 received now and in each of the next three years reduces in value over time as shown in Table 10.1.
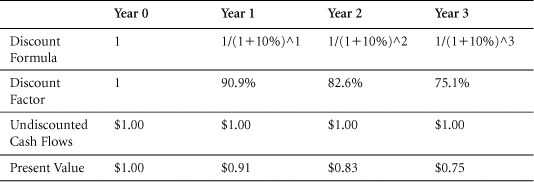
Table 10.1 Discounting Nominal Values
Spreadsheets make it easy to calculate the appropriate discount factors.
EXAMPLE: Harry wants to know the dollar value of his business opportunity. Although he is confident about the success of the venture, all future cash flows have a level of uncertainty. After receiving a friend’s advice, he decides a 10% discount rate on future cash flows is about right.
He enters all the cash flow details into a spreadsheet (see Table 10.2 ).3 Harry works out the discount factor using the formula and his discount rate of 10%:
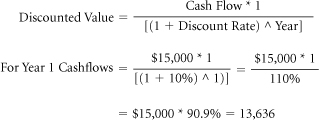
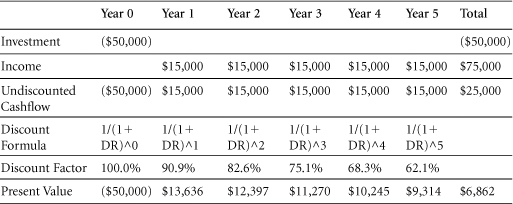
Table 10.2 Discounted Cashflow (10% Discount Rate)
The NPV of Harry’s project is $6,862. Of course the NPV is lower than the sum of the undiscounted cash flows. NPV accounts for the fact that on a per-dollar basis, cash flows received in the future are less valuable than cash in the hand.
Internal Rate of Return
The internal rate of return is the percentage return made on the investment over a period of time. The internal rate of return is a feature supplied on most spreadsheets and thus is relatively easy to calculate.
Internal Rate of Return (IRR): The discount rate for which the net present value of the investment is zero.
The IRR is especially useful because it can be compared to a company’s hurdle rate. The hurdle rate is the necessary percentage return to justify a project. Thus a company might decide only to undertake projects with a return greater than 12%. Projects that have an IRR greater than 12% get the green light; all others are thrown in the bin.
EXAMPLE: Returning to Harry, we can see that IRR is an easy calculation to perform using a software package. Enter the values given in the relevant periods on the spreadsheet (see Table 10.3 ).
Year 0—now—is when Harry makes the initial investment; each of the next five years sees a $15,000 return. Applying the IRR function gives a return of 15.24%.
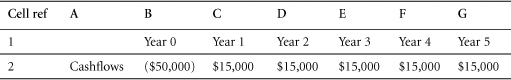
Table 10.3 Five-Year Cashflow
In Microsoft Excel, the function is = IRR(B2:G2)
which equals 15.24%.
The cell references in Table 10.3 should help in re-creating this function. The function is telling Excel to perform an IRR on the range B2 (cashflow for year 0) to G2 (cashflow for year 5).
IRR and NPV are Related
The internal rate of return is the percentage discount rate at which the net present value of the operation is zero.
Thus companies using a hurdle rate are really saying that they will only accept projects where the net present value is positive at the discount rate they specify as the hurdle rate. Another way to say this is that they will accept projects only if the IRR is greater than the hurdle rate.
Data Sources, Complications, and Cautions
Payback and IRR calculations require estimates of cash flows. The cash flows are the monies received and paid out that are associated with the project per period, including the initial investment. Topics that are beyond the scope of this book include the time frame over which forecasts of cash flows are made and how to handle “terminal values” (the value associated with the opportunity at the end of the last period).4Net present value calculations require the same inputs as payback and IRR, plus one other: the discount rate. Typically, the discount rate is decided at the corporate level. This rate has a dual purpose to compensate for the following:
• The time value of money
• The risk inherent in the activity
A general principle to employ is that the riskier the project, the greater the discount rate to use. Considerations for setting the discounts rates are also beyond the scope of this book. We will simply observe that, ideally, separate discount rates would be assessed for each individual project because risk varies by activity. A government contract might be a fairly certain project—not so for an investment by the same company in buying a fashion retailer. The same concern occurs when companies set a single hurdle rate for all projects assessed by IRR analysis.
Cashflows and Net Profits: In our examples cash flow equals profit, but in many cases they will be different.
A Note for Users of Spreadsheet Programs
Microsoft Excel has an NPV calculator, which can be very useful in calculating NPV. The formula to use is NPV(rate,value1,value2, etc.) where the rate is the discount rate and the values are the cash flows by year, so year 1 = value 1, year 2 = value 2, and so on.
The calculation starts in period one, and the cash flow for that period is discounted. If you are using the convention of having the investment in the period before, i.e. period 0, you should not discount it but add it back outside the formula. Therefore Harry’s returns discounted at 10% would be
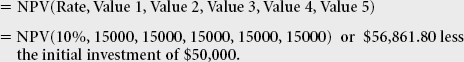
This gives the NPV of $6,861.80 as demonstrated fully in the example.
10.5 Return on Marketing Investment
Return on marketing investment (ROMI) is a relatively new metric. It is not like the other “return-on-investment” metrics because marketing is not the same kind of investment. Instead of moneys that are “tied” up in plants and inventories, marketing funds are typically “risked.” Marketing spending is typically expensed in the current period. There are many variations in the way this metric has been used, and although no authoritative sources for defining it exist, we believe the consensus of usage justifies the following:
The idea of measuring the market’s response in terms of sales and profits is not new, but terms such as marketing ROI and ROMI are used more frequently now than in past periods. Usually, marketing spending will be deemed as justified if the ROMI is positive.
Purpose: To measure the rate at which spending on marketing contributes to profits.
Marketers are under more and more pressure to “show a return” on their activities. However, it is often unclear exactly what this means. Certainly, marketing spending is not an “investment” in the usual sense of the word. There is usually no tangible asset and often not even a predictable (quantifiable) result to show for the spending, but marketers still want to emphasize that their activities contribute to financial health. Some might argue that marketing should be considered an expense and the focus should be on whether it is a necessary expense. Marketers believe that many of their activities generate lasting results and therefore should be considered “investments” in the future of the business.5
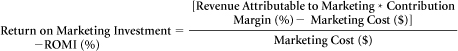
Return on Marketing Investment (ROMI): The contribution attributable to marketing (net of marketing spending), divided by the marketing “invested” or risked.
Construction
A necessary step in calculating ROMI is the estimation of the incremental sales attributable to marketing. These incremental sales can be “total” sales attributable to marketing or “marginal.” The following example, in Figure 10.3, should help clarify the difference:

where the difference between X1 and X2 represents the cost of an incremental marketing budget item that is to be evaluated, such as an advertising campaign or a trade show.
1. Revenue Return to Incremental Marketing = (Y2 – Y1)/(X2 – X1): The additional revenue generated by an incremental marketing investment, such as a specific campaign or sponsorship, divided by the cost of that marketing investment.
2. Revenue Attributable to Marketing = Y2 – Y0: The increase in sales attributable to the entire marketing budget (equal to sales minus baselines sales).
3. Revenue Return to Total Marketing = (Y2 – Y0)/(X2): The revenue attributable to marketing divided by the marketing budget.
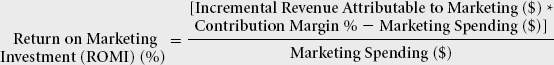
4. Return on Marketing Investment (ROMI) = [(Y2 – Y0) * Contribution Margin (%) – X2]/X2: The additional net contribution from all marketing activities divided by the cost of those activities.
5. Return on Incremental Marketing Investment (ROIMI) = [(Y2 – Y1) * Contribution Margin (%) – (X2 – X1)]/(X2 – X1): The incremental net contribution due to the incremental marketing spending divided by the amount of incremental spending.
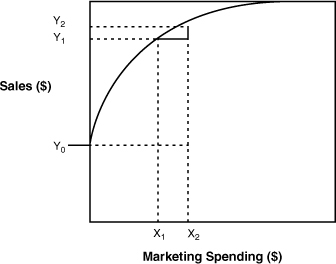
Figure 10.3 Evaluating the Cost of an Incremental Marketing Budget Item
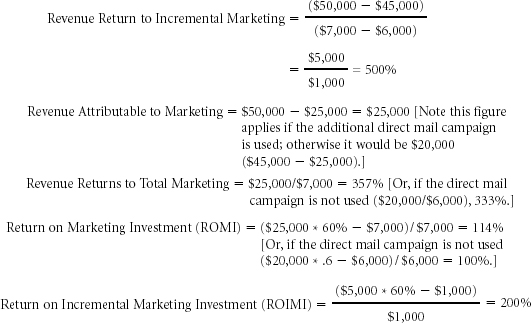
For some industries the revenue–based metrics might be useful, but for most situations these metrics are liable to be very misleading. ROMI or ROIMI (see following examples) are generally more useful. However, for most situations this metric is liable to be very misleading. There is no point in spending $20,000 on advertising to generate $100,000 of sales—a respectable 500% return to revenue—if high variable costs mean the marketing only generates a contribution of $5,000.
EXAMPLE: Each of the metrics in this section can be calculated from the information in the example.
Data Sources, Complications, and Cautions
The first piece of information needed for marketing ROI is the cost of the marketing campaign, program, or budget. Although defining which costs belong in marketing can be problematic, a bigger challenge is estimating the incremental revenue, contribution, and net profits attributable to marketing. This is similar to the distinction between baseline and lift discussed in Section 8.1.
A further complication of estimating ROMI concerns how to deal with important interactions between different marketing programs and campaigns. The return on many marketing “investments” is likely to show up as an increase in the responses received for other types of marketing. For example, if direct mail solicitations show an increase in response because of television advertising, we could and should calculate that those incremental revenues had something to do with the TV campaign. As an interaction, however, the return on advertising would depend on what was being spent on other programs. The function is not a simple linear return to the campaign costs.
For budgeting, one key element to recognize is that maximizing the ROMI would probably reduce spending and profits. Marketers typically encounter diminishing returns, in which each incremental dollar will yield lower and lower incremental ROMI, and so low levels of spending will tend to have very high return rates. Maximizing ROMI might lead to reduced marketing and eliminating campaigns or activities that are, on balance, profitable, even if the return rates are not as high. This issue is similar to the distinction between ROI (%) and EVA ($) discussed in Sections 10.2 and 10.3. Additional marketing activities or campaigns that bring down average percentage returns but increase overall profits can be quite sensible. So, using ROMI or any percentage measure of profit to determine overall budgets is questionable. Of course, merely eliminating programs with a negative ROMI is almost always a good idea.
The previous discussion intentionally does not deal with carryover effect, that is, marketing effects on sales and profits that extend into future periods. When marketing spending is expected to have effects beyond the current period, other techniques will be needed. These include payback, net presented value, and internal rate of return. Also, see customer lifetime value (Section 5.3) for a more disaggregated approach to evaluating marketing spending designed to acquire long–lived customer relationships.
Related Metrics
Media Exposure Return on Marketing Investment: In an attempt to evaluate the value of marketing activities such as sponsorships, marketers often commission research to gauge the number and quality of media exposures achieved. These exposures are then valued (often using “rate cards” to determine the cost of equivalent advertising space/time) and a “return” is calculated by dividing the estimated value by the costs.
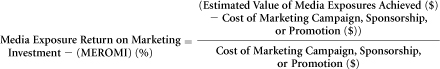
This is most appropriate where there isn’t a clear market rate for the results of the campaign and so marketers want to be able to illustrate the equivalent cost for the result for a type of campaign that has an established market rate.
References and Suggested Further Reading
Hawkins, D. I., Roger J. Best, and Charles M. Lillis. (1987). “The Nature and Measurement of Marketing Productivity in Consumer Durables Industries: A Firm Level Analysis,” Journal of the Academy of Marketing Science, 1(4), 1–8.