
6. Strategy, Performance Measurement, and Risk Management
As we mentioned in Chapter 3, “Board of Directors: Duties and Liability,” the Organisation for Economic Co-operation and Development (OECD) states that one of the primary responsibilities of the board is to “ensure the strategic guidance of the company.” The UK Corporate Governance Code recommends that directors “constructively challenge and help develop proposals on strategy.”1 Furthermore, survey data from the National Association of Corporate Directors (NACD) indicates that directors themselves consider strategic planning and oversight to be their most important responsibility—more than financial oversight, CEO succession planning, compensation, and shareholder relations.2
Consensus holds that strategic oversight is crucial, but the manner in which the board is expected to perform this function is less clear. The confusion arises primarily because it is not the board’s responsibility to develop the strategy; that is management’s job. Instead, the board is expected to scrutinize the strategy to make sure that it is appropriate for the company’s shareholders and stakeholders and then to monitor the contribution of corporate activities to the strategic plan.
We break the discussion of strategy development and oversight into four parts:
1. Defining the corporate strategy
2. Developing and testing a business model that verifies how the strategy translates into shareholder or stakeholder value
3. Identifying key indicators to measure corporate performance
4. Identifying and developing processes to mitigate risks to the strategy and business model
Organizational Strategy
Developing the corporate strategy begins with identifying the organization’s overarching mission and specific objectives. It answers questions such as, “Why are we in business?” and “What do we hope to achieve?” For example, Lockheed Martin publishes on its Web site a mission statement that outlines corporate vision and values:
Lockheed Martin’s Vision:
Be the global leader in supporting our customers to strengthen global security, deliver citizen services and advance scientific discovery.
Lockheed Martin’s Value Statements:
Do What’s Right
We are committed to the highest standards of ethical conduct in all that we do. We believe that honesty and integrity engender trust, which is the cornerstone of our business. We abide by the laws of the United States and other countries in which we do business; we strive to be good citizens and we take responsibility for our actions.
Respect Others
We recognize that our success as an enterprise depends on the talent, skills, and expertise of our people and our ability to function as a tightly integrated team. We appreciate our diversity and believe that respect—for our colleagues, customers, partners, and all those with whom we interact—is an essential element of all positive and productive business relationships.
Perform with Excellence
We understand the importance of our missions and the trust our customers place in us. With this in mind, we strive to excel in every aspect of our business and approach every challenge with a determination to succeed.3
The mission statement becomes the basis for developing the corporate strategy. The corporate strategy is how a company expects to create long-term value for shareholders and stakeholders, within the confines of the corporate mission. It answers questions such as, “What business are we in?” and “How can we create value by being in this business?” Strategic considerations include new market entry, acquisitions and divestures, branding, reorganizations, and other similar transformational decisions.
An organization considers multiple aspects when developing its corporate strategy:
• Scope—What is the scope of activities that the business will participate in over the long term?
• Markets—What markets will the business participate in?
• Advantage—What advantages does the company have to ensure that it can compete?
• Resources—What resources does the company have (in terms of property, plant, and equipment; human and intellectual capital; customer and supplier networks; and finances) that are required to compete?
• Environment—What factors in the market environment influence how the company competes?
• Stakeholders—Who are the internal and external stakeholders that influence the business, directly or indirectly?4
For example, we can imagine that Lockheed Martin’s strategy is to provide cutting-edge innovation in defense, equipment, and technology to give its customers (primarily the U.S. government) a competitive advantage in security and combat. The company achieves an advantage by capitalizing on a base of technological sophistication and proprietary knowledge that it has built up during decades of research and development funding and proven success in attracting and retaining highly specialized engineering talent.
As we stated earlier, it is management’s responsibility to define the corporate strategy. Various models assist in this task, such as those outlined in Strategic Management, by Saloner, Shepard, and Podolny (2005), and Competitive Strategy, by Porter (1998).5 In some cases, a management consulting firm is retained to bring objectivity and third-party expertise to the exercise (see the following sidebar).
Strategy Implementation Process
The board of directors needs to understand and evaluate the key elements of the strategy identification and implementation process. We illustrate this process using the generic example of a consumer products company. For simplicity, we follow a linear approach:
• Establish the overarching objective of the firm. If the board takes a purely shareholder perspective, the objective might be to produce total shareholder returns (TSR) that are superior to those of its direct competitors. If it takes a stakeholder perspective, it might establish additional objectives that are of concern to nonshareholder constituents (such as maintaining present employment levels, protecting the environment, and so on).
Example: Target long-term TSR of 10 percent per year.
• Determine the outcomes that are necessary to achieve the TSR target. Management might propose explicit goals for sales growth, return on capital, free cash flow, and other economic metrics that are consistent with the TSR target. The finance group, in consultation with officers in the functional areas of the company, performs the analysis that supports these goals. The group will likely take into account the growth prospects of the industry and the relationship between financial returns and shareholder value. Board members test the assumptions underlying these computations to ensure that these goals are reasonable and that the relationship between the economic results and value creation is correct.
Example: Sales growth of 6 percent per year, free cash flow growth of 8 percent, and return on equity of 15 percent.
• Assess the viability of specific strategies to achieve the company’s economic targets.
Example: Develop products at three price points: basic, middle-tier, and premium. The company seeks to increase adoption and encourage consumers to migrate up the value chain, thereby delivering increased sales and profitability. Higher margins, productivity increases, and economies of scale will drive growth in free cash flow.
• Assign targets (both financial and nonfinancial) that will enable the company to measure the success of its strategy over time.
Example: The company might set financial targets for cash flow and revenue growth from new products and nonfinancial targets for market share, pricing, product attributes, advertising support, research and development productivity, customer satisfaction, brand awareness and strength, and so on. If targets are achieved, the company expects to succeed in its revenue and profitability goals and ultimately achieve its TSR target.
To satisfy itself that company goals are achievable, the board needs to review a causal business model of the organization. A causal business model links specific financial and nonfinancial measures in a logical chain to delineate how the corporate strategy translates into the accomplishment of stated goals. The board should evaluate the business model for logical consistency, realism of targets, and statistical evidence that the relationships between performance measures and stated goals are valid.
The board might test management assumptions by asking questions such as these: If we launch a product with the desired attributes, backed by a pricing, packaging, and advertising strategy, will we achieve the customer satisfaction levels that we anticipate? Will customers engage in repeat purchases? Will we achieve the desired sales volumes? What evidence (statistical, not anecdotal) do we have that these relationships are valid for our company? What metrics will we put in place to measure our progress, and how will we capture this data?
This task is extremely difficult because it requires input and agreement from all major functional areas of the firm. For example, analysis should be performed by marketing (What does it take to get the right customers?), human resources (What does it take to get the right employees?), manufacturing (What needs to be done so that we can produce the units in a timely manner?), and engineering (How can we increase new product development?).
The business model serves an important purpose: It specifies how management expects to create long-term value. The business model lays out a concrete plan (value propositions) that the board can test and evaluate when approving the corporate strategy. From a governance perspective, the business model is an important tool that the board can rely on to fulfill its oversight function. By examining the logical chain presented by management, the board can challenge assumptions and eventually recognize that the corporate strategy is sound. This model also provides the basis for measuring management performance and awarding compensation. To perform this function adequately, directors must have the requisite industry knowledge and business background to carefully examine the model and use informed judgment (see the following sidebar).
Business Model Development and Testing
Following are two real-world examples that illustrate how companies have used statistical data analysis to explore the causal relationship between financial and nonfinancial performance drivers and future operating performance.
Example 1: Fast-Food Chain and Employee Turnover
The board of directors and the senior management team at a major fast-food restaurant chain decided that the company was not growing fast enough. At the request of the board, senior-level executives across the various functional areas of the company convened to examine how and why the company was falling short. Executives outlined what they believed to be a simple causal model of how the company made money (see Figure 6.1).8
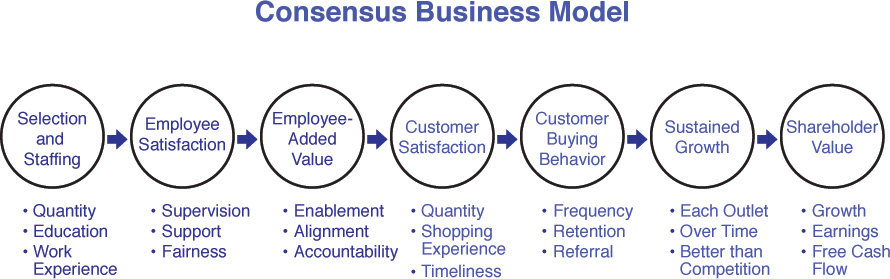
The group built this model based on an assumption that customer satisfaction was a key driver of operating performance. They hypothesized that employee performance played a critical role in influencing customer satisfaction and that hiring and retention practices were the most important determinants of employee performance.
The company acted on this model even though it had not been verified through formal data analysis. Executives launched a series of strategic initiatives to improve employee performance. These initiatives centered on improving employee hiring practices and improving employee satisfaction. They measured the success of these initiatives through a nonfinancial performance indicator: employee turnover. To support a reduction in turnover, the company implemented an expensive human resource program that included retention bonus awards for all restaurant employees.
Only subsequently did the company undertake a detailed statistical analysis at the store level. The results were not what the company had expected. It turned out that groups of stores with the same overall employee turnover rates exhibited very different financial performance. In addition, several high-profit stores had employee turnover that was significantly above average. These findings contradicted the premise of the company’s causal model. The expected correlation between employee turnover and store performance did not exist. The true driver of store performance was not general turnover but turnover among store managers. A restaurant suffered a drop in performance when the supervisory personnel turned over. This was because a change in manager impacted consistency of training, food preparation, cleanliness, and other operating processes—at least until the new store manager got up to speed with the new responsibilities.
Based on these findings, senior management shifted its priority from reducing the turnover of all store employees to reducing the turnover of store managers. Retention bonuses were put in place at the store manager level. Further analysis provided an estimate for the financial cost of turnover, which was used to create an upper bound for the size of the retention bonus.
This somewhat simple business model provided new insights into the value-creation process at this company. It became a tool for strategic discussions with the board of directors, and the board was provided summary data on the most important performance indicators, including store manager turnover, to measure corporate performance.
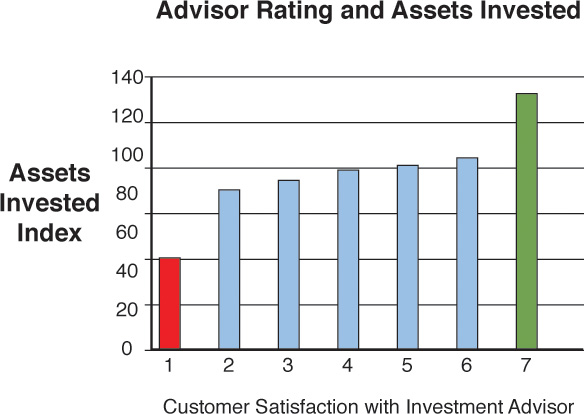
Example 2: Financial Services Firm and Investment Advisor Retention
A large financial services organization had a goal of being a “world leader in financial advisory and brokerage services to retail investors.” From prior statistical analyses, executives and the board knew that customer retention and assets under management were key success indicators that directly impacted economic results (see Figure 6.2). Furthermore, this analysis revealed that the level of satisfaction with the investment advisor was positively correlated with the level of assets that the customer entrusted to the company.
At the board’s request, management undertook further statistical analysis to better understand the factors that contributed to a customer’s satisfaction with an investment advisor. They found several, including the advisor’s trustworthiness, responsiveness, and knowledge. However, one factor in particular was the most important: advisor turnover. Customers wanted to deal with the same advisor over time, and when they were shuttled around from one advisor to another, they became dissatisfied—even if the new advisor scored high on the personal attributes mentioned earlier (see Figure 6.3).
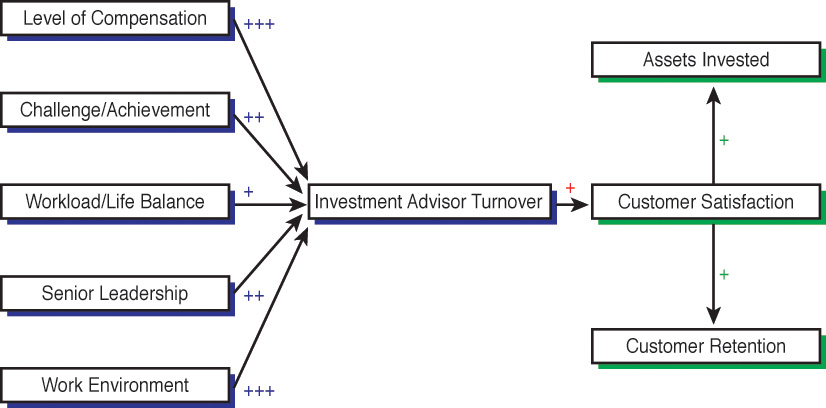
Management used this knowledge to explore the factors that contributed to advisor turnover. Statistical analysis revealed that they were (in decreasing order) compensation level, work environment, challenging career opportunities, quality of branch management, and work/life balance. The company used these insights to develop a human resources plan to address the compensation issues (changing the level and mix of short- and long-term remuneration). More importantly, senior management and the board now had a rigorous business model to filter strategic planning decisions and key performance metrics to track management performance. Going forward, the board’s review of corporate performance included not only the traditional metrics of profitability and assets under management (AUM) but also the newly devised metrics of customer satisfaction, advisor satisfaction, and advisor turnover.
Key Performance Measures
As highlighted in these two examples, an important output from the business model is that it serves as the basis for identifying key performance measures that the board can later use to evaluate management performance and award bonuses. Key performance measures, or key performance indicators (KPIs), include both financial and nonfinancial metrics that validly reflect current and future corporate performance. For example, in the financial services firm example, the business model highlighted the need to use investment advisor turnover and satisfaction, as well as customer satisfaction—in addition to traditional financial measures—as KPIs.
The board also uses key performance measures to evaluate management performance and award compensation. For example, if a company believes that the success of a new product launch should be measured in terms of market share, brand awareness, gross margins, and sale volume, these should be the metrics that the board follows both to determine management’s success and to award compensation.
KPIs are roughly grouped into two categories: financial and nonfinancial. Financial KPIs include measures such as total shareholder return; revenue growth; earnings per share; earnings before interest, taxes, depreciation, and amortization (EBITDA); return on capital; economic value added (EVA); and free cash flow. Nonfinancial KPIs include measures such as customer satisfaction, employee satisfaction, defects and rework, on-time delivery, worker safety, environmental safety, and research and development (R&D) pipeline productivity. Because of their common usefulness, certain KPIs are broadly used by many companies. Others are used by a more limited set of companies—because of the specificity of their line of business—and include both financial and nonfinancial measures, such as sales per square foot (retailing), R&D productivity (science and technology), and factory downtime (manufacturing). Whatever KPIs a company selects, it is important that they be closely tied to the company business model (see Table 6.1 for commonly used KPIs).
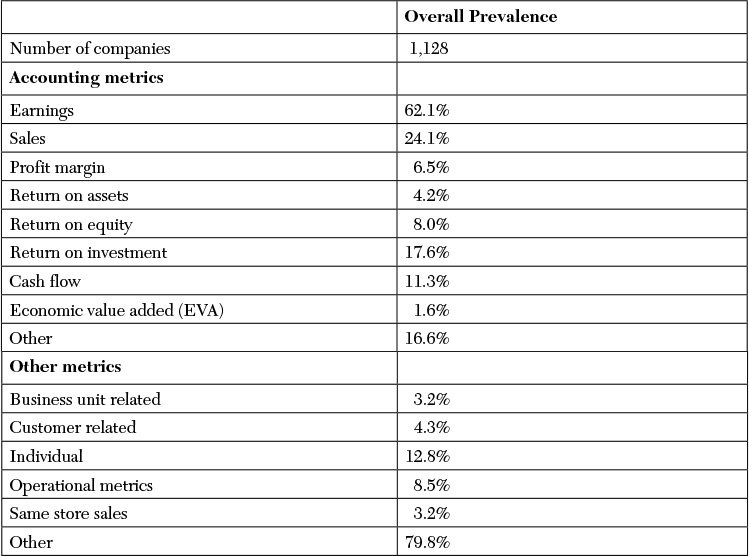
Note: Performance measures used to award equity-based performance awards.
Source: J. Carr Bettis, John Bizjak, Jeffrey Coles, and Swaminathan Kalpathy, “Performance-Vesting Provisions in Executive Compensation,” Paris December 2014 Finance Meeting EUROFIDAI – AFFI Paper, Social Science Research Network, (2013). Accessed May 5, 2015. See http://ssrn.com/abstract=2289566.
Table 6.1 Measures to Determine Corporate Performance (2012)
Research has shown that companies tend to use multiple performance measures, including a mix of financial and nonfinancial KPIs. de Angelis and Grinstein (2012) found that the KPIs used to award executive bonuses tend to be weighted toward accounting measures, particularly those related to corporate profitability—such as earnings per share, net income growth, and earnings before interest and taxes (EBIT).9 Ittner, Larcker, and Rajan (1997) and Kim and Yang (2010) found that companies rely on a mix of quantitative and qualitative factors in awarding bonuses. Qualitative factors include those related to strategic development, individual performance, customer satisfaction, employee satisfaction, and workplace safety.10 Cornelli, Kominek, and Ljungqvist (2013) found that nonquantifiable information (such as leadership style and competence) plays a larger role than so-called hard data in measuring CEO performance.11
Although nonfinancial measures are important, boards must be aware of the risks involved in using them. By their nature, nonfinancial measures are more easily subject to measurement error or manipulation. Others are difficult to track with precision. Following are some of the key factors for the board to consider when relying on performance measures:12
• Sensitivity—How sensitive is the metric to corporate performance? How sensitive is the metric to management action?
• Precision—How much measurement error is embedded in the measure? What is the potential for intentional manipulation?
• Verifiability—Can the measure be audited or otherwise independently verified?
• Objectivity—Is the measure objective (such as number of safety incidents) or subjective (such as level of employee commitment)? Do these different categories of measures have similar sensitivity, precision, and verifiability?
• Dimension—Are the results expressed as a percentage, survey scale, number of occurrences, or binary outcome? Would the metric lend itself to different interpretation if expressed in a different manner?
• Interpretation—What specific attribute does the data measure? (For example, does product failure rate measure the quality of the manufacturing process or the quality of the product design?)
• Cost—What is the cost to develop and track this metric? Does it provide sufficient value to the board, compared to the cost?
Research evidence supports the importance of these efforts. Ittner and Larcker (2003) found that companies that develop a causal business model based on KPIs exhibit significantly higher returns on assets and returns on equity during five-year periods than those that do not.13 The authors identified three benefits of this process: enhanced internal communication on strategic assumptions, better identification and measurement of strategic value drivers, and improved resource allocation and target setting. Gates (1999) found that companies with a formal set of strategic performance measures tend to exhibit superior stock price returns compared to companies that do not have such measures.14 Relative performance is even more favorable when such measures are regularly shared with the board of directors, investors, and analysts.
Furthermore, it is important that companies consider using both financial and nonfinancial measures. Researchers have repeatedly shown that nonfinancial KPIs can be a leading indicator of subsequent financial performance. For example, Ittner and Larcker (1998) found that customer satisfaction was a leading indicator of future financial performance in a sample of banking and telecommunications companies.15 Banker, Potter, and Schroeder (1993) demonstrated a similar relationship between customer satisfaction and future financial results in the hospitality industry.16 Nagar and Rajan (2001) demonstrated a correlation between manufacturing quality measures and future revenue growth in manufacturing firms.17 It is therefore critical that boards understand the relationship between nonfinancial measures and subsequent financial performance when deciding on a set of KPIs.
However, the importance of nonfinancial targets depends on the company’s strategy and operating environment. For example, Ittner, Larcker, and Rajan (1997) found that nonfinancial measures take on greater importance when a company is pursuing an innovation strategy (such as new ventures that are cash-flow negative) or a quality strategy (such as the implementation of total quality management [TQM] or lean manufacturing).18 Said, HassabElnaby, and Wier (2003) supported these findings. They found a greater prevalence of nonfinancial measures among companies that are pursuing an “innovation” or “quality” strategy, companies whose products are subject to long development cycles (such as aircraft manufacturers), companies that are in highly regulated industries (such as railroads), and companies in financial distress.19 These studies suggest that nonfinancial measures are particularly important when a company’s current strategy does not lend itself well to short-term financial targets.
How Well Are Boards Doing with Performance Measures and Business Models?
Deloitte undertook one of the most detailed analyses of this subject in a two-part study titled “In the Dark: What Boards and Executives Don’t Know about the Health of Their Businesses” (2004 and 2007).20 Based on a sample of 250 directors and executives at large international corporations, the report found a surprising disconnect between the metrics that board members and executives say are important drivers of firm performance and the KPIs that the companies actually use to track results.
More than 90 percent of respondents claimed that both financial and nonfinancial factors are critical to their company’s success. Commonly cited nonfinancial measures included customer satisfaction (97 percent), product or service quality (96 percent), and employee commitment (92 percent). Yet when asked to assess the quality of information they receive regarding each of these measures, respondents claimed to have good visibility into only one: financial results (91 percent). The quality of information regarding nonfinancial measures was rated much lower, including product or service quality (52 percent reporting “excellent” or “good” information), customer satisfaction (46 percent), and employee commitment (41 percent). That is, evidence points to a shockingly large disconnect between the information that is important for understanding value creation and the information that is actually being supplied to the board.
More surprisingly, board members did not appear to have an explanation for why they were not receiving this information. The most frequently cited reason was that the company has “undeveloped tools for analyzing such measures” (59 percent). That is, information on these performance measures was not captured because no one has taken the time to formulate a proper system for tracking them. If true, this is a serious lapse in oversight on the part of directors. The study concluded that a “gap [exists] between awareness and action, rhetoric and reality”:
Until this gap narrows, board directors, managers, and investors remain less well-informed about the true state of their companies’ health than they would otherwise. [N]onfinancial measurements of performance . . . can provide the board and management with a vital guide to help steer the company toward long-term success. Yet too many companies focus their attention on financial data and too few rigorously monitor other performance measures.
Ittner, Larcker, and Randall (2003) found similar results. The metrics that are the most important drivers of long-term organizational success suffer from very low measurement quality (see Figure 6.4). According to the study, the only measure that had higher measurement quality than importance is short-term financial accounting results. By contrast, metrics about customer satisfaction, product quality, innovation, and other important drivers were not tracked through reliable metrics. These measures had higher importance than measurement quality.21

Adapted from Christopher D. Ittner, David F. Larcker, and Taylor Randall (2003).
Figure 6.4 The importance of metrics vs. the quality of their measurement.
All this suggests that many boards might be falling short of their duty to oversee firm strategy and performance. They can redress this deficiency by demanding more detailed information about the full set of KPIs that contribute to future operating success and then tracking those measures to assess the performance of management. With this information, boards can better understand the factors contributing to success or failure, as well as manage organizational risks.
Risk and Risk Management
The notion of risk is largely absent from the preceding discussion. Our focus was on the desired outcome instead of the range of outcomes that might occur. Although we emphasized the positive outcomes that arise from establishing a sound strategy and valid business model, we did not consider the loss of value that occurs when things do not work out as planned. Nor did we discuss the policies and procedures that a company might put in place to mitigate such losses. Now we take up that discussion.
First, we define the concept of risk in terms of its relationship to the corporate strategy and business model. Then we discuss what is meant by risk management. Finally, we consider the role the board plays in both understanding organizational risk and implementing the policies and procedures necessary to ensure that it is managed properly.
It is important to highlight that when we speak of risk management in this chapter, we are not talking about simple compliance with laws and regulations. We are treating it as a minimum standard that organizations attempt to conduct their affairs within the guidelines established by governments and federal agencies. When we speak of risk management, we are addressing the bigger picture involving outcomes or events that can reduce a company’s profitability, lead to severe underperformance, or otherwise threaten an organization’s success or viability.
The importance of this topic has been underscored by the large number of corporate failures that occurred following the financial crisis of 2008. Many casualties of the crisis—such as American International Group, Bear Stearns, and Lehman Brothers—simply did not understand the risks they were exposed to because of their business models. Had they been aware of these risks in advance, they might have conducted their affairs differently to protect themselves from the collateral damage they ultimately faced. Unfortunately, according to a recent survey, fewer than half of senior executives are confident that their organization understands the range of risks it faces, the severity of those risks, the likelihood of their occurrence, or their potential impact.22 As might be expected with the financial crisis, Congress has also been actively engaged in the risk-management debate: Risk committee requirements were proposed in—although ultimately omitted from—the Dodd–Frank Act.23 Risk management is now defined in much broader terms than was formerly the case, and includes CEO succession planning and the structure of executive compensation. (We discuss these issues in Chapters 7, “Labor Market for Executives and CEO Succession Planning,” 8, “Executive Compensation and Incentives,” and 9, “Executive Equity Ownership.”)
Risk and Risk Tolerance
The risk facing an organization represents the likelihood and severity of loss from unexpected or uncontrollable outcomes. This includes both the typical losses that occur during the course of business and losses from extremely unlikely and unpredictable events (so-called black swans, or outliers). Risk arises naturally, both from the nature of the activities that the corporation participates in and from the manner in which it pursues its objectives. Risk cannot be separated from the strategy and operations of the firm but instead is an integral feature of organizational decision making.
Each company must decide how much risk it is willing to assume through its choice of strategy. It is not possible to pursue a risk-free strategy, nor is risk management about removing all risk from the firm. Obviously, if managers were to remove all the risk, they should be able to earn no more than the risk-free interest rate, which is not in the interest of shareholders. Instead, firms succeed when they are better able to manage risk than their competitors.
In making this decision, each company must determine its own tolerance for risk (risk tolerance—see the following sidebar). This decision should involve the active participation of the board of directors. If the board (as representatives of shareholders) is willing to accept greater uncertainty and variability in future cash flows in exchange for potentially higher economic returns, then a risky strategy might be appropriate. If not, then either a safer strategy or an entirely new strategy is appropriate. The company must strike its own balance between aggressiveness and conservativeness. This balance can be achieved only when the riskiness of the corporate strategy and business model is properly understood. The risks that the firm is willing to accept should be properly managed in the context of its strategy. The risks that the firm cannot handle on its own or is not good at managing should be hedged or otherwise transferred to a third party. The management of the company and the board of directors need to understand the nature, cost, and repercussions of adverse or unexpected outcomes and manage those accordingly.
Risk to the Business Model
Boards and executives commonly focus on generic risks facing the firm.26 However, the real risks are extensive and relate to all its activities, including these:
• Operational risk—This reflects how exposed the company is to disruptions in its operations. Operational risk is reflected in such factors as concentration of suppliers, concentration of buyers, redundancy in the supply chain, and the extent to which the company monitors its supply chain.
• Financial risk—This reflects how much the company relies on external financing (including the capital markets and private lenders) to support its ongoing operations. Financial risk is reflected in such factors as balance sheet leverage, off-balance-sheet vehicles, contractual obligations, maturity schedule of debt obligations, liquidity, and other restrictions that reduce financial flexibility. Companies that rely on external parties for financing are at greater risk than those that finance operations using internally generated funds.
• Reputational risk—This reflects how much the company protects the value of its intangible assets, including corporate reputation. Reputational risk is reflected in investing in product brand development, investing in corporate brand development, monitoring the use of brands, monitoring supplier and customer business practices, performing community outreach, and handling stakeholder relations.
• Compliance risk—This reflects how much the company complies with laws and regulations that otherwise would damage the firm. Compliance risk is reflected in such factors as labor practices, environmental compliance, and consideration given to the regulatory requirements that govern the company’s products, processes, or publicly listed securities.
To understand the risks associated with the organizational strategy, the board must probe deeper than generic risk categories. Survey data suggests that companies are aware of the financial, political, regulatory, and economic risks facing their organizations and the risks associated with loss of human capital. However, they exhibit somewhat lower awareness of—and preparedness for—the risks that are inherent to their business models (see the following sidebar).27
The business modeling process discussed earlier provides a rigorous framework for understanding organizational risk. Stress testing the key linkages and assumptions in the business model enable the board and management to better determine what might go wrong with the corporate strategy and the consequences of these problems. A causal business model focuses the risk management discussion by enabling corporate officials to think about how a disruption in one area or function could have cascading effects throughout the organization. The company then can develop policies and procedures to mitigate these risks.
If the company has a well-developed business model, it is possible for the board and management to develop very detailed risk-management analyses of key issues. The company should generally seek to mitigate risk to the extent that it is cost-effective to do so. Risks that the company is not willing to accept should be hedged or otherwise transferred to a third party through insurance or derivative contracts. However, other risks are desirable to retain and might be associated with the firm’s competitive advantages, including labor talent, manufacturing processes, brands, patents, and intellectual property. Obviously, good corporate governance requires that risks retained by the company be properly disclosed to shareholders.
Risk Management
Risk management is the process by which a company evaluates and reduces its risk exposure. This includes actions, policies, and procedures that management implements to reduce the likelihood and severity of adverse outcomes and to increase the likelihood and benefits of positive outcomes. To accomplish this, the organization must define and develop a risk culture. A risk culture sets the tone for risk tolerance in the organization and ensures that risk consideration is a key part of all decisions. Survey data suggests that strong leadership, clear parameters surrounding corporate risk taking, and access to information about potential risks are necessary for this to occur.31
Various professional frameworks can guide a company in the risk-management processes. For example, the Committee of Sponsoring Organizations (COSO) framework, originally developed in 1990, has become a respected framework for risk management.32 COSO recommends that risk management be incorporated into strategy planning, operational review, internal reporting, and compliance. As such, risk should be considered at the enterprise, division, and business unit levels. COSO outlines its recommendations in an eight-step framework:
1. Internal environment—Establish the organization’s philosophy toward risk management and risk culture.
2. Objective setting—Evaluate the company’s strategy and set organizational goals based on the risk tolerance of management and the board.
3. Event identification—Examine the risks associated with each potential business opportunity.
4. Risk assessment—Determine the likelihood and severity of each risk.
5. Risk response—Identify the organizational actions taken to prevent or deal with each risk.
6. Control activities—Establish policies and procedures to ensure that risk responses are carried out as planned.
7. Information and communication—Create an information system to capture and report on the organization’s risk-management process.
8. Monitoring—Review data from the information system and take actions, as appropriate.
Note that the first steps of this framework are consistent with the argument we have made so far that risk should be discussed in terms of its strategic and operating components. Also note that the information-collection and monitoring steps are consistent with the manner in which we have described performance measurement using KPIs. That is, the risk-management process should be integrated with the processes the company uses for development and oversight of the strategy, business model, and performance measurement (see the following sidebar).
To date, little research rigorously examines the relation between risk management and future firm performance.34 However, survey data suggests that shareholders place great value on comprehensive risk management. According to a survey by Ernst & Young, more than 80 percent of institutional investors responded that they were willing to pay a premium for companies with good risk-management practices. A majority of respondents claimed that they had passed up the opportunity to invest in a company because they believed risk management was insufficient.35 Similarly, a survey by PricewaterhouseCoopers found that institutional investors believe that risk management should be the number-one priority of the board of directors, ahead of strategic planning. Investors also believe that risk management expertise is the most important skill that directors should have, ahead of financial, industry, and operational expertise.36
Oversight of Risk Management
Although management is ultimately responsible for implementing and enforcing risk management, the board must ensure that these activities are carried out effectively. How is the board expected to satisfy this responsibility? What does it mean to “oversee” risk management?
The risk oversight responsibilities of the board can be roughly divided into four categories. First, the board is responsible for determining the risk profile of the company. As we have discussed, this includes considering macroeconomic, industry-related, and firm-specific risk. The board should determine the risk profile of the company in consultation with management, shareholders, and other key stakeholders. In heavily regulated industries—such as financial services, insurance, and utilities—discussions should include regulators. The board should weigh downside costs against long-term market opportunities and consider the likelihood of both success and failure.
Second, the board is responsible for evaluating the company’s strategy and business model to determine whether they are appropriate, given the firm’s appetite for risk. The board should be satisfied that the company has identified risks to the strategy and business model and is effectively managing them. The board should confirm that viable contingency plans have been drawn up to deal with potential financial or operational interruptions. In addition, the board should consider whether appropriate hedges and insurance are in place to deal with risks that are not well managed by the firm.
Third, the board is responsible for ensuring that the company is committed to operating at an appropriate risk level on an ongoing basis. Does the company’s culture encourage or discourage risky behavior? Are the company’s operations assuming more risk than intended by the strategy and business model? Developing internal reporting systems that capture risk data can help answer these questions. Risk metrics should be included among the key performance indicators that the board uses to monitor firm performance. The board should be facile in interpreting this data and attentive to emerging trends (see the following sidebar).
Finally, the board should determine whether management has developed the necessary internal controls to ensure that risk-management procedures remain effective. A lot of this activity is mundane, including ensuring that reporting relationships are well defined, communication channels work, and reporting data is tested for accuracy. Nevertheless, these are important steps for ensuring that risk management practices are effective. Tying executive compensation not only to strategic performance measures but also to the company’s risk measures will help ensure that this work is performed appropriately. (This is discussed more fully in Chapters 8 and 9.)
Assessing Board Performance on Risk Management
Little rigorous research assesses the general effectiveness of risk-management programs and the performance consequences of these programs. However, survey data indicates that companies can stand to improve in this area.
A 2014 study by the American Institute of Certified Public Accountants and Chartered Institute of Management Accountants showed that risk-management processes are seriously underdeveloped at many companies. Approximately two-thirds (63 percent) of companies admit that they were caught off guard by a surprise in the previous five years. Almost half have no enterprise risk management processes in place, and only 20 percent describe their organization’s level of risk management as “mature” or “robust.” Just under half (45 percent) either have no structure in place for identifying and reporting risk to the board, or they track risks by silos, with minimal reporting of aggregate risk exposure to the board. A significant minority (38 percent) do no formal risk assessment when developing strategy, and half fail to consider existing risk exposures.41
In particular, the evidence suggests that boards are not effective in understanding or monitoring technological risks to the organization. For example, while 90 percent of companies claim to understand the negative impact that social media can have on their corporate reputation and perceptions of product quality, only 32 percent monitor social media to detect risk.42 Similarly, CEOs consider the potential loss of customer or proprietary data through a breach of technology systems (“cyber-attacks”) to be the largest technological threat facing their organizations, and yet only 20 percent have real-time systems in place to detect threats.43 These data highlight a very real problem. The board of directors should ensure that its members have adequate risk expertise and that the company has rigorous procedures in place to measure and monitor organizational risks (see the following sidebar).
Endnotes
1. Financial Reporting Council, “The UK Corporate Governance Code (2012). Accessed March 16, 2015. See www.frc.org.uk.
2. National Association of Corporate Directors, “2013–2014 NACD Public Company Governance Survey” (Washington, D.C., 2014).
3. Lockheed Martin, “Ethics” (2015). Accessed February 10, 2015. See http://www.lockheedmartin.com/us/who-we-are/ethics.html.
4. Adapted from Gerry Johnson, Kevan Scholes, and Richard Whittington, Exploring Corporate Strategy: Text & Cases, 8th ed. (Essex: Pearson Education Limited, 2008).
5. Garth Saloner, Andrea Shepard, and Joel Podolny, Strategic Management, rev. ed. (New York: John Wiley & Sons, 2005). And Michael E. Porter, Competitive Strategy (New York: Free Press, 1998).
6. Forbes Insights, “The Powerful Convergence of Strategy, Leadership, and Communications: Getting It Right,” FD Corporate Communications (June 2009). Accessed November 8, 2010. See http://images.forbes.com/forbesinsights/StudyPDFs/PowerfulConvergenceofStrategy.pdf.
7. Eric Olsen, Frank Plaschke, and Daniel Stelter, “The 2008 Value Creators’ Report: Missing Link Focusing Corporate Strategy on Value Creation,” Boston Consulting Group (2008). Accessed December 8, 2008. See www.bcg.com/documents/file15314.pdf.
8. This is similar to the insightful work done by James L. Heskett, W. Earl Sasser, and Leonard A. Schlesinger, The Service Profit Chain (New York: Free Press, 1997).
9. David de Angelis and Yaniv Grinstein “Pay for the Right Performance,” Johnson School Research Paper Series No. 03-2011, Social Science Research Network (2012). Accessed February 10, 2015. See http://ssrn.com/abstract=1571182.
10. See Christopher D. Ittner, David F. Larcker, and Madhav V. Rajan, “The Choice of Performance Measures in Annual Bonus Contracts,” Accounting Review 72 (1997): 231–255. Daniel Sungyeon Kim and Jun Yang, “Behind the Scenes: Performance Target Setting of Annual Incentive Plans,” Social Science Research Network (2012). Accessed June 24, 2014. See http://ssrn.com/abstract=1361814.
11. Francesca Cornelli, Zbigniew Kominek, and Alexander Ljungqvist, “Monitoring Managers: Does It Matter?” Journal of Finance 68 (2013): 431–481.
12. Adapted in part from Christopher D. Ittner and David F. Larcker, “Extending the Boundaries: Nonfinancial Performance Measures,” in Handbook of Management Accounting Research, edited by Christopher S. Chapman, Anthony G. Hopwood, and Michael D. Shields (Oxford: Elsevier, 2009).
13. Christopher D. Ittner and David F. Larcker, “Coming Up Short on Nonfinancial Performance Measurement,” Harvard Business Review 81 (2003): 88–95. Also see Ittner and Larcker (2005).
14. Stephen Gates, “Aligning Strategic Performance Measures and Results,” The Conference Board, research report 1261-99-RR (October 1999). Accessed March 15, 2010. See http://www.conference-board.org/publications/publicationdetail.cfm?publicationid=438.
15. The function linking customer satisfaction to financial performance is “S-shaped” and not a simple linear relation. There are likely to be diminishing returns to increases in customer satisfaction and other similar measures. See Christopher D. Ittner and David F. Larcker, “Are Nonfinancial Measures Leading Indicators of Financial Performance? An Analysis of Customer Satisfaction,” Journal of Accounting Research 36 (1998): 1–35.
16. Rajiv D. Banker, Gordon Potter, and Roger G. Schroeder, “Reporting Manufacturing Performance Measures to Workers: An Empirical Study,” Journal of Management Accounting Research 5 (1993): 33–55.
17. Venky Nagar and Madhav V. Rajan, “The Revenue Implications of Financial and Operational Measures of Product Quality,” Accounting Review 76 (2001): 495–514.
18. Ittner, Larcker, and Rajan (1997).
19. Amal A. Said, Hassan R. HassabElnaby, and Benson Wier, “An Empirical Investigation of the Performance Consequences of Nonfinancial Measures,” Journal of Management Accounting Research 15 (2003): 193–223.
20. Deloitte Touche Tohmatsu, “In the Dark: What Boards and Executives Don’t Know about the Health of Their Businesses. A Survey by Deloitte in Cooperation with the Economist Intelligence Unit” (2004). Last accessed June 24, 2014. See http://www.deloitte.com/assets/Dcom-NewZealand/Local%20Assets/Documents/In%20the%20dark%284%29.pdf. Deloitte Touche Tohmatsu, “In the Dark II: What Many Boards and Executives Still Don’t Know About the Health of Their Businesses. Executive Survey Results from Deloitte and the Economist Intelligence Unit” (2007). Accessed September 7, 2010. See http://www2.deloitte.com/content/dam/Deloitte/in/Documents/risk/Board%20of%20Directors/in-gc-in-the-dark-noexp.pdf.
21. Christopher D. Ittner, David F. Larcker, and Taylor Randall, “Performance Implications of Strategic Performance Measurement in Financial Services Firms,” Accounting, Organizations & Society 28 (2003): 715.
22. Anonymous, “Beyond Box-ticking: A New Era for Risk Governance; A Report from the Economist Intelligence Unit Sponsored by ACE and KPMG,” The Economist (2009). Accessed November 8, 2010. See https://www.kpmg.com/LU/en/IssuesAndInsights/Articlespublications/Documents/Beyondbox-ticking-final.pdf.
23. Ormazabal (2010) found a positive stock market response to these legislative events for companies that had not disclosed risk-management activities. See Gaizka Ormazabal, “An Examination of Organizational Risk Oversight,” Ph.D. dissertation, Stanford University, Graduate School of Business (2010).
24. Gennaro Bernile, Vineet Bhagwat, and P. Raghavendra Rau, “What Doesn’t Kill You Will Only Make You More Risk-Loving: Early-Life Disasters and CEO Behavior,” Social Science Research Network (2014). Accessed March 18, 2015. See http://ssrn.com/abstract=2423044.
25. Robert Davidson, Aiyesha Dey, and Abbie Smith, “Executives’ ‘Off-the-Job’ Behavior, Corporate Culture, and Financial Reporting Risk,” Journal of Financial Economics (August 1, 2013). Accessed May 5, 2015. See http://dx.doi.org/10.1016/j.jfineco.2013.07.004.
26. Public companies give a laundry list of “risk factors” in the annual 10-K. It is unclear whether these are the real risks the company faces or disclosures that provide the basis of a legal defense in case something bad happens to the firm. The challenge for the board is to push management to precisely articulate the fundamental risks that can have a devastating impact on shareholders and stakeholders.
27. The Economist (2009).
28. Lululemon Athletica, “Black Luon Pants Shortage Expected,” press release (March 18, 2013). Accessed June 3, 2013. See http://investor.lululemon.com/releasedetail.cfm?ReleaseID=749315. For more on this topic, see David F. Larcker, Sarah M. Larcker, and Brian Tayan, “Lululemon: A Sheer Debacle in Risk Management,” Stanford Closer Look Series (June 17, 2014). Accessed May 3, 2015. See http://www.gsb.stanford.edu/faculty-research/centers-initiatives/cgri/research/closer-look.
29. Lululemon Athletica, “Black Luon Pants—FAQ,” (March 2013; updated, November 5, 2013). Accessed November 5, 2013. See http://files.shareholder.com/downloads/LULU/0x0x646646/544213e5-7e6d-4f87-8707-cf05d665c8eb/Black_luon_Pant_Shortage_UPDATED_Nov5_FAQ_only.pdf.
30. Bloomberg Television, “Lululemon Pants Don’t Work for Some Women: Founder” (November 5, 2013). Accessed November 5, 2013. See http://www.bloomberg.com/news/videos/b/0132a382-cee3-41db-88af-fa2ed73f1762.
31. The Economist (2009).
32. Committee of Sponsoring Organizations of the Treadway Commission, “About Us.” Accessed May 3, 2015. See www.coso.org/aboutus.htm.
33. Jim Traut, “Enterprise Reputation and Risk Management at H. J. Heinz,” Enterprise Risk Management Initiative (October 3, 2008). Accessed June 24, 2014. See http://erm.ncsu.edu/library/article/jim-traut-roundtable#.U6nuufk7tcY.
34. Ormazabal (2010) found some evidence that volatility decreases when firms include risk management. His risk-management index is computed using publicly available data on the existence of a risk-management board committee, whether this committee has any members that have risk-management expertise, and other similar variables. See Ormazabal (2010).
35. Ernst & Young, “Investors on Risk: The Need for Transparency,” Ernst & Young Risk Survey Series (2006). Accessed April 3, 2015. See https://www2.eycom.ch/publications/items/brs/investors_on_risk/en.pdf.
36. PricewaterhouseCoopers LLP, “Through the Investor Lens: Perspectives on Risk & Governance,” PwC’s Investor Survey (2013). Accessed March 29, 2014. See http://www.pwc.com/en_US/us/pwc-investor-resource-institute/publications/assets/pwc-investor-survey.pdf.
37. National Association of Corporate Directors (2014).
38. New York Stock Exchange (NYSE) regulations require that the audit committee discuss risk-management policies and practices. However, the NYSE allows companies to assign primary responsibility for risk management to another committee, as long as the audit committee plays a continuing role in the process.
39. Financial companies, in particular, are likely to have a risk committee because financial risk is almost the same as operational risk for these companies. Even energy companies such as Duke Energy are exposed to commodity price risk, which is both financial and operational.
40. Christopher D. Ittner and Thomas Keusch, “The Determinants and Implications of Board of Directors’ Risk Oversight Practices,” Social Science Research Network (2014). Accessed April 3, 2014. See http://ssrn.com/abstract=2482791.
41. American Institute of Certified Public Accountants (AICPA), “Report on the Current State of Enterprise Risk Oversight: Opportunities to Strengthen Integration with Strategy,” 5th edition (2014). Research conducted by the ERM Initiative at North Carolina State University on behalf of the American Institute of CPAs Business, Industry & Government Team. Accessed March 18, 2015. See http://www.aicpa.org/interestareas/businessindustryandgovernment/resources/erm/downloadabledocuments/aicpa-erm-research-study-2014.pdf.
42. David F. Larcker, Sarah M. Larcker, and Brian Tayan, “What Do Corporate Directors and Senior Managers Know about Social Media?” The Conference Board, research report No. DN-V4N20 (October 2012). Accessed May 3, 2015. See http://www.gsb.stanford.edu/sites/gsb/files/publication-pdf/cgri-survey-2012-senior-management-social-media_0.pdf.
43. PricewaterhouseCoopers LLP, “A Marketplace without Boundaries? Responding to Disruption: PWC 18th Annual Global CEO Survey (2015).” Accessed March 17, 2015. See https://www.pwc.com/gx/en/ceo-survey/2015/assets/pwc-18th-annual-global-ceo-survey-jan-2015.pdf; Ernst & Young, “Get Ahead of Cybercrime: EY’s Global Information Security Survey (2014).” Accessed March 18, 2015. See http://www.ey.com/Publication/vwLUAssets/EY-global-information-security-survey-2014/$FILE/EY-global-information-security-survey-2014.pdf.
44. Grant Kirkpatrick, “The Corporate Governance Lessons from the Financial Crisis,” OECD Journal: Financial Market Trends (2009): 1–30. Accessed May 3, 2015. See http://dx.doi.org/10.1787/fmt-v2009-art3-en.
45. Andrew Ross Sorkin, Too Big to Fail: The Inside Story of How Wall Street and Washington Fought to Save the Financial System—and Themselves (New York: Penguin, 2009).
46. Andrew Ellul and Vijay Yerramilli, “Stronger Risk Controls, Lower Risk: Evidence from U.S. Bank Holding Companies,” Journal of Finance 68, no. 5 (October 2013): 1757–1803.
47. Ormazabal (2010).