
9. Executive Equity Ownership
In this chapter, we examine the relationship between equity ownership and executive behavior. In theory, executives who hold equity in the companies they manage—either directly in the form of stock ownership or indirectly through options, restricted stock, and performance shares—have greater incentive to improve the economic value of the firm. In addition, equity holdings dissuade self-interested behavior, in that any action the executive takes that impairs firm value will inflict corresponding damage to the executive’s personal wealth (although not on a “dollar-for-dollar” basis, given that executives are also compensated in forms other than equity). As a result, equity ownership is an important tool that companies use to mitigate agency problems.
At the same time, concern exists that equity ownership might foster undesirable behaviors. Examples include “excessive” risk-taking and the manipulation of earnings, information, or timing of trades to boost the value of the executive’s personal equity investment at the expense of shareholders. In this chapter, we examine the potentially positive and negative effects of executive equity ownership.
Equity Ownership and Firm Performance
Executives who have been in their position for a number of years tend to accumulate a substantial investment in their companies by retaining vested equity awards or buying shares.
Based on a sample of the 4,000 largest publicly traded U.S. companies, the median CEO holds an equity position in his or her company with a value of $14.9 million (see Table 9.1). Equity ownership levels vary with company size. Among the largest 100 companies, the median CEO holds equity wealth valued at $104.9 million. Among the smallest 1,000 companies in this sample, median wealth is $3.5 million.
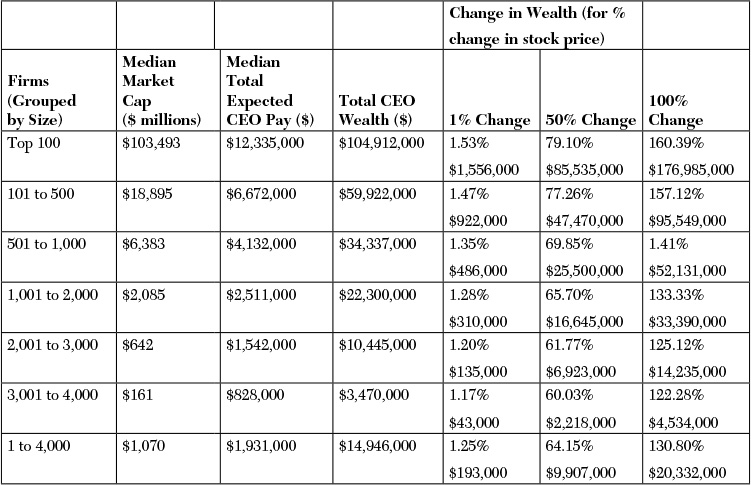
Due to missing observations, the samples in Table 8.2 and Table 9.1 differ slightly. Calculations exclude personal wealth outside company stock. Total CEO compensation and total CEO wealth are rounded to the nearest thousand dollars. Total CEO compensation is the sum of salary, annual bonus, expected value of stock options granted, expected value of restricted stock granted, target value of performance plan grants, and other annual compensation. Calculations for compensation exclude changes in pension. Stock options are valued using the Black–Scholes pricing model, with the remaining option term reduced by 30% to compensate for potential early exercise or termination and volatility based on actual results from the previous year.
Source: Equilar, proprietary compensation and equity ownership data for fiscal years from June 2013 to May 2014.
Table 9.1 CEO Equity Wealth and Sensitivity to Change in Stock Price (Median Values)
As Table 9.1 also shows, the average value of CEO equity wealth is significantly larger than the average value of annual compensation. This means that for a typical executive, the incentives provided by the equity holdings are at least as important and often dominate the incentives provided by annual compensation. As a result, a typical executive considers how decisions potentially affect total wealth and not just one year’s pay.1
One way to measure the incentive value of wealth is by calculating its sensitivity to changes in stock price. For example, the median CEO in Table 9.1 stands to gain roughly $193,000 in wealth if the stock price increases 1 percent, $9.9 million if the stock price increases 50 percent, and $20.3 million if the stock price doubles. These dollar amounts give considerable incentive to perform.
Research generally supports the notion that equity ownership is positively associated with firm performance. Morck, Shleifer, and Vishny (1988) found that equity ownership by the CEO is positively correlated with firm value, measured by market-to-book value ratios. However, the positive correlation only holds in their study at low (less than 5 percent) and high (greater than 25 percent) ownership levels.2
McConnell and Servaes (1990) found a positive relationship between equity ownership and firm value across a larger array of ownership levels, up to between 40 and 50 percent.3
Elsilä, Kallunki, and Nilsson (2013) measured equity incentives in terms of the personal wealth the executive has in the company (as a percentage of total wealth) rather than in terms of the percentage of the company the executive owns. Using this approach, they found that the ratio of CEO ownership to personal wealth is positively correlated with both firm performance and firm value.4
Finally, Lilienfeld-Toal and Ruenzi (2014) found that firms with high CEO ownership levels deliver higher stock market returns than firms with low managerial ownership. They concluded that “owner-CEOs are value increasing [in that] they reduce empire building and run their firms more efficiently.”5
These studies suggest that managerial incentives are higher and might be more closely aligned with the interests of shareholders when executives have “skin in the game.” To encourage these effects, many companies adopt equity ownership guidelines for the senior management team (see the following sidebar).
Equity Ownership and Risk
Equity ownership not only provides incentive for performance but also encourages risk taking. As we discussed in greater detail in Chapter 6, “Strategy, Performance Measurement, and Risk Management,” some degree of risk taking is required for a company to generate returns in excess of its cost of capital. It is the responsibility of the board of directors to determine a company’s risk tolerance and establish a compensation program consistent with this view of risk.
The composition of an executive’s equity portfolio plays a considerable role in determining his or her appetite for risk. An executive whose wealth consists entirely of direct stock investments—either restricted shares or shares that have vested but not been sold—stands to gain or lose wealth dollar-for-dollar with changes in the stock price. Many boards like this arrangement because it is seen as putting the executive on equal footing with the average investor. However, one important distinction remains: while the average investor holds shares as part of a diversified portfolio, the typical executive has a large, concentrated exposure to a single stock and therefore is exposed to greater personal financial risk. As a result, executives have a tendency to become risk averse, and over time, this can reduce performance. Researchers have shown that some executives decline to pursue new projects that would otherwise be valuable to well-diversified shareholders (that is, projects with positive net present value) because they have more at stake in the event of a loss than those shareholders.9
Stock options can be used to counteract risk aversion. The intrinsic value of stock options is a nonlinear function of share price. The value moves dollar-for-dollar with stock price when the option is “in the money” (when the stock price is above the exercise price), but the value is unaffected by stock price when the option is “out of the money” (when the stock price is below the exercise price). This introduces “convexity” into the executive’s potential payoff and encourages risk taking (see the following sidebar). As such, stock options are used to encourage managers to become less risk averse by investing in higher-risk, higher-return projects.
Sensitivity of CEO Wealth to Stock Price
• Food companies—The CEO of General Mills had convexity in his compensation of 2.98, and the CEO of Kraft had convexity of 1.18. However, the CEO of General Mills was newly appointed to the position. Although it can be appropriate to use options to help a CEO build wealth in the company at a faster rate, will a more aggressive compensation structure simultaneously, and perhaps undesirably, impact company strategy and risk (see Figure 9.1)?

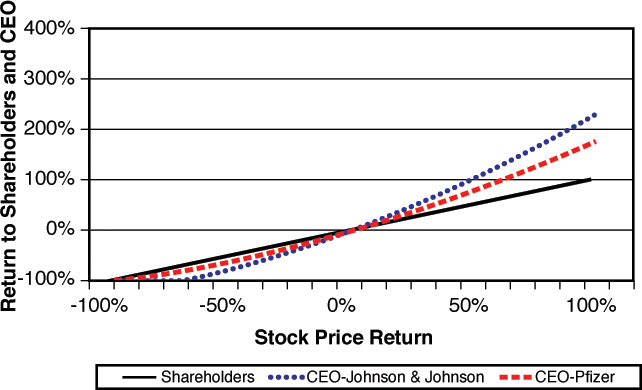
• Pharmaceutical companies—The CEOs of Johnson & Johnson and Abbott Laboratories had higher convexity in their compensation (2.26 and 2.13, respectively) than the CEOs of Pfizer and Merck (1.78 and 1.67). Does a diversified healthcare model require more risk taking than a pure-play pharmaceutical model (see Figure 9.2)?
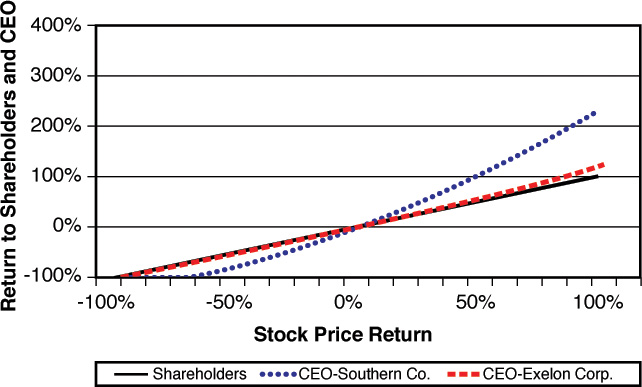
• Regulated utilities—As shown in Figure 9.3, if the stock price of Southern Company increased by 100 percent, the CEO of the company’s Georgia Power division would realize a 235 percent increase in “wealth” (a ratio of 2.35). By comparison, the ratio at Exelon’s ComEd division was 1.23. Compensation at Southern Company therefore seemed to encourage more risk taking. Under what circumstances is it appropriate for a public utility to engage in risky activities?
Research generally shows that executives facing “convex” payoff curves engage in more risk taking. Coles, Daniel, and Naveen (2006) found that executives with large stock option exposure spend more money on research and development, reduce firm diversification, and increase firm leverage—all actions that increase the risk profile of the firm.10 In the same vein, Gormley, Matsa, and Milbourn (2013) found that a reduction in stock option exposure is associated with a reduction in risk. Managers with less convex payoffs decrease leverage, reduce research and development, hold larger cash balances, and engage in more diversifying acquisitions.11 Armstrong and Vashishtha (2012) demonstrated that stock options give CEOs incentive to increase systemic risk (which can be hedged through financial instruments) but not idiosyncratic (firm-specific) risk.12 Kim, Li, and Zhang (2011) found that companies whose chief financial officers have considerable stock option exposure in their equity holdings have a greater risk of a stock price crash (defined as a one-week stock return 3.2 standard deviations below the mean).13
The issue of whether stock options might be related to “excessive” risk taking is an important consideration for boards and shareholders when deciding on executive compensation packages. Congress and the media coined the term excessive risk taking following the financial crisis of 2008. Unfortunately, no standard litmus test exists to distinguish an excessive risk from an acceptable risk. An excessive risk might be one whose downside is so large that the firm cannot financially bear it (see the following sidebar).
Executive Compensation and the Financial Crisis of 2008
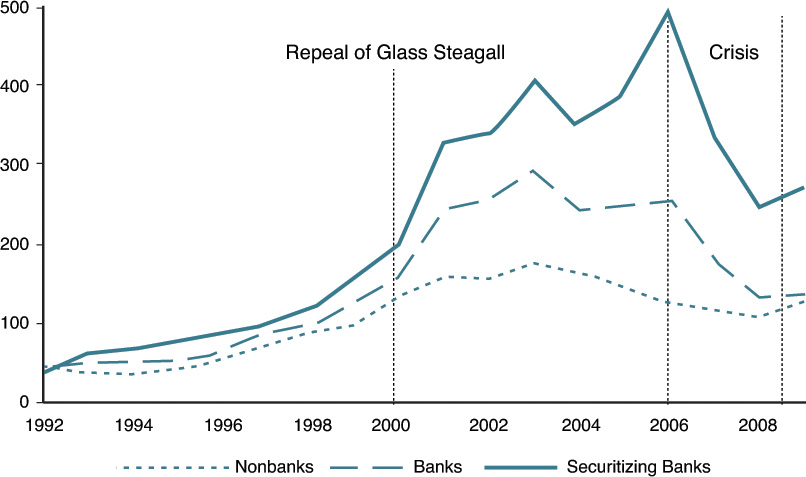
Note: Plot of average portfolio vega by year for all CEOs on ExecuComp with non-missing data. Portfolio vega (in thousands) is calculated as the sensitivity of the CEO’s equity portfolio to a 0.01 change in stock volatility and is expressed in units of $1,000. The term “Banks” refers to bank holding companies (132 unique banks), “Securitizing Banks” refers to “Banks” with at least six quarters of nonzero securitized assets (58 unique banks), and “Nonbanks” refers to all other firms (3,232 unique firms). Section 20 of the Glass–Steagall Act was repealed by the Gramm-Leach-Bliley Financial Modernization Act in November 1999; effective March 2000, bank holding companies were allowed to expand the issuance of asset-backed securities.
Source: Larcker, Ormazabal, Tayan, and Taylor (2014).
Figure 9.4 Risk-taking incentives prior to the financial crisis.
To temper “excessive” risk-seeking behavior, the compensation committee might alter the mix of stock and options granted to the CEO with the intention of reducing the CEO’s personal financial exposure to stock price volatility. However, the board should be mindful that such an approach will also substantially reduce performance incentives. The SEC now requires that companies discuss the relationship between compensation plans and organizational risk in the Compensation Discussion & Analysis section of the annual proxy (see the following sidebar).
Equity Ownership and Agency Costs
Equity ownership is intended to provide incentives that motivate managers to improve corporate performance, but it also has the potential to encourage undesirable behaviors. This occurs when an executive seeks to increase the value of equity holdings in ways other than through improvements in operating, financing, and investment decisions. Examples include these:
• Manipulating accounting results to inflate stock price or achieve bonus targets
• Manipulating the timing of option grants to increase their intrinsic value
• Manipulating the release of information to the public to correspond with more favorable grant dates
• Using inside information to gain an advantage in selling or otherwise hedging equity holdings
When these actions occur, they represent the very agency costs that equity ownership is intended to discourage.
Accounting Manipulation
As discussed more completely in the Chapter 10, “Financial Reporting and External Audit,” plenty of evidence shows that accounting manipulations occur. Consider these prominent examples:
• Enron, which front-loaded revenues and hid liabilities through off-balance-sheet vehicles
• WorldCom, which capitalized expenses on the balance sheet that should have been treated as operating costs
• Royal Dutch Shell, which inflated the size and value of proved oil reserves
An important question for boards and shareholders is whether such manipulations are more likely to occur in companies where executives own a large portion of company stock than in companies where executives own little or no stock. That is, do executives with considerable equity ownership inflate earnings to manipulate the market and produce a higher stock price?
The research evidence on this topic is mixed. For example, Harris and Bromiley (2007) found that financial restatements are more likely to occur at companies where executives are paid a large portion of compensation in the form of options.24 However, Baber, Kang, Liang, and Zhu (2013) found no such evidence.25 Johnson, Ryan, and Tian (2009) found that unrestricted equity holdings by executives are associated with a greater incidence of accounting fraud.26 Erickson, Hanlon, and Maydew (2006) did not find this association.27Armstrong, Jagolinzer, and Larcker (2010) also found no evidence that equity incentives are associated with accounting restatements, SEC enforcement actions, or shareholder litigation.28
The mixed results are due in part to study design. As noted earlier in this chapter, an executive holding a large equity portfolio has conflicting incentives. Equity holdings encourage an executive to increase value, but they also discourage risk taking. These incentives work at cross-purposes. However, a sudden change in the composition of wealth, such as through a large stock option grant, unambiguously encourages performance and risk. To this end, Armstrong, Larcker, Ormazabal, and Taylor (2013) found strong evidence that an increase in the sensitivity of CEO wealth to stock price volatility is positively associated with financial misreporting. According to the authors, “The results suggest that equity portfolios provide managers with incentives to misreport not because they tie the manager’s wealth to equity value but because they tie the manager’s wealth to equity risk.”29
As a result, shareholders and stakeholders should be cognizant of the potential for self-gain that comes through accounting manipulation (“cooking the books”). The potential for this problem seems to be most pronounced when executives have highly convex compensation plans.
Manipulation of Equity Grants
Equity ownership might also encourage executives to manipulate equity grants in order to extract incremental value. This might occur in at least two ways:
• Manipulating the timing of the grant—The grant date either is delayed so that it occurs after a stock price decline has already taken place or is brought forward to precede an expected increase in stock price.
• Manipulating the timing of information released to the public—The release of favorable information about the company (a new product, a new strategic relationship, stronger-than-expected sales) is delayed so that it occurs after a scheduled grant date; the executive benefits from an immediate increase in value when the favorable information is released. Likewise, unfavorable information is released early, to precede a grant date; the executive benefits by receiving the grant after the unfavorable news has already driven the stock price lower.
In both cases, the executive seeks to maximize the value received from an equity grant by taking actions that are not in the interests of shareholders.
When equity awards are granted on a purely random basis, no discernable pattern emerges in the stock price movement around the grant date. Stock price movements appear random, and the relative favorability of the timing of the grant tends to be unpredictable. Many grants fit this pattern. However, at some companies, stock price movements follow a discernable pattern around the grant date. The grant either coincides with a relative low or immediately precedes a sudden increase in price, resulting in a V-shaped pattern.
Considerable research shows that such patterns occur for a large sample of firms. Yermack (1997) demonstrated a V-shaped pattern around stock option grant dates. Stock prices in that sample mirrored the market before option grant dates, but then exhibited above-market returns in the 50 days following the grant dates. Yermack concluded that some sort of manipulation took place, through either the release of information or the timing of grants, but he was unable to conclusively determine which.30
To test the hypothesis that executives might manipulate the release of information, Aboody and Kasznik (2000) examined stock price behavior around scheduled option grants. Scheduled option grants include those for which the option grants follow a predetermined schedule (for example, they might be regularly awarded the day after a board meeting). Their findings are similar to those of Yermack (1997). The authors concluded that executives might opportunistically time the release of company information to the market around grant dates.31
Lie (2005) tested a hypothesis that executives manipulate the timing of awards in their favor. He divided the sample into companies whose grants were clearly unscheduled (with the grant date made at the discretion of the board) and those whose grants were scheduled. Lie found that the V-shape pattern around unscheduled grants was more pronounced (see Figure 9.5). He posited that insiders were retroactively changing the grant date of unscheduled awards to lower the exercise price and increase profits to executives. This practice is now known as stock option backdating (see the following sidebar).32

Source: Erik Lie (2005). Reproduced with permission of the Institute for Operations Research and Management Sciences in the format Tradebook via Copyright Clearance Center.
Figure 9.5 Stock price movements around scheduled and unscheduled grant dates.
Other Examples of Value Extraction through Timing
Other practices that represent attempts to extract additional value from equity grants include these:
• Spring-loading—Awarding options immediately before the release of unexpected positive news that is likely to drive up the price of a stock
• Bullet-dodging—Waiting to award options until after the release of unexpected negative news that is likely to drive down the price of a stock
• Exercise backdating—Retroactively changing the exercise date of stock options to a date when the market price was lower in order to reduce the reported taxable gain that the option holder would have to pay at an ordinary income tax level37
In some instances, these actions result in only marginal increases in value for executives.38 In others, the dollar amounts can be significant. Regardless, they run counter to the concept of stewardship and demonstrate that some executives will take advantage of weaknesses in oversight for personal gain.39
Equity Sales and Insider Trading
Executives can diversify their equity holdings by making open-market sales of company stock or by exercising stock options and selling the acquired shares. However, because executives have access to nonpublic information that could be material to valuing the company’s stock, there is always a possibility that executives will use this information to gain an improper trading advantage over public shareholders.
The SEC has established rules that dictate when and how sales by executives may occur. The SEC uses the term insider to identify individuals—corporate officers, directors, employees, and certain professional advisors—who have access to material financial and operational information about a company that has not yet been made public. Insiders are restricted in their ability to engage in transactions involving company securities (both purchases and sales) and may trade only when they are not in possession of material nonpublic information. Trades made on the basis of such information are considered illegal insider trading and, under various acts passed by Congress, are punishable with jail time and financial penalties (up to three times the profit gained or loss avoided from such activity).40
Insider trading lawsuits are prosecuted, in part, under SEC Rule 10b-5, “Employment of Manipulative and Deceptive Devices.”41 Prosecutors argue that the insider has committed fraud on the market by making false statements regarding the prospects of the company or by failing to make appropriate disclosures, thereby maintaining an artificially high share price at the time of sale. For example, in 2007, the SEC charged Joseph Nacchio, former chairman and chief executive officer of Qwest, with insider trading. He was accused of selling more than $100 million of Qwest shares in early 2001 while in possession of material inside information that the company would not meet aggressive financial targets. Qwest shares, which Nacchio sold at approximately $35 per share, subsequently fell below $10. He was sentenced to six years in prison and ordered to pay $19 million in fines and $44.6 million in forfeitures.42
To restrict executives from violating insider trading laws, companies typically designate a period of time known as a blackout period, in which insiders are restricted from making trades in the company stock. Blackout periods typically occur between the time when material information is known and the time when it is released to the public. Blackout periods are specified in the company’s insider trading policy.43 A typical blackout window has a median length of 50 calendar days.44 Trades within the blackout period are prohibited, and trades outside the blackout period (during the trading window) commonly require approval in advance by the general counsel’s office. Jagolinzer, Larcker, and Taylor (2011) found that requiring general counsel approval prior to trading reduces the likelihood that executives gain a trading advantage over public shareholders (see the following sidebar).45
Despite these restrictions, extensive evidence indicates that executives rely on nonpublic information to guide their trading. Lakonishok and Lee (2001) found that open-market purchases of company stock by insiders are predictive of future price increases. The effects are particularly pronounced among small-capitalization companies.47 Seyhun (1986) found both that insider stock purchases tend to precede a period of market outperformance and that sales tend to precede a period of underperformance. Insiders with access to more valuable information about the firm (such as the chairman or the CEO) are found to have a greater trading advantage than other insiders.48 These and other studies suggest that insiders can earn substantial returns over a period of up to three years.49
Rule 10b5-1
The SEC adopted Rule 10b5-1 in 2000 to protect insiders whose position regularly exposes them to important nonpublic information. According to the agency:
As a practical matter, in most situations it is highly doubtful that a person who knows inside information relevant to the value of a security can completely disregard that knowledge when making the decision to purchase or sell that security. In the words of the Second Circuit, “material information cannot lay idle in the human brain.” Indeed, even if the trader could put forth purported reasons for trading other than awareness of the inside information, other traders in the market place would clearly perceive him or her to possess an unfair advantage. On the other hand, we recognize that an absolute standard based on knowing possession, or awareness, could be overbroad in some respects. Sometimes a person may reach a decision to make a particular trade without any awareness of material nonpublic information, but then come into possession of such information before the trade actually takes place.50
To protect executives in such a situation, the SEC adopted Rule 10b5-1 (“Trading ‘on the Basis of’ Material Nonpublic Information in Insider Trading Cases”), which outlines a set of procedures that, if followed, provide an “affirmative defense” against alleged violations of insider trading laws.51
Under Rule 10b5-1, insiders are allowed to enter into a binding contract that instructs a third-party broker to execute purchase or sales transactions on behalf of the insider (10b5-1 plans). The contract can be agreed to only during a period in which the insider does not have knowledge of material nonpublic information (that is, outside the blackout window). The insider is required to specify a program or an algorithm that dictates the conditions under which sales are to be made; such factors might include the number of shares, the interval between transactions, or a share price limit. After the third-party broker receives his or her instructions, the insider is not allowed to exercise any influence over the execution of the plan. From that point forward, the third-party broker has sole discretion, although the executive may amend or terminate the plan at any time (see the following sidebar).52
Approximately 80 percent of companies permit executives to trade using 10b5-1 plans.53 Approval by the general counsel is generally required in advance: Seventy-three percent of companies require such approval to set up a plan, and 59 percent require approval to modify or cancel a plan.54 Insiders are not required to disclose to the public that they have entered into a 10b5-1 plan (although they are required to disclose each trade on a Form 4).
Research indicates that Rule 10b5-1 might not be achieving the outcome that the SEC envisioned. Jagolinzer (2009) found that insiders who execute sales through 10b5-1 plans outperform the market by an average of 6 percent over the six months following each trade. Moreover, the returns earned by executives using 10b5-1 plans are substantially higher than trades made without such plans. Finally, he found that sales transactions by plan participants systematically precede periods of underperformance by the company’s share price and that early terminations of 10b5-1 sales plans systematically precede periods of outperformance.57
To minimize insider abuse of 10b5-1 plans, experts recommend that companies adopt strict and transparent procedures to govern their use.
Hedging
An executive might decide to hedge the value of his or her equity holdings rather than engage in an outright sale of shares or options. A decision to hedge is often the result of discussion with a personal investment advisor and could be motivated by diversification, tax planning, or a variety of other objectives. Hedging might also allow an executive to avoid the public scrutiny that comes from a substantial sale of company shares.
At the same time, obvious problematic issues are related to executive hedging. First, hedging unwinds equity incentives that the board intended to align the interests of management with those of shareholders. Second, allowing an executive to hedge is costly to the company. Management demands larger compensation for receiving risky equity incentives instead of risk-free cash compensation. Through hedging, however, the executive can translate the value of that premium to cash. This results in a higher compensation bill for the company.58 Third, explaining to shareholders why it is in their interest to allow executives to hedge is exceedingly difficult. Hedging requires the executive to take a “short” position in the company’s shares. Although it is illegal for an executive to short-sell, it is permissible to buy a put option on company stock. For obvious reasons, the compensation committee and the entire board need to discuss and define the circumstances under which hedging is permissible.
According to data from Institutional Shareholder Services (ISS), 54 percent of companies in the Russell 3000 and 84 percent of companies in the S&P 500 have a policy prohibiting executives from hedging.59 Bettis, Bizjak, and Kalpathy (2013) found hedging transactions by 1,181 executives at 911 firms between 1996 and 2006.60 The most common techniques for hedging are zero-cost collars and prepaid variable forward contracts (see the following sidebar).61
Hedging Examples
• If stock price ≤ $10.74 (floor), 1 million shares
• If stock price between floor ($10.74) and cap ($12.88), number of shares = (floor/price) × 1 million shares
• If price > cap ($12.88), number of shares = [(stock price – cap + floor)/stock price] × 1 million shares64
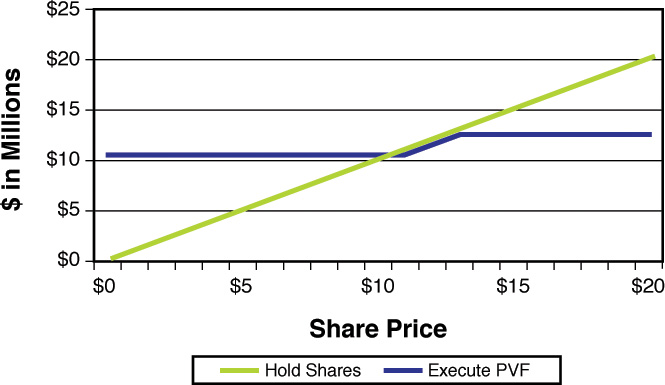
Assuming that the cash received was invested in the market with a 10 percent return over two years.
Figure 9.6 Payout under the prepaid-variable forward.
The Dodd–Frank bill requires companies to disclose whether they allow executives to hedge equity positions. Previously, this disclosure was not required. Guidelines for executive hedging (if they exist) are typically included in the insider trading policy. Companies are not required to make this policy public (see the following sidebar).
Several studies have examined the prevalence and implications of hedging activity among senior executives. Bettis, Bizjak, and Lemmon (2001) studied the use of zero-cost collars and found that executives use these transactions to hedge approximately 36 percent of their total holdings. The number of shares hedged was approximately 10 times greater than the number of shares sold by these executives through outright sales transactions. Hedges were put on during periods in which other insiders were executing a relatively high volume of sales. The authors did not, however, find evidence that executives using these transactions outperformed the market and thus concluded that hedges do not indicate trading on the basis of inside information.67
Jagolinzer, Matsunaga, and Yeung (2007) studied the use of prepaid-variable forward transactions. They found that the average PVF transaction hedged 30 percent of the executive’s equity position. The number of shares involved in a PVF transaction was approximately 50 times larger than the number of shares sold by these same insiders in outright sales transactions during the preceding year. The authors found that PVF transactions preceded periods of abnormal stock returns and concluded that the hedges were used to protect against anticipated declines in the company stock, generally after a period of strong outperformance.68
Bettis, Bizjak, and Kalpathy (2013) found that executives tended to place hedges after the company share price made significant run-ups relative to the market. They also found that zero-cost collar and PVF hedges tended to precede significant declines in the company share price, which might signal that executives were acting on inside information.69
Pledging
Instead of selling or hedging, an executive might decide to pledge shares as collateral for a loan, with the proceeds used either to purchase a diversified portfolio of assets, to enter new business activities, or for personal spending. As with hedging transactions, pledging might be more tax efficient than an outright sale. The interest rate on collateralized loans might also be relatively low. In addition, the executive does not necessarily have to sell shares to settle the loan and thus may maintain a high level of ownership in the company.
At the same time, the board of directors must understand why the executive wants to pledge shares. If the proceeds of the loans are used for personal consumption (such as paying college tuition or remodeling a home), the board might decide that it has minimal impact on managerial incentives. However, what does it say about the focus and dedication of the executive if the proceeds are used to launch a new business venture or finance risky investments? What would be the impact if these activities failed and the CEO went bankrupt? Is the board willing to offset these losses with additional compensation and equity grants? Clearly, pledging transactions deserve special consideration (see the following sidebar).
Companies are required to disclose whether executives have pledged shares in a brokerage account or used them as collateral for a loan. According to survey data, approximately 20 percent of companies allow their executives to pledge shares.70 An electronic search of available proxy statements found that 982 executive officers have pledge disclosures. The median percentage of total shares pledged was 44.4 percent. When executives pledge their shares, they tend to do so in an aggressive manner.
Repricing and Exchange Offers
A repricing or exchange offer is a transaction in which employees holding stock options are allowed to exchange those options for either a new option, restricted stock, or (less frequently) cash. A company initiates an exchange offer when the exercise prices of outstanding employee stock options are above the current market price of the stock to such a large extent that it is unlikely that they will become profitable in the near term. The company offers to replace options that have very low market value with more valuable rewards to restore the incentive that employees have to pursue corporate goals.
Management typically initiates the exchange process by evaluating the profile of employee option holdings, the potential incentive and retention effects, shareholder considerations, and the cost of implementation. If shareholder approval is not required under the terms of the equity program, the board can approve and implement an exchange. If shareholder approval is required, the board must seek shareholder approval for the authority (but not the obligation) to implement an exchange. This authority expires after a specified period of time. Proposals are voted on in either the regular annual meeting or a special meeting. If the proposal is approved, the board can then decide to implement an exchange, but if market conditions change between plan inception and shareholder approval, or if there is executive or board turnover, the plan might not be implemented. In addition, employees are not required to accept an exchange offer made by the company; they have the right to retain unexercised options (both vested and unvested) if they choose to do so.
Once approved, the exchange may be made at a premium to fair value, at fair value, or at a discount to fair value (see the next sidebar):
• Premium to fair value—This is a straight repricing in which the exercise price of each option is reduced but no other terms of the option (including the number of shares) are changed. Alternatively, a firm may offer restricted shares worth more than the fair value of the underwater options to provide the incentive needed for employees to accept the exchange.
• Equal to fair value—New awards are granted so that their value is exactly equal to the fair value of underwater options. When there are multiple outstanding tranches (with varying strike prices and remaining terms), implementing a fair-value program can be difficult. For example, should all the tranches be exchanged, or only tranches that are deeply out of the money?
• Discount to fair value—New awards are granted so that their value is less than the fair value of the underwater options.
New awards typically change the vesting terms of the old award, and some firms require additional vesting beyond the term of the forfeited awards to extend the retention period. If fully vested options are being exchanged, a minimum level of vesting (such as six months) typically is attached to the new shares.
An exchange offer can effectively restore the incentive value of equity awards that have lost much of their value due to significant stock price declines. This is particularly true when the stock price declines are caused by general market factors (such as a recession or financial crisis) and not events that are specific to the firm (such as underperformance). Exchange offers can reduce voluntary turnover of key employees who might otherwise leave to work at other firms.
On the other hand, exchange offers might signal a culture of entitlement within the company. Frequent repricing encourages the expectation that risky incentives will pay out regardless of company performance. Repricings also put the board in the awkward position of having to explain to investors why employees should be compensated for the reduced value of their holdings when shareholders who have suffered similar losses are not. Some shareholders view exchange offers as a “giveaway” to corporate insiders.
The research results on exchange offers are somewhat mixed. Carter and Lynch (2001) found that firms reprice options as a result of company-specific (not industry-wide) performance problems. Still, they did not find evidence that exchange offers were driven by agency problems; instead, they found that exchanges were made to restore incentive value to employees and prevent turnover.76 Chidambaran and Prabhala (2003) reached similar conclusions. They found that repricings occurred among companies with abnormally high CEO turnover, suggesting that they were not initiated by entrenched management. Furthermore, more than 40 percent of firms that repriced excluded the CEO in their exchange offers.77
Other studies have suggested that repricing might not benefit the firm or its stakeholders. Carter and Lynch (2004) found modest evidence that employee turnover is lower following repricing but that executive turnover is unaffected.78 Brenner, Sundaram, and Yermack (2000) found that repricing is negatively correlated with subsequent firm performance, even adjusting for industry conditions.79 Chance, Kumar, and Todd (2000) found that firms with greater agency problems, smaller size, and insider-dominated boards are more likely to reprice.80 Finally, Callaghan, Saly, and Subramaniam (2004) found that repricings tend to precede the release of positive information about the firm or follow the release of negative information, suggesting that repricing events might be opportunistically timed to benefit insiders (similar to the manipulation of the timing of new grants).81
Larcker, McCall, and Ormazabal (2013) found that shareholders generally react positively to the announcement of an exchange offer but the structure of these offers are constrained by proxy advisory firms, as we discuss in Chapter 12, “Institutional Shareholders and Activist Investors.”82
The evidence therefore suggests that exchange offers are not uniformly good or bad and that the benefits to shareholders are somewhat unclear. As such, repricing and exchange offers are controversial decisions for the board and shareholders. Although infrequent, exchange offers are a continuing issue for companies that offer equity-based compensation, particularly during bear markets.
Endnotes
1. Equilar, Inc., proprietary compensation and equity ownership data for fiscal years from June 2013 to May 2014.
2. The authors measured company performance using Tobin’s Q, the ratio of market to book value. We discuss this ratio in Chapter 1, “Introduction to Corporate Governance.” See Randall Morck, Andrei Shleifer, and Robert W. Vishny, “Management Ownership and Market Valuation: An Empirical Analysis,” Journal of Financial Economics 20 (1988): 293–315.
3. John J. McConnell and Henri Servaes, “Additional Evidence on Equity Ownership and Corporate Values,” Journal of Financial Economics 27 (1990): 595–612.
4. Anna Elsilä, Juha-Pekka Kallunki, and Henrik Nilsson, “CEO Personal Wealth, Equity Incentives, and Firm Performance,” An International Review 21 (2013): 26–41.
5. Ulf von Lilienfeld-Toal and Stefan Ruenzi, “CEO Ownership, Stock Market Performance, and Managerial Discretion,” Journal of Finance 69 (2014): 1013–1050.
6. Abbott Laboratories, Form DEF 14A, filed with the Securities and Exchange Commission March 14, 2014.
7. Equilar, Inc., “Executive Stock Ownership Guidelines Report” (2013). Accessed March 3, 2015. See www.equilar.com.
8. John E. Core and David F. Larcker, “Performance Consequences of Mandatory Increases in Executive Stock Ownership,” Journal of Financial Economics 64 (2002): 317–340.
9. See Clifford W. Smith and René M. Stulz, “The Determinants of Firms’ Hedging Policies,” Journal of Financial and Quantitative Analysis 20 (1985): 391–405; Richard A. Lambert, David F. Larcker, and Robert E. Verrecchia, “Portfolio Considerations in Valuing Executive Compensation,” Journal of Accounting Research 29 (1991): 129–149; and Stephen A. Ross, “Compensation, Incentives, and the Duality of Risk Aversion and Riskiness,” Journal of Finance 59 (2004): 207–225.
10. Jeff L. Coles, Naveen D. Daniel, and Lalitha Naveen, “Managerial Incentives and Risk-Taking,” Journal of Financial Economics 79 (2006): 431–468.
11. Todd A. Gormley, David A. Matsa, and Todd Milbourn, “CEO Compensation and Corporate Risk: Evidence from a Natural Experiment,” Journal of Accounting and Economics 56 (2013): 79–101.
12. Christopher S. Armstrong and Rahul Vashishtha, “Executive Stock Options, Differential Risk-Taking Incentives, and Firm Value,” Journal of Financial Economics 104 (2012): 70–88.
13. Jeong-Bon Kim, Yinghua Li, and Liandong Zhang, “CFOs versus CEOs: Equity Incentives and Crashes,” Journal of Financial Economics 10 (2011): 713–730.
14. KPMG, “Never Again? Risk Management in Banking beyond the Credit Crisis” (2009). Accessed August 11, 2014. See https://www.kpmg.com/LU/en/IssuesAndInsights/Articlespublications/Documents/Riskmanagementinbankingbeyondthecreditcrisis.pdf.
15. PricewaterhouseCoopers and Economist Intelligence Unit, “Reward: A New Paradigm?” (September 2008). Accessed August 14, 2015. See http://www.pwc.lu/en_LU/lu/hr/docs/pwc-publ-reward-a-new-paradigm.pdf.
16. Board of Governors of the Federal Reserve System Press Release (October 22, 2009). Accessed April 7, 2014. See http://www.federalreserve.gov/newsevents/press/bcreg/20091022a.htm.
17. Timothy Geithner, “Testimony to Senate Appropriations Subcommittee on the Treasury Department’s Budget Request,” Reuters (June 6, 2009).
18. Edited lightly for clarity. Alan S. Blinder, “Crazy Compensation and the Crisis,” Wall Street Journal (May 28, 2009, Eastern edition): A.15.
19. David F. Larcker, Gaizka Ormazabal, Brian Tayan, and Daniel J. Taylor, “Follow the Money: Compensation, Risk, and the Financial Crisis,” Stanford Closer Look Series (September 8, 2014). Accessed May 5, 2015. See http://www.gsb.stanford.edu/faculty-research/centers-initiatives/cgri/research/closer-look.
20. Robert DeYoung, Emma Y. Peng, and Meng Yan, “Executive Compensation and Business Policy Choices at U.S. Commercial Banks,” Journal of Financial and Quantitative Analysis 48 (2013): 165–196.
21. Rüdiger Fahlenbrach and René M. Stulz, “Bank CEO Incentives and the Credit Crisis,” Journal of Financial Economics 99 (2011): 11–26.
22. Ameriprise Financial Inc., Form DEF 14A, filed with the Securities and Exchange Commission March 17, 2014.
23. Moog Inc., Form DEF 14A, filed with the Securities and Exchange Commission December 12, 2014.
24. Jared Harris and Philip Bromiley, “Incentives to Cheat: The Influence of Executive Compensation and Firm Performance on Financial Misrepresentation,” Organization Science 18 (2007): 350–367.
25. William R. Baber, Sok-Hyon Kang, Lihong Liang, and Zinan Zhu, “External Corporate Governance and Misreporting,” Social Science Research Network (2013). Accessed November 12, 2010. See http://ssrn.com/abstract=760324.
26. Shane A. Johnson, Harley E. Ryan, Jr., and Yisong S. Tian, “Managerial Incentives and Corporate Fraud: The Sources of Incentives Matter,” Review of Finance 13 (2009): 115–145.
27. Merle Erickson, Michelle Hanlon, and Edward L. Maydew, “Is There a Link Between Executive Equity Incentives and Accounting Fraud?” Journal of Accounting Research 44 (2006): 113–143.
28. Chris S. Armstrong, Alan D. Jagolinzer, and David F. Larcker, “Chief Executive Officer Equity Incentives and Accounting Irregularities,” Journal of Accounting Research 48 (2010): 225–271.
29. Christopher S. Armstrong, David F. Larcker, Gaizka Ormazabal, and Daniel J. Taylor, “The Relation Between Equity Incentives and Misreporting: The Role of Risk-Taking Incentives,” Journal of Financial Economics 109 (2013): 327–350.
30. David Yermack, “Good Timing: CEO Stock Option Awards and Company News Announcements,” Journal of Finance 52 (1997): 449–476.
31. David Aboody and Ron Kasznik, “CEO Stock Option Awards and the Timing of Corporate Voluntary Disclosures,” Journal of Accounting and Economics 29 (2000): 73–100.
32. Erik Lie, “On the Timing of CEO Stock Option Awards,” Management Science 51 (2005): 802–812. Reproduced with permission of the Institute for Operations Research and Management Sciences in the format Tradebook via Copyright Clearance Center.
33. Charles Forelle and James Bandler, “The Perfect Payday—Some CEOs Reap Millions by Landing Stock Options When They Are Most Valuable; Luck—or Something Else?” Wall Street Journal (March 18, 2006, Eastern edition): A.1.
34. Alan Murray, “The Economy; Business: Will Backdating Scandal Thwart Effort to Roll Back Reforms?” Wall Street Journal (December 20, 2006, Eastern edition): A.2. See also “Perfect Payday: Options Scorecard,” Wall Street Journal Online (2007). Accessed September 4, 2007. See http://online.wsj.com/public/resources/documents/info-optionsscore06-full.html.
35. Lucian A. Bebchuk, Yaniv Grinstein, and Urs C. Peyer, “Lucky CEOs and Lucky Directors,” Journal of Finance 65 (2010): 2363–2401.
36. The practice of granting in-the-money options to executives is not illegal. Companies may do so with the prior approval of shareholders and as long as the grants are properly reported. Retroactively manipulating a grant date, however, violates Generally Accepted Accounting Principles, IRS tax rules, and SEC regulations. For more on backdating, see Christopher S. Armstrong and David F. Larcker, “Discussion of ‘The Impact of the Options Backdating Scandal on Shareholders’ and ‘Taxes and the Backdating of Stock Option Exercise Dates,’” Journal of Accounting and Economics 47 (2009): 50–58.; John Bizjak, Michael Lemmon, and Ryan Whitby, “Option Backdating and Board Interlocks,” Review of Financial Studies 22 (2009): 4821–4847; Gennaro Bernile and Gregg A. Jarrell, “The Impact of the Options Backdating Scandal on Shareholders,” Journal of Accounting and Economics 47 (2009): 2–26.
37. Definitions from Mark Maremont and Charles Forelle, “Open Spigot: Bosses’ Pay: How Stock Options Became Part of the Problem; Once Seen as a Reform, They Grew into Font of Riches and System to Be Gamed; Reload, Reprice, Backdate,” Wall Street Journal (December 27, 2006, Eastern edition): A.1. Note that exercise backdating works only for transactions that are executed through the firm, where there is a possibility of getting someone from within the firm to agree to retroactively change the exercise date. Exercise backdating does not work for cashless exercise through a broker.
38. Dhaliwal, Erickson, and Heitzman (2009) found that CEOs who engage in exercise backdating realized average (median) tax savings of $96,000 ($7,000). It is difficult to believe that executives would be motivated by this somewhat trivial magnitude of savings, especially when there is some chance of getting caught by the board of directors or regulators. See Dan Dhaliwal, Merle Erickson, and Shane Heitzman, “Taxes and the Backdating of Stock Option Exercise Dates,” Journal of Accounting and Economics 47 (2009): 27–49.
39. In 2008, the SEC investigated the stock option grant practices at Analog Devices. At issue was whether the company both backdated and spring-loaded options. Although the company agreed to pay a $3 million fine for backdating, no settlement was sought for spring-loading. An SEC commissioner indicated that spring-loading was not a form of illegal trading. See Kara Scannell and John Hechinger, “SEC, Analog Settle Case—‘Spring-Loading’ Options Complaint Isn’t Included,” Wall Street Journal (May 31, 2008, Eastern edition): B.5.
40. For most public purposes, the term insider trading refers to illegal activity. The SEC, however, considers all trading by insiders to be insider trading and distinguishes between legal and illegal insider trading. See Securities and Exchange Commission, “Insider Trading” (last modified April 19, 2001). Accessed May 5, 2015. See www.sec.gov/answers/insider.htm.
41. Securities Lawyer’s Deskbook, “Rule 10b5: Employment of Manipulative and Deceptive Devices.” Accessed May 5, 2015. See https://www.law.cornell.edu/cfr/text/17/240.10b-5.
42. Dionne Searcey, Peter Lattman, Peter Grant, and Amol Sharma, “Qwest’s Nacchio Is Found Guilty in Trading Case; Ex-CEO’s Conviction on 19 of 42 Counts Adds to Government’s Wins,” Wall Street Journal (April 20, 2007, Eastern edition): A.1. See also, “Judge Cuts Ex-Qwest CEO’s Sentence by 2 Months,” Reuters (June 24, 2010). Accessed November 12, 2010. See http://www.reuters.com/article/2010/06/24/us-nacchio-idustre65n6fe20100624.
43. Recent survey data found that only 30 percent of companies disclose their insider trading policies. See David F. Larcker and Brian Tayan, “Pledge (and Hedge) Allegiance to the Company,” Stanford Closer Look Series (October 11, 2010). Accessed May 5, 2015. See http://www.gsb.stanford.edu/faculty-research/centers-initiatives/cgri/research/closer-look.
44. Alan D. Jagolinzer, David F. Larcker, and Daniel J. Taylor, “Corporate Governance and the Information Content of Insider Trades,” Journal of Accounting Research 49 (2011): 1249–1274.
45. Ibid.
46. Crimson Exploration, Inc., “Crimson Exploration Insider Trading Policy” (2010). Last accessed November 12, 2010. See http://crimsonexploration.com/default/Insider_Trading_Policy_Preclearance_3_1_2010.pdf.
47. Josef Lakonishok and Inmoo Lee, “Are Insider Trades Informative?” Review of Financial Studies 14 (2001): 79–111.
48. Nejat H. Seyhun, “Insiders’ Profits, Costs of Trading, and Market Efficiency,” Journal of Financial Economics 16 (1986): 189–212.
49. See also James H. Lorie and Victor Niederhoffer, “Predictive and Statistical Properties of Insider Trading,” Journal of Law and Economics 11 (1968): 35–53; Jeffrey F. Jaffe, “Special Information and Insider Trading,” Journal of Business 47 (1974): 410–428; S. P. Pratt and C. W. DeVere, “Relationship between Insider Trading and Rates of Return for NYSE Common Stocks, 1960–1966,” in Modern Developments in Investment Management, edited by James H. Lorie and Richard Brealey (New York: Praeger, 1970); Joseph E. Finnerty, “Insiders and Market Efficiency,” Journal of Finance 31 (1976): 1141–1148.
50. Securities and Exchange Commission, “Proposed Rule: Selective Disclosure and Insider Trading” (July 31, 1999; modified January 10, 2000). Accessed May 5, 2015. See www.sec.gov/rules/proposed/34-42259.htm.
51. Securities Lawyer’s Deskbook, “Rule 10b5-1: Trading ‘on the Basis of’ Material Nonpublic Information in Insider Trading Cases.” Accessed May 5, 2015. See https://www.law.cornell.edu/cfr/text/17/240.10b5-1.
52. The broker also is not permitted to execute trades under the 10b5-1 plan if he or she comes into possession of material nonpublic information.
53. Larcker and Tayan (2010).
54. Ibid.
55. Datalink Corporation, Form 8-K, filed with the Securities and Exchange Commission February 13, 2006.
56. McDATA Corporation, Form 8-K, filed with the Securities and Exchange Commission May 13, 2002.
57. Alan D. Jagolinzer, “SEC Rule 10b5-1 and Insiders’ Strategic Trade,” Management Science 55 (2009): 224–239.
58. Assume that a CEO requires compensation of $1 million. The board can offer either cash or equity. However, because equity has uncertain value, the executive will require a premium relative to cash (say, $1.2 million in expected value of stock options vs. $1 million riskless cash). Although the CEO might be indifferent between these two forms of payment, if he or she immediately hedges the options, the $1.2 million in risky compensation will be converted to $1.2 million in riskless cash (minus transaction costs). In this case, the board overpaid because it could have satisfied the CEO with $1 million in cash instead of the $1.2 million in equity it gave up.
59. Cited in TheCorproateCounsel.net, “Hedging & Pledging Policies: Possible Approaches & Survey,” TheCorporateCounsel.net Blog (February 18, 2015). Accessed May 5, 2015. See http://www.thecorporatecounsel.net/blog/2015/02/hedging-pledging-policies-possible-approaches-survey.html.
60. J. Carr Bettis, John M. Bizjak, and Swaminathan L. Kalpathy, “Why Do Insiders Hedge Their Ownership and Options? An Empirical Examination,” Social Science Research Network (June 18, 2013). Accessed November 12, 2014. See http://ssrn.com/abstract=1364810.
61. Two other (less common) hedging devices are an equity swap and exchange-traded funds. An equity swap is an agreement between two parties to exchange cash flows associated with the performance of their specific holdings. The arrangement allows each party to diversify its income while still holding the original assets. An exchange-traded fund allows an investor to exchange his or her large holding of a single stock for units in a pooled (diversified) portfolio.
62. Chattem Inc., Form 4, filed with the Securities and Exchange Commission January 26, 2005.
63. Quest Software, Form DEF 14A, filed with the Securities and Exchange Commission April 30, 2002.
64. Quest Software, Form 4, filed with the Securities and Exchange Commission November 4, 2002.
65. Delta Air Lines, Form DEF 14A, filed with the Securities and Exchange Commission May 23, 2014.
66. UnitedHealth Group Incorporated, Form DEF 14A, filed with the Securities and Exchange Commission April 23, 2014.
67. J. Carr Bettis, John M. Bizjak, and Michael L. Lemmon, “Managerial Ownership, Incentive Contracting, and the Use of Zero-cost Collars and Equity Swaps by Corporate Insiders,” Journal of Financial and Quantitative Analysis 36 (2001): 345–370.
68. Alan D. Jagolinzer, Steven R. Matsunaga, and P. Eric Yeung, “An Analysis of Insiders’ Use of Prepaid Variable Forward Transactions,” Journal of Accounting Research 45 (2007): 1055–1079.
69. Bettis, Bizjak, and Kalpathy (2013).
70. An analysis of ISS Governance QuickScore data finds that 54.3% of Russell 3000 companies have a policy prohibiting hedging of company shares by employees, while 84% of large capital S&P 500 companies have such a policy. Executive or director pledging of company shares was prevalent at just 14.2% of Russell 3000 companies, and, notably, 15.8% of S&P 500 companies. TheCorporateCounsel.net (2015). Source for survey data is Larcker and Tayan (2010).
71. Peter Galuszka, “Chesapeake Energy Not Alone in Margin Call Madness,” BNET Energy (October 13, 2008). Accessed November 17, 2010. See www.bnet.com/blog/energy/chesapeake-energy-not-alone-in-margin-call-madness/313.
72. Posted by TraderMark on April 3, 2009: “Chesapeake Energy (CHK) CEO Aubrey McClendon with New Shady Compensation Deal; I Was Right in My Prediction.” Accessed November 17, 2010. See www.fundmymutualfund.com/2009/04/chesapeake-energy-chk-ceo-aubrey.html.
73. Continental Resources, Inc., Schedule 13D, filed with the Securities and Exchange Commission January 13, 2015.
74. Oracle Corp., Form DEF 14A, filed with the Securities and Exchange Commission September 23, 2014.
75. Citadel Broadcasting, Form DEF 14A, filed with the Securities and Exchange Commission April 17, 2006.
76. Mary Ellen Carter and Luann J. Lynch, “An Examination of Executive Stock Option Repricing,” Journal of Financial Economics 61 (2001): 207–225.
77. N. K. Chidambaran and Nagpurnanand R. Prabhala, “Executive Stock Option Repricing Internal Governance Mechanisms and Management Turnover,” Journal of Financial Economics 69 (2003): 153–189.
78. Mary Ellen Carter and Luann J. Lynch, “The Effect of Stock Option Repricing on Employee Turnover,” Journal of Accounting and Economics 37 (2004): 91–112.
79. Menachem Brenner, Rangarajan K. Sundaram, and David Yermack, “Altering the Terms of Executive Stock Options,” Journal of Financial Economics 57 (2000): 103–128.
80. Don M. Chance, Raman Kumar, and Rebecca B. Todd, “The ‘Repricing’ of Executive Stock Options,” Journal of Financial Economics 57 (2000): 129–154.
81. Sandra Renfro Callaghan, P. Jane Saly, and Chandra Subramaniam, “The Timing of Option Repricing,” Journal of Finance 59 (2004): 1651–1676.
82. David F. Larcker, Allan L. McCall, and Gaizka Ormazabal, “Proxy Advisory Firms and Stock Option Repricing,” Journal of Accounting and Economics 56 (2013): 149–169.