
8. Executive Compensation and Incentives
In this chapter, we examine executive compensation and incentives. Executive officers develop the corporate strategy and business model, and they oversee daily management of the firm. Like other employees, executives require monetary compensation for their work.1 Compensation packages must be sufficient in terms of their level and structure to attract, retain, and motivate qualified executives to create shareholder or stakeholder value.
The compensation committee and the independent directors on the board approve the compensation program. In theory, this should be a simple exercise. The “right” amount of compensation to be paid is the minimum amount it takes to attract and retain a qualified individual. After all, this is the same calculus that goes into setting compensation for all other job functions. However, several factors complicate how this works in practice. As we discussed in the previous chapter, the labor market for chief executive officers does not appear to be highly efficient. Because of potential imbalances between supply and demand and the difficulty in evaluating the quality of candidates, it is not always easy for boards to identify the appropriate executive or the market wage necessary to attract this individual. Moreover, some board members might provide insufficient oversight (because of a lack of independence, insufficient engagement, or a lack of power relative to the CEO) during the compensation-setting process. These factors have the potential to distort executive compensation packages in terms of both size and structure.
Further complicating the process is the large amount of scrutiny this issue receives from the media and Congress.2 Although some of this attention is merited, the intensity with which many observers have established their position has influenced the tone of the debate, making it difficult to arrive at a reasoned decision about how much compensation is appropriate.
The Controversy over Executive Compensation
Executive compensation has long been a controversial topic in corporate America. In the 1930s, economic depression coupled with enhanced disclosure laws mandated by the Securities and Exchange Commission (SEC) stoked popular outrage over some executive compensation packages. Particular ire was reserved for the compensation paid to executives of the industrial and financial powerhouses of the time, including Bethlehem Steel, General Motors, American Tobacco, and National City Bank, who each received compensation in excess of $1 million. The sentiment of the era is perhaps best encapsulated by Justice Thomas Swan of the Circuit Court of Appeals, who wrote that “no man can be worth $1,000,000 a year.”3
However, the debate was more muted in the decades following World War II. This is primarily because executive compensation grew at more modest rates between the 1950s and 1970s, well below those of inflation and general wages.4 High marginal income tax rates (more than 70 percent for top earners) helped to lower the overall size of executive salaries. Few executives received compensation more than the psychologically important $1 million mark.
However, the trend reversed in the 1980s. During a period characterized first by high inflation and then by rapid economic growth, executive compensation ballooned. The trend coincided with a compensation shift away from fixed salaries and annual bonuses toward variable pay tied to long-term performance targets and stock options.5 Several executives received generous payouts. For example, in 1987, Charles Lazarus of Toys R Us, Michael Blumenthal of Unisys, and Lee Iacocca of Chrysler all received bonuses in excess of $10 million.6 Investment bankers, Wall Street traders, and private equity partners saw similar increases in pay.
In the 1990s and 2000s, the widespread adoption of stock options accelerated the trend. Exploding corporate profits and a strong bull market enabled several executives to profit handsomely. According to the Wall Street Journal, 16 executives of major corporations received total stock option compensation in excess of $500 million between 1992 and 2005, including William McGuire of HealthSouth ($2.1 billion), Larry Ellison of Oracle ($1.5 billion), Sandy Weill of Citigroup ($980 million), and Michael Eisner of Disney ($920 million).7 Furthermore, total compensation figures were increased by supplemental payments (those made beyond salary and bonuses) that were not always transparently disclosed to investors. Examples included deferred compensation, golden parachutes, and supplemental executive retirement plans (SERPs). The most famous payouts were made to Robert Nardelli of Home Depot ($210 million), Hank McKinnell of Pfizer ($83 million), Lee Raymond of ExxonMobil ($405 million), and Dick Grasso of the New York Stock Exchange ($187.5 million), all in conjunction with their retirements.8
Executive compensation levels tapered off during the financial crisis of 2008 and the subsequent recession. The change was most notable among bank executives, such as Jamie Dimon of JPMorgan Chase, whose total compensation decreased from $28 million in 2007 to $21 million in 2010, and Kenneth Chenault of American Express, whose total compensation decreased from $34 million to $17 million over the same time period.9 New rules, including a requirement under the Dodd–Frank Act that companies grant shareholders an advisory “say on pay” vote, were intended to stem the tide of rising compensation. However, when the recession ended, downward pressure on executive compensation waned, and pay levels reached new heights.
Critics believe that current CEO compensation levels are not justified based on performance and value creation but are instead indicative of a market failure. Bebchuk and Fried (2006) succinctly expressed this view:
Flawed compensation arrangements have not been limited to a small number of “bad apples”; they have been widespread, persistent, and systemic. Furthermore, the problems have not resulted from temporary mistakes or lapses of judgment that boards can be expected to correct on their own; rather, they have stemmed from structural defects in the underlying governance structures that enable executives to exert considerable influence over their boards.10
Is this true? To find out, we review the size and structure of compensation packages. We consider the incentive value of certain compensation elements, including annual bonuses and equity-based pay. We also evaluate the relations between compensation, performance, and risk. We end with a discussion of shareholder perspective on executive compensation and disclosure.
Components of Compensation
The compensation committee of the board of directors recommends the compensation of the chief executive officer and other senior executives. This work is typically performed in consultation with the human resources and finance departments and third-party compensation consultants. Compensation packages are approved by a vote of the independent directors of the full board of directors. A vote of shareholders must generally approve equity-based compensation plans (such as stock option plans and restricted stock awards).
The details of the compensation plan—including those that require shareholder approval and those that do not—are described in the annual proxy. This includes the “fair value” of the total compensation awarded to the chief executive officer and other named officers in each of the previous three years, and values realized by these individuals through the exercise or vesting of equity-based grants. The SEC requires that corporations also include a Compensation Discussion & Analysis (CD&A) section in the proxy. The CD&A includes information that might be useful to shareholders in evaluating the compensation program, including the company’s compensation philosophy, elements of the pay package, total compensation awarded, the peer groups used for comparative purposes in designing compensation and measuring performance, performance metrics used to award variable pay, pay equity between the CEO and other senior executives, stock ownership guidelines, pledging activity by officers and directors, clawback policies, severance agreements, golden parachutes, and post-retirement compensation.11
A compensation plan serves three primary purposes.12 First, it must attract the right people—those with the skill set, experience, and behavioral profile necessary to succeed in the position. Second, it must be sufficient to retain those individuals; otherwise, they will leave to work at another organization that offers more appropriate compensation for their talents. Third, it must provide the right incentives to motivate them to perform appropriately. This includes encouraging behaviors that are consistent with the corporate strategy and risk profile of the organization and discouraging self-interested behavior.
The executive compensation package generally includes some or all of the following elements:
• Annual salary—Fixed cash payment made evenly during the course of the year. Section 162(m) of the Internal Revenue Code limits the tax deductibility of executive compensation greater than $1 million unless such compensation is performance driven. The fixed salary is typically set at the beginning of the year.
• Annual bonus—Additional payment, usually in the form of cash awarded if the yearly performance of the company exceeds specified financial and nonfinancial targets. The size of the bonus is commonly expressed as a percentage of base salary and might include a guaranteed minimum and specified maximum.
The bonus computation might also include a discretionary element. This can be desirable because all aspects of performance cannot be forecast perfectly (for example, reasonable targets might be impossible to achieve when macroeconomic or industry factors change in a negative way). The board might want to reward executives for their efforts if they do well in a year when economic conditions impact their performance relative to what was expected when the goals were first established.13 However, discretionary elements can have negative consequences if they reward executives without regard to performance. In this case, discretionary bonuses might indicate that the board has been coopted by management. The compensation committee must make the important choice of a formulaic versus subjective bonus plan, which is a necessary disclosure in the CD&A. Furthermore, a discretionary cash bonus requires disclosure through Form 8-K upon adoption.14
• Stock options—The right to buy shares in the future at a fixed exercise price, generally equal to the stock price on the grant date. Stock options typically have vesting requirements (that is, they are “earned” in even batches over time or in blocks, such as 25 percent at the end of each of the next 4 years) and expire after 10 years (with 7 years being the next-most-popular term). Some companies adopt “hold to retirement” or “hold past retirement” requirements for equity awards. These features encourage long-term equity ownership and are intended to align the interests of executives with those of shareholders.
• Restricted stock—An outright grant of shares that are restricted in terms of transferability and are subject to a time-based vesting schedule. When vested, they are economically equivalent to a direct investment in company stock.
• Performance shares (units)—Equity (or cash) awards granted only after specified financial and nonfinancial targets are met during a three- to five-year time period. Performance shares and performance units work the same way except for how the final award is paid—in stock or in cash. The size of the award is generally based on a percentage of base salary, similar to the method used to calculate the annual cash bonus. The maximum award is usually 200 percent of the target. In many ways, performance plans are simply a longer-term version of the annual bonus plan. The performance criteria generally include some type of profit measure (such as earnings-per-share growth or return on assets) or total shareholder return. According to Equilar (2014), 64 percent of companies in the S&P 1500 include long-term performance awards in their CEO compensation package, compared with 57 percent restricted stock, and 50 percent stock options.15
• Perquisites—Other amenities purchased or provided by the company, such as personal use of a company car or airplane, club memberships, or a home or an apartment.
• Contractual agreements—Other cash or stock payments stipulated in the employment agreement, such as severance agreements, post-retirement consulting agreements, and golden parachutes (payments made upon a change in control).
• Benefits—Other benefits provided with employment, such as health insurance, post-retirement health insurance, defined contribution retirement accounts (401[k]), supplemental executive retirement plans (SERPs), life insurance, payment for the use of a personal financial planner, and reimbursement of taxes owed on taxable benefits.
The compensation package might also be subject to certain contractual restrictions:
• Stock ownership guidelines—The minimum amount of stock that an executive is required to hold during employment, generally expressed as a multiple of base salary. Among the Fortune 100 companies, 84 percent have stock ownership guidelines, typically of an amount equal to five or six times base salary.16 (Executive stock ownership guidelines are discussed more fully in Chapter 9, “Executive Equity Ownership.” Director stock ownership guidelines are discussed in Chapter 4, “Board of Directors: Selection, Compensation, and Removal.”)
• Pledging restrictions—The use of shares as collateral for a personal loan, margin loan through a brokerage account, or other type of financial transaction. The Dodd–Frank Act requires companies to disclose pledging activity by officers and directors. (We discuss pledging in Chapter 9.)
• Clawbacks and deferred payouts—A contractual provision that enables the company to reclaim compensation in future years if it becomes clear that bonus compensation should not have been awarded previously (see the following sidebar). Section 304 of the Sarbanes–Oxley Act enables companies to reclaim bonuses from the CEO and CFO if it is later determined that the bonuses were awarded on the basis of manipulated earnings.17 The Dodd–Frank Act broadened the use of clawbacks by requiring companies to develop, implement, and disclose a clawback policy. According to Equilar, the most common triggers of a clawback are a financial restatement, ethical misconduct, and violation of a noncompete clause.18 Some companies defer the payout of bonuses until sufficient time has elapsed to determine whether the payment is economically justified.
Determining Compensation
The compensation committee and the board of directors are responsible for determining the level of compensation paid to the CEO and other officers. They must also select the mix of short-term and long-term elements to achieve a payout structure that is consistent with the firm’s strategy. In theory, this should be a straightforward exercise, with the level of total compensation set to be commensurate with the value of services received. The process might work as follows: First, determine how much value the company expects to create during a reasonable time horizon (for example, five years). Then determine how much of this value should be attributable to the efforts of the CEO. Finally, determine what percentage of that value should be fairly offered to the CEO as compensation. Although many boards may implicitly follow this type of approach, it is exceedingly difficult to measure the value creation attributable to the efforts of a specific executive.
Instead, most boards determine compensation levels by benchmarking their CEO’s pay against that of a set of companies that are comparable in size, industry, and geography (peer group). Interviews with compensation consultants reveal that companies commonly aim to provide cash compensation (base salary and annual bonus) at the 50th or lower percentile of the peer group and long-term incentives (primarily equity-based compensation) at the 75th percentile. These figures represent the board’s assessment of the market wage opportunity of the CEO and other executive officers. The compensation committee also needs to make sure that the level of pay suggested by the benchmark has a similar level of risk as the compensation package being considered for the executive.
Although benchmarking presumably enables a company to remain competitive regarding the level of compensation, it has some obvious drawbacks. First, compensation levels might become inflated over time as companies increase pay to match amounts paid by peers. When multiple companies within a group try to meet or exceed the median, the median itself tends to increase, creating the well-known ratcheting effect. Second, benchmarking determines pay without explicit regard to value creation. This might encourage executives to engage in uneconomic behavior, such as acquiring a competitor purely to increase the size of the overall organization, resulting in a shift in the perceived peer group and, therefore, the CEO’s own pay. Third, benchmarking can lead to very different pay packages, depending on the specific companies included in the peer group.
According to Equilar, the median peer group includes 16 companies. Companies tend to select peers with revenues larger than their own. Nearly two-thirds (64 percent) of companies had revenue at or below the median of their group.25 Because compensation levels are correlated with size of the organization, selecting peers with larger revenues tends to increase the pay packages of senior executives.
Researchers have studied whether peer groups are selectively designed to extract excess pay. The results of these studies are mixed. Bizjak, Lemmon, and Naveen (2008) concluded that peer-group selection is a “practical and efficient mechanism” to determine the market wage for executives and that it is not indicative of manipulation for personal gain.26 However, Faulkender and Yang (2010) found that companies include unrelated firms in the peer group and that the inclusion of these firms increases pay.27 Therefore, the process of peer group selection is under considerable scrutiny by securities regulators and shareholder activists (see the following sidebar).
Benchmarking Compensation at Kroger and Safeway

Source: The Kroger Company, Form DEF 14A, filed with the Securities and Exchange Commission May 14, 2013; Safeway, Inc., Form DEF 14A, filed with the Securities and Exchange Commission April 1, 2013.
Table 8.1 Kroger and Safeway, Comparative Statistics
Compensation Consultants
Another area of popular concern is the use of third-party consultants to assist in the process of setting compensation. In 2014, the most frequently used consulting firms were Frederic W. Cook (16 percent), Pearl Meyer (11 percent), Towers Watson (9 percent), Meridian (8 percent), and Compensia (7 percent).29 At 74 percent of companies, the board of directors selects which firm to use, and at 7 percent of companies, management makes this selection; 20 percent of firms do not disclose this information in the annual proxy.30
Critics claim that a conflict of interest arises when the consulting firm used to structure the CEO compensation package is also used for other corporate services, such as designing benefits plans or managing pension assets. They allege that such consultants are less likely to recommend lower pay, for fear of losing contracts for the other services they provide to the company.31 Although conflicts of interest should be a source of concern, most academic evidence suggests that compensation consultants who provide other services do not allow conflicts of interest to influence their determination of executive pay levels (see the following sidebar).
Conyon, Peck, and Sadler (2009) and Cadman, Carter, and Hillegeist (2010) found that total CEO pay is higher than predicted by economic determinants among companies that use compensation consultants, but they found no evidence that the higher pay is associated with governance quality. Murphy and Sandino (2010) examined CEO pay levels in a sample of companies that have all used compensation consultants. They found that CEO pay increases with the level of “influence” that the CEO has over the board, with influence measured by whether the CEO is also chairman and whether the CEO has appointed a high percentage of directors to the board. Similarly, Chu, Faasse, and Rau (2014) found that compensation consultants retained solely by the board of directors are associated with lower pay than compensation consultants hired by management.32
A study by Armstrong, Ittner, and Larcker (2012) found that CEO pay is determined by the quality of governance at the firm and not by the use of a compensation consultant. Companies with weaker governance are more likely to both use compensation consultants and grant higher pay levels. Armstrong et al. concluded that the difference in pay levels is driven by governance differences of the firms, not by the use of a consultant. Moreover, the authors found that pay levels do not vary between companies that retain specialized compensation consultants (who provide only compensation services) and those that use general human resources consultants (who offer a broad array of services). This finding raises some doubt about the belief that conflicts of interest facilitate excess pay levels.33
Compensation Levels
Based on a sample of 4,000 publicly traded U.S. companies, the median CEO receives expected total annual compensation of about $2.9 million. Among the largest companies, total compensation is $13.7 million.35 Total compensation includes salary, cash bonuses, the fair value of equity-based incentives, pensions, benefits, and perquisites (see Table 8.2). Note that the table includes median rather than mean average figures. Mean averages are influenced by a relatively small number of “outliers,” and for this reason, median average is a better descriptor of general compensation levels. It represents the amount awarded at a typical company.
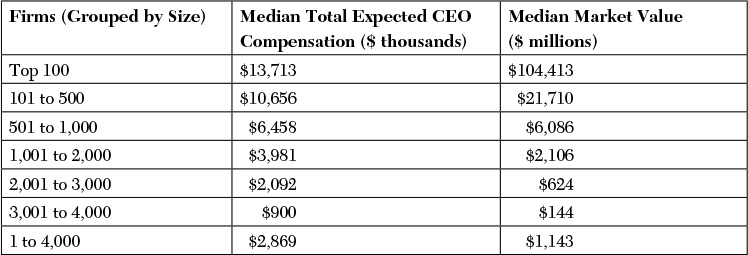
Total compensation includes salary, annual bonus, other bonus, expected value of stock options, performance plans, restricted stock grants, pensions, benefits, and perquisites. In calculating stock option fair value, remaining terms are reduced by 30 percent to adjust for potential early exercise or termination. Market value is the value of common shares outstanding at fiscal year end.
Source: Equilar, proprietary compensation and equity ownership data for fiscal years from June 2013 to May 2014.
Table 8.2 Compensation Paid to CEOs in the United States
Note also that the calculation for compensation reflects the expected fair value of compensation awarded during the year. It does not reflect the value executives realized during that year. This is an important distinction. The fair value awarded is the value of compensation that the committee intends to pay to the executive in a given year. It measures equity-based incentives according to their expected value, with restricted stock valued at current market prices and stock options valued using an approved valuation method (either Black–Scholes or the binomial pricing model). The actual compensation that the executive receives when he or she ultimately sells the stock or exercises the options will likely be very different from the expected value. Realized compensation is a potentially problematic measure because it often reflects the combined value of stock and options granted during multiple years but exercised in a single year (see the following sidebar).
What Is the “Right” Measure of Pay?
• Expected compensation represents the expected value of compensation promised to an executive in a given year. This includes the sum value of the salary, annual bonus, long-term cash plan, stock option awards, and restricted stock awards in the year they are granted. Because some of these elements are contingent on future outcomes (such as operating performance or stock price), their expected value must be estimated. The accuracy of these estimates will vary depending on the type of compensation award that is offered.
• Earned (realizable) compensation represents the total value of compensation that an executive “earns the right to keep” as cash is delivered and vesting restrictions are removed. In most cases, the total compensation earned in a year includes compensation elements that were awarded in the current year and other elements that were awarded in previous years—such as long-term equity awards and performance units. That is, some of the money that an executive “earns” today is money that was promised long ago.
• Realized compensation represents the total value of compensation that an executive takes home as cash in a given year. For equity awards, the realized value is the amount of cash received when the executive ultimately sells shares or exercises and sells stock options. Like earned compensation, realized compensation often comprises pay elements awarded over multiple years, and the realized amount is a function of firm performance over this period.
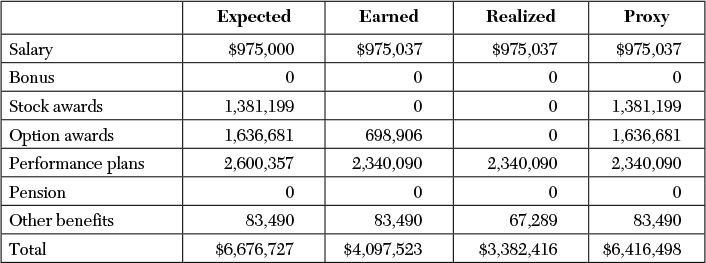
Source: Larcker, McCall, and Tayan (2011).
Table 8.3 Compensation of Harley-Davidson CEO Keith Wandell, 2010
Company size (along with industrial sector) is a major determinant of executive compensation levels. Gabaix and Landier (2008) found that an increase in company size can almost entirely explain the increase in executive compensation in recent years. For example, they found that although CEO pay increased sixfold between 1980 and 2003, the market value of the companies they managed also increased sixfold during this period. They concluded that “the rise in CEO compensation is a simple mirror of the rise in the value of large U.S. companies since the 1980s.”38 Of course, demonstrating the correlation between compensation growth and company growth does not indicate that the compensation levels themselves are appropriate.
In a related study, Kaplan and Rauh (2010) found that the growth in executive compensation is largely consistent with the growth in compensation for other highly paid professionals, such as hedge fund managers, private equity managers, venture capitalists, lawyers, and professional athletes. The authors calculated that pay among these groups all grew by roughly the same order of magnitude during 1994–2005. They concluded that CEO compensation has increased because of market forces that contribute to general wage inflation among highly paid professionals and that extreme compensation growth is not limited to the business world.39
However, examples exist of individual companies that pay their CEOs more than the normalized level that might be expected, given their size and performance. Research suggests that weak governance systems are correlated with excessive compensation. Core, Holthausen, and Larcker (1999) found an inverse relationship between the quality of oversight that a board provides and the level of compensation within the firm.40 They also found that companies that award inflated compensation tend to underperform their peers in terms of subsequent operating performance and stock price returns. They concluded that “firms with weaker governance structures have greater compensation and that firms with greater agency problems perform worse.” That is, governance quality clearly has an impact on executive compensation levels.
Ratio of CEO Pay to Other Top Executive Pay
Critics of executive compensation levels point to two statistics to support their position. One is the large differential between the pay granted to the CEO and the pay granted to other senior executives (see the following sidebar). The other is the large differential between CEO pay and average employee pay.
Table 8.4 shows that the typical CEO of a publicly traded U.S. corporation earns roughly 1.8 times the total compensation of the second-highest-paid NEO.44 The second- highest-paid NEO earns roughly 1.2 times as much as the third-highest-paid NEO. These figures do not vary considerably by company size.
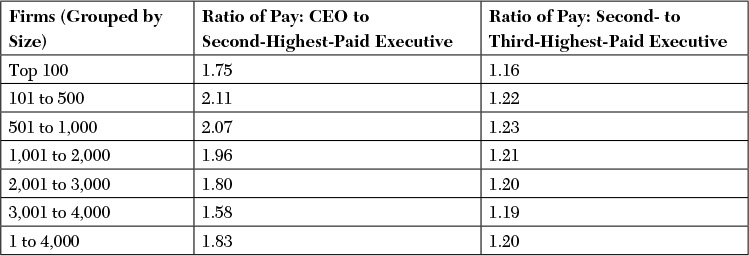
Based on median total compensation.
Source: Equilar, proprietary compensation and equity ownership data for fiscal years from June 2013 to May 2014.
Table 8.4 The Ratio of Pay among Senior Executives
Several factors might contribute to pay inequity within the executive suite. From a purely economic standpoint, the relative pay packages might simply reflect the different levels of value creation within the organization. The success of a very complex company might more heavily rely on the efforts of the CEO, so it might be appropriate to have a greater pay differential to attract a qualified leader.
Furthermore, large pay differentials might also reflect competitive dynamics within the organization. This explanation, known as tournament theory, was proposed by Lazear and Rosen (1981), who pointed out that senior executives not only serve a current operating function but also compete in a tournament for promotion.45 According to the authors, pay inequity serves as an incentive for executives to compete more aggressively for promotion. If they are successful, they receive a large payoff in terms of compensation. As a result, the executive’s current salary is not his or her only incentive to perform. The potential for promotion is itself an incentive, and the value of this incentive is reinforced by a large pay differential between the current and potential positions.
However, pay inequity might indeed signal real problems within the company. Large pay differentials might indicate management entrenchment (the ability of management to shield itself from market forces and pressures to perform from the board, shareholders, and stakeholders).46 In this way, large differentials might indicate that the CEO is able to engage in rent extraction, which the corporate governance system has not adequately controlled against. Pay inequity might also be a source of discouragement for executives who believe they are not fairly compensated. If this is the case, talented senior executives might become unmotivated, which leads to higher turnover, reduced productivity, and a decrease in shareholder value. Finally, pay inequity might reflect a lack of talent development within the organization. That is, the NEOs of the company might simply receive low compensation because they have lower talent levels. If this is the case, the company might be at greater risk of a failed transition because it lacks a viable successor when the current CEO eventually steps down.
Research evidence on pay inequity is mixed. Kale, Reis, and Venkateswaran (2009) found that tournament incentives are positively correlated with firm performance, measured in terms of operating returns and market-to-book values.47 Bebchuk, Cremers, and Peyer (2011), however, found that pay inequity at the senior level is associated with lower firm value and greater risk of agency problems.48 Kini and Williams (2012) found that tournament incentives are positively associated with firm risk, measured in terms of leverage, operating focus, and reliance on research and development expenditures. They concluded that “while the design of a promotion-based incentive system can be employed to induce senior executives to expend greater effort, it can also be used to shape the amount of risk taken by them.”49
To reduce the potential for negative effects due to internal pay inequity, some companies place limits on the ratio of CEO compensation to compensation of named executive officers. For example, healthcare information technology company Cerner Corporation limits the cash compensation of the CEO to no more than three times that of the second-highest-paid NEO. The board must approve exceptions to this policy in advance.50 DuPont has also instituted “pay equity multiples” that limit total annual compensation of the CEO relative to that of the other NEOs. CEO cash compensation is limited to between two and three times the cash compensation paid to the other NEOs, and total compensation (which includes long-term incentives) is limited to between three and four times.51
Ratio of CEO Pay to Average Employee Pay
Critics of executive compensation also point to the large differential between the compensation paid to the CEO and the average employee. According to one critic: “If the CEO is going to be paid more than 100 times the average worker, we want to know why. . . . We are trying to get at the notion of economic injustice in what the CEO is making compared to the average worker. It’s bad for the long-term performance of a company because it breaches the trust between top management and people who work for them.”52 The Dodd–Frank Act requires companies to disclose the ratio of CEO pay to average employee pay in the annual proxy.
Because of delays implementing the rule, broad descriptive statistics are not available. However, recent estimates have pegged this ratio between 200 times to 500 times.53 Differences in methodology and sample selection contribute to the disparity. Results vary depending on whether the researcher uses mean or median compensation figures; mean averages can skew results by overweighting outliers. Results also vary depending on whether the researcher uses expected or realized pay; realized compensation can overstate CEO pay in a given year if it includes grants awarded in multiple years but exercised in a single year. The ratio is also influenced by a company’s industry, size, location, workforce composition, and measurement period.
For example, Crawford, Nelson, and Rountree (2014) calculated the CEO-to-employee pay ratio among commercial banks using a sample of 10,581 firm-year observations between 1995 and 2012. They found the mean (median) ratio to be 16.6 (8.4) times. At the 90th percentile, the pay ratio was still only 32.8 times. Only at the largest observation did the ratio rise to 821 times.54
Still, some companies worry that internal pay inequities can be harmful to the corporation and therefore seek to limit CEO pay. For example, Whole Foods limits the cash compensation of any employee (including the CEO) to no more than 19 times the average annual wage of all full-time employees. The company explains that its compensation programs “reflect our philosophy of egalitarianism.”55
Compensation Mix
In addition to determining the level of compensation, the compensation committee must decide how to structure the compensation package to ensure that it provides incentives that are in line with the company’s objectives. Ultimately, this is done by arriving at a mix of cash, equity, and other benefits with appropriate performance targets to attract, retain, and motivate qualified executive officers, across both short-term and long-term horizons.
Table 8.5 shows that the average company pays roughly 29 percent of the CEO’s compensation in the form of salary, 20 percent in bonus, 14 percent in stock options, 32 percent in restricted stock and long-term performance plans, and 6 percent in pension and benefits. One interesting statistic is that smaller companies appear to reduce bonuses and performance-based compensation in their compensation and increase the proportion from salary. This might be driven by personal consumption (that is, because the compensation packages are smaller, the executives need a higher mix of cash to support their living expenses).
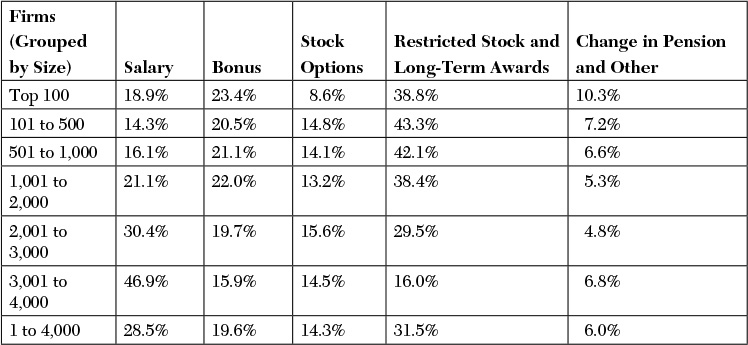
Source: Equilar, proprietary compensation and equity ownership data information for fiscal years from June 2013 to May 2014.
Table 8.5 Mix of Compensation Paid to CEOs in the United States
How appropriate are these compensation mixes? Do they encourage behaviors that appropriately balance risk and reward in pursuit of the corporate strategy? When should the board think about using a different mix of compensation?
Short-Term Incentives
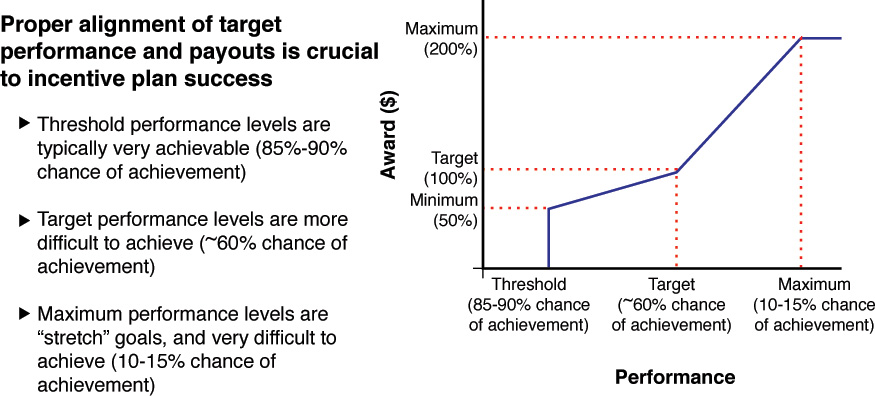
Short-term incentives offer an annual payment (usually cash) for achieving predetermined performance objectives. The size of the bonus is expressed in terms of a target award. Most companies define the size of the target award as a percentage of the base salary (for example, the target award might be equal to 200 percent of the base salary). The actual payment that the executive receives might be limited by upper and lower bounds, in which case a minimum award and a maximum award are established. (The minimum award might be equal to 50 percent of the target and the maximum award equal to 200 percent of the target.) As a result, the executive stands to receive a cash payment with a payoff that increases in a stepwise function, with bounded upper and lower limits (see Figure 8.1.)
Source: Michael Benkowitz, Mark A. Borges, and Thomas G. Brown, “Mastering Performance-Based Equity: New Frontiers in Executive Pay,” Compensia, Inc. (2008). Accessed May 5, 2015. Available at: http://www.compensia.com/events/breakfastbriefingpres_111208.pdf.
Figure 8.1 Minimum, target, and maximum awards for typical short-term bonus plans.
The bonus payment is awarded if certain performance criteria are achieved during the year. The compensation committee determines the performance criteria. As discussed in Chapter 6, “Strategy, Performance Measurement, and Risk Management,” one way to select the measures used to award compensation is to use those that were identified during the business modeling process as being correlated with success in the corporate strategy. In general, these include a mix of accounting measures (such as economic value added, earnings-per-share growth, and return on assets), stock market measures (such as total shareholder return), and nonfinancial measures (such as customer satisfaction, product defect rates, and market share). As such, bonus plans provide executives with an explicit monetary incentive to improve the short-term performance of the firm by achieving operating targets that are known to be correlated with increased shareholder value (see the next sidebar).
One potential concern with bonus plans is that annual performance targets might not be very difficult to achieve. According to a 2005 proprietary survey by a major compensation consulting firm, on average, companies pay bonuses equal to 103 percent of the target level. Only 20 percent of executives receive a bonus less than 75 percent of target levels. That is, bonus plans do not appear to be based on “stretch” goals. Research studies arrive at similar conclusions. Merchant and Manzoni (1989) found that internal budget targets used to award performance bonuses are met 80 percent to 90 percent of the time.56 Indjejikian, Lenk, and Nanda (2000) found that performance targets are achieved 60 percent of the time.57 As such, it is not clear that average performance hurdles are difficult to achieve or encourage above-average performance. It is important for the board to assess whether the performance targets are sufficiently difficult to attain so that what is termed a “performance-based” bonus is not actually some type of “disguised fixed salary.”
In addition, bonus plans have the potential to produce a variety of undesirable executive behaviors. For example, the annual nature of bonus plans can give rise to excessive focus on short-term accounting results at the expense of long-term value creation. One example is delaying the investment in important projects with positive net present value to improve current-period net income. This is of special concern when an executive is in the final few years with the company and is therefore unlikely to see the economic benefit of a long-term investment in his or her annual bonus.58
Similarly, the practice of bounding annual bonus plans with a stated maximum can also encourage inappropriate behavior. Healy (1985) and Holthausen, Larcker, and Sloan (1995) found that executives are more likely to manipulate earnings downward after they have achieved their maximum bonus payment.59 They do so to defer corporate earnings to a later period because they no longer contribute toward their current bonus.
Finally, it is plausible that bonus plans can provide incentives for managers to manipulate accounting results to achieve targets that they would otherwise miss. (We discuss this topic in greater detail in Chapter 9.)
These are all real concerns for the board of directors to consider, given the important role that the bonus plays in the overall compensation package. Fortunately, compensation committees also grant a variety of long-term compensation awards that can mitigate these potential problems.
Long-Term Incentives
Long-term incentives are added to the compensation mix to encourage executives to select long-term investments that increase shareholder value. Long-term incentives extend the time horizon of the executive and mitigate the natural tendency of a risk-averse executive to reject risky investments. In Table 8.5, we saw that the value of long-term awards (in the form of stock options, equity, and performance plans) is equal in size to the value of short-term awards—46 percent versus 48 percent at the average company. As such, long-term incentives can help mitigate short-term gamesmanship by refocusing the emphasis on long-term performance.61
For example, as executives approach retirement, they might be expected to reduce a company’s investment in research and development to hit earnings targets that increase their own annual bonus. Because the annual bonus (along with salary) is a key input in calculating their pension benefits, the CEO will benefit by receiving larger annual payments throughout retirement. This is part of the reason firms put “hold until or past retirement” features in stock option and restricted stock programs. That way, if the CEO rejects valuable research and development to boost the value of his or her pension, the executive will, in theory, be punished through a corresponding loss in the eventual value of options and shares owned.
Stock options are an important compensation element that many companies use to create this longer-term horizon for value creation. Options have several desirable features that can help align the interests of executives with those of shareholders. First, options increase in value as the stock price increases. This motivates executives to add corporate value by identifying and implementing investments with positive net present value (NPV). Second, options increase in value with stock-price volatility. This motivates executives to accept risky, positive NPV investments that might otherwise be rejected if the compensation program were instead mostly fixed salary or short-term incentives. Third, because of vesting requirements, options have deferred payoffs that encourage a focus on long-term results. As such, stock options tend to be used in companies where there are substantial investment opportunities that are associated with considerable risk. Stock options will attract highly skilled executives with moderate risk tolerance who want to share in the value created by their work. Whether the company wants this type of employee depends on the firm’s strategy. A firm operating in a stable and predictable environment might use more fixed salary and annual bonus compensation, but a company in a highly dynamic and risky industry might place greater emphasis on long-term equity-based compensation.
On the other hand, stock options can offer capricious financial rewards to executives when broad market factors cause changes in stock price that are not the result of the executive’s individual effort. During much of the 1990s, a rising market tended to reward most executives who received options, regardless of the firm’s operating performance. Conversely, most stock options granted in the late 1990s expired with zero value because of significant market declines, even in cases when some sort of payout was merited based on relative performance. This concern has motivated some companies to replace stock options with restricted stock grants and long-term performance awards.
Some evidence suggests that stock options encourage the investment in new, risky projects. (Risky projects are desirable to shareholders when they are consistent with the strategy and business model of the organization and when such investments have expected positive net present value. They are negative when they are inconsistent with the company’s business model or are unlikely to bring rewards that compensate for the associated risk.) Rajgopal and Shevlin (2002) found that stock options are an effective tool to encourage risk-averse managers to invest in higher-risk, higher-return investments. Executives understand that the expected value of a stock option increases with the volatility of the stock price, and they tend to respond to stock option awards by investing in riskier projects to create this volatility.62 Sanders and Hambrick (2007) found that executives who receive stock options are more likely to increase investment in risky research and development, capital expenditures, and acquisitions. In addition, total shareholder returns at these companies are more likely to be extreme in their outcomes (extremely positive or extremely negative). Unfortunately, the authors found that results are more likely to be extremely negative than extremely positive. They concluded that “high levels of stock options appear to motivate CEOs to take big risks . . . to ‘swing for the fences.’”63 The issue of whether stock options might be related to excessive risk taking is an important consideration that we will consider in greater detail in Chapter 9.
Another tool that companies use is performance awards. Performance awards tie the value of long-term compensation to the achievement of predetermined goals or performance metrics. In recent years, performance awards have come to be a significant portion of the compensation mix. Along with restricted stock, performance awards represent 32 percent of a typical company’s CEO compensation program.
de Angelis and Grinstein (2014) examined the use of performance awards among S&P 500 companies. They found that all companies that grant performance awards use at least one accounting-based metric; market-based measures are used less frequently—30 percent of the time; 40 percent of firms use nonfinancial performance measures. Among accounting measures, 87 percent are income based (for example, earnings per share or net income growth), 39 percent are based on revenue, 37 percent on return metrics (for example, return on equity or assets), 23 percent on cash flow, 9 percent on margin, 6 percent on cost reduction targets, and 5 percent on economic value added (EVA). More than half of the sample used between two and four different measures. The weighted-average performance horizon taking into account both short-term and long-term performance awards was slightly less than two years. In addition, the authors found that the size of discretionary bonuses (not tied to predetermined targets) was not correlated with performance awards and concluded that these bonuses were granted for reasons other than performance (such as retention purposes).64
Benefits and Perquisites
The CEO compensation package generally includes a mix of benefits, perquisites, and other contingent payments. The value of these awards is not negligible. On average, they constitute 6 percent of the total compensation (see Table 8.5). In some of the more extreme cases cited at the beginning of this chapter, they can ultimately prove to be quite valuable.
The research evidence on the incentive value of these payments is quite mixed. Rajan and Wulf (2006) found that companies consistently use perks as a means to improve executive productivity. They found that perks such as use of aircraft and chauffeur drivers are predominantly awarded to executives who stand to benefit the most from free time.65 Sundaram and Yermack (2007) argued that defined benefit pension plans (which are a fixed claim on the firm similar to salary) can be seen as a risk-reducing form of compensation that offsets the risk-seeking incentives of equity compensation.66
However, other researchers argue that these perquisites and benefits are a form of “stealth compensation” that enriches executives at the cost of shareholders. As such, they can be seen as the very agency costs that corporate governance systems are meant to preclude. To this end, Yermack (2006) found that shareholders react negatively to disclosure that an executive is allowed personal use of company aircraft.67 Grinstein, Weinbaum, and Yehuda (2010) found that the reported value of perquisites increased by 190 percent following enhanced SEC disclosure rules in 2006. They also found that the reduction in shareholder value following the disclosure significantly exceeded the actual value of the perquisites, indicating that shareholders saw them as value destroying. They concluded that perquisite disclosure “conveys a more fundamental negative signal about the agency conflicts in these firms.”68 Perquisites might not be an especially large dollar amount relative to the market capitalization of the firm, but they might provide a window into the workings of the board and governance quality of the firm.
Compensation Disclosure
As the preceding discussion suggests, the typical executive compensation program is quite complicated. In recent years, the SEC has taken steps to improve the quality of information disclosed to investors in the annual proxy. The most significant of these is the inclusion of a Compensation Discussion & Analysis (CD&A) section that explains in detail the company’s compensation philosophy, the elements of the compensation program, the total compensation offered, performance metrics used to award variable pay, and other details of the company’s compensation program. The SEC intended the CD&A to provide a “plain English” discussion of these items.
Subsequent research, however, suggests that companies have considerable room to improve the clarity of disclosure about executive pay. Beucler and Dolmat-Connell (2007) found that the median disclosure length is nearly five times longer than the SEC envisioned (4,726 words versus an expectation of 1,000). They concluded that current disclosure is not very accessible to the average investor.69
Survey data also finds that institutional investors are dissatisfied with the quality of information they receive about executive compensation in the annual proxy. According to a study by RR Donnelley, Equilar, and the Rock Center for Corporate Governance at Stanford University (2015) fewer than half (38 percent) of institutional investors believe that executive compensation is clearly and effectively disclosed in the proxy. Responses are consistently negative across all elements of compensation disclosure. Sixty-five percent say that the relation between compensation and risk is “not at all” clear. Forty-eight percent say that it is “not at all” clear that the size of compensation is appropriate. Forty-three percent believe that it is “not at all” clear whether performance-based compensation plans are based on rigorous goals. Significant minorities cannot determine whether the structure of executive compensation is appropriate (39 percent), cannot understand the relation between compensation and performance (25 percent), and cannot determine whether compensation is well aligned with shareholder interests (22 percent). Investors also express considerable dissatisfaction with the disclosure of potential payouts to executives under long-term performance plans.70
The fundamental complaint about proxies is rooted in a perception that companies are not communicating candidly with owners. Shareholders want corporations to explain information rather than disclose it (see the following sidebar). Investors view corporations as using the proxy as a vehicle to meet disclosure obligations without a willingness to provide information in a format that is clear and understandable to a typical—or even sophisticated—owner.
Say-on-Pay
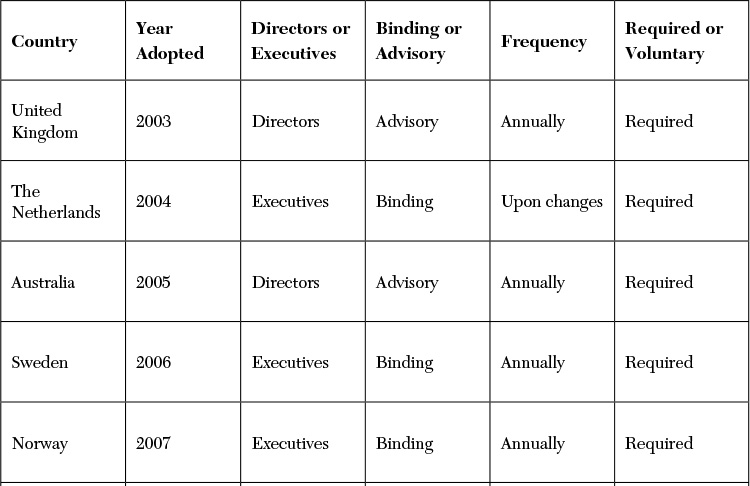
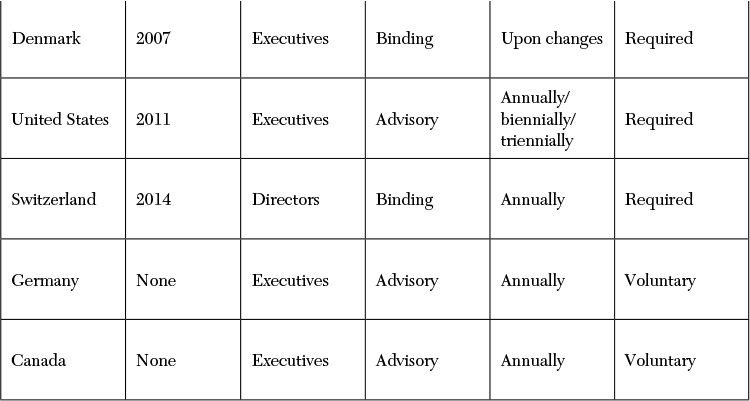
Say-on-pay is the practice of granting shareholders the right to vote on a company’s executive or director compensation program at the annual shareholder meeting. Say-on-pay is a relatively recent phenomenon, having first been required by the United Kingdom in 2003 and subsequently adopted in countries including the Netherlands, Australia, Sweden, and Norway. The use and terms of say-on-pay vary across nations (see Table 8.6)
Note: Because the CEO usually serves on the board of directors, a “say-on-pay” vote on director compensation implicitly expresses shareholder opinion on CEO pay as well as director pay.
Source: Authors.
Table 8.6 Say-on-Pay around the World
The U.S. adopted say-on-pay in 2011, pursuant to the Dodd–Frank Act. Under Dodd–Frank, companies are required to hold an advisory (nonbinding) vote on compensation at least once every three years. At least once every six years, companies are required to ask shareholders to determine the frequency of future say-on-pay votes (with the options being every one, two, or three years but no less frequently). Advocates of say-on-pay contend that the practice of submitting executive compensation for shareholder approval increases the accountability of corporate directors to shareholders and leads to more efficient contracting, with rewards more closely aligned with corporate objectives and performance.
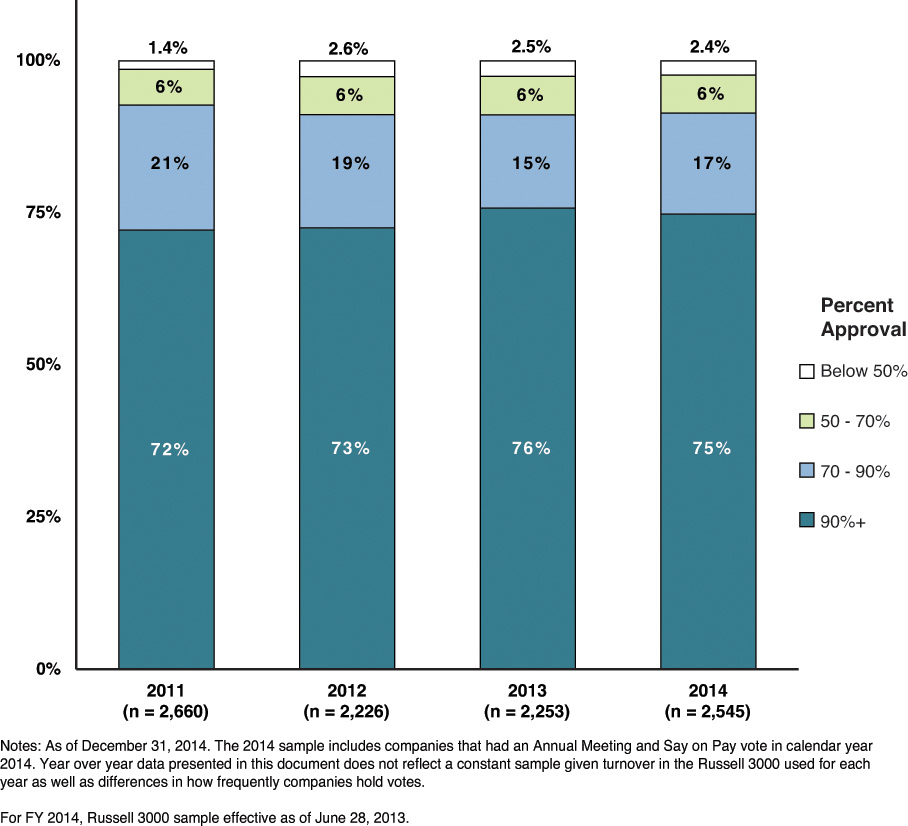
Despite anticipation that shareholders would take advantage of their right to vote on executive compensation to register dissatisfaction with pay levels, voting results have not conformed to this expectation. Among approximately 2,700 public companies that put their executive compensation plans before shareholders for a vote in 2011, only 37 (1.4 percent) failed to receive majority approval. Support levels across all companies averaged 90 percent. Results in 2014 were little changed: Only 60 out of approximately 2,600 companies (2.4 percent) did not receive majority approval, and the average support level across all companies was 91 percent (see Figure 8.2).73 Say-on-pay voting results have held steady despite the fact that average compensation levels continue to rise. According to Equilar, median CEO compensation rose by 25 percent between 2010 and 2013.74
Research provides mixed evidence on whether say-on-pay leads to improved compensation practices. Ertimur, Ferri, and Muslu (2011) examined the impact of “vote no” campaigns and compensation-related shareholder proposals in the United States. They found that support for shareholder initiatives restricting compensation is higher among companies with above-average CEO pay. Furthermore, they found that vote-no campaigns are associated with a subsequent reduction of $2.3 million in CEO pay—but only when institutional investors initiated the proxy proposal.75 Cai and Walkling (2011) examined shareholder returns following the passage of say-on-pay legislation by the U.S. House of Representatives. They found some evidence that share prices for firms with high excess compensation reacted in a positive manner to the regulatory announcement.76 Ferri and Maber (2013) found that say-on-pay regulation in the United Kingdom had some impact on the level of severance pay awarded to CEOs. It also reduced stock option “retesting,” in which a company extends the time period of a performance-based grant to give the executive more time to meet the performance threshold. These effects began to show up when at least 20 percent of shareholders voted against the plan. However, the authors did not find evidence that say-on-pay reduced overall pay levels in the United Kingdom.77 Larcker, Ormazabal, and Taylor (2011) found evidence that capping or regulating executive pay results in less efficient contracts and negatively affects shareholder wealth in firms that are likely to be affected.78
Shareholders, too, express skepticism that say-on-pay leads to improved compensation. According to the survey cited in the previous section, only 58 percent of institutional investors believe that say-on-pay is effective in influencing or modifying pay.79
Finally, proxy advisory firms, including ISS and Glass Lewis, have considerable influence over say-on-pay voting. Their ability to sway voting outcomes influences corporate decisions on CEO pay levels and design. We discuss this in greater detail in Chapter 12, “Institutional Shareholders and Activist Investors.”
Endnotes
1. Exceptions do exist in which CEOs work for no pay, as a result of either public pressure or moral duty, but they are obviously rare. See Moira Herbst, “The Elite Circle of $1 CEOs: Apple’s Steve Jobs and Google’s Eric Schmidt Are Just Two of the CEOs Who Work for a Buck. Why Do Top Executives Give Up Their Salaries?” Business Week Online (May 10, 2007). Accessed June 27, 2014. See http://www.businessweek.com/stories/2007-05-10/the-elite-circle-of-1-ceosbusinessweek-business-news-stock-market-and-financial-advice.
2. A 2007 report prepared by Congressman Waxman (California) asserted that compensation consultants were a cause of excessive CEO compensation. However, the analysis did not control for other explanatory factors (such as size of the company). When properly controlled, these associations disappear. As a result, the causality attributed in this report was misleading, at the very least. See Henry A Waxman, et al., “Executive Pay: Conflicts of Interest among Compensation Consultants,” U.S. House of Representatives Committee on Oversight and Government Reform (December 2007). Separately, Core, Guay, and Larcker (2008) found that while the media places a lot of attention on executive compensation, it actually has relatively little influence in affecting compensation levels. See John E. Core, Wayne Guay, and David F. Larcker, “The Power of the Pen and Executive Compensation,” Journal of Financial Economics 88 (2008): 1–25.
3. See Harwell Wells, “No Man Can Be Worth $1,000,000 a Year: The Fight over Executive Compensation in 1930s America,” University of Richmond Law Review 44 (January 2010): 689.
4. Carola Frydman and Raven E. Saks, “Executive Compensation: A New View from a Long-Term Perspective, 1936–2005,” Review of Financial Studies 23 (2010): 2099–2138.
5. Amanda Bennett, “Executives Face Change in Awarding Pay, Stock Options: More Managers Find Salary, Bonus Are Tied Directly to Performance,” Wall Street Journal (February 28, 1986, Eastern edition): 1.
6. Anonymous, “Highest Paid CEOs,” USA Today (May 17, 1988). Last accessed November 10, 2010. See http://infoweb.newsbank.com/iw-search/we/InfoWeb.
7. Measured in terms of the amount realized through stock option exercises and the value of unexercised in-the-money options. See Standard & Poor’s ExecuComp data, cited in Mark Maremont and Charles Forelle, “Open Spigot: Bosses’ Pay: How Stock Options Became Part of the Problem; Once Seen as a Reform, They Grew into Font of Riches and System to Be Gamed; Reload, Reprice, Backdate,” Wall Street Journal (December 27, 2006, Eastern edition): A.1.
8. David F. Larcker and Brian Tayan, “Executive Compensation at Nabors Industries: Too Much, Too Little, or Just Right?” Stanford GSB Case No. CG-5 (February 2, 2007).
9. JPMorgan Chase and American Express, Form DEF 14A, filed with the Securities and Exchange Commission during 2008 and 2011.
10. Lucian A. Bebchuk and Jesse M. Fried, “Pay without Performance: Overview of the Issues,” Academy of Management Perspectives 20 (2006): 5–24. Lucian A. Bebchuk and Jesse M. Fried, Pay without Performance: The Unfulfilled Promise of Executive Compensation (Cambridge, Mass.: Harvard University Press, 2006).
11. For examples of each of these, see Equilar, Inc., “CD&A Overview: An Examples-Based Review of Key CD&A Elements” (2009). Accessed June 23, 2009. See www.equilar.com.
12. When reading this section, it is useful to consider whether all the different components of compensation are really necessary. For a comparison of compensation packages paid today against those of 50 years ago, see David F. Larcker and Brian Tayan, “A Historical Look at Compensation and Disclosure,” Stanford Closer Look Series (June 15, 2010). Accessed May 5, 2015. See http://www.gsb.stanford.edu/faculty-research/centers-initiatives/cgri/research/closer-look.
13. For an excellent analysis regarding the role of discretion, see Madhav V. Rajan and Stefan Reichelstein, “Subjective Performance Indicators and Discretionary Bonus Pools,” Journal of Accounting Research 44 (2006): 585–618. See also Christopher D. Ittner, David F. Larcker, and Marshall W. Meyer, “Subjectivity and the Weighting of Performance Measures: Evidence from a Balanced Scorecard,” Accounting Review 78 (2003): 725–758.
14. U.S. Securities and Exchange Commission (SEC), Division of Corporate Finance, “Current Report on Form 8-K: Frequently Asked Questions” (November 23, 2004): Question 12. Accessed May 5, 2015. See https://www.sec.gov/divisions/corpfin/form8kfaq.htm.
15. Equilar Inc., “CEO Pay Strategies Report” (2014). Accessed February 18, 2015. See www.equilar.com.
16. Equilar Inc., “Executive Stock Ownership Guidelines Report,” Equilar (2013). Accessed February 18, 2015. See www.equilar.com.
17. Sarbanes–Oxley Act of 2002 §304, 15 U.S.C. § 7243 (2006).
18. Equilar Inc., “Clawback Policy Report” (2013). Accessed February 18, 2015. See www.equilar.com.
19. Exxon Mobil Corp., form DEF 14A, filed with the Securities and Exchange Commission April 11, 2014.
20. Citigroup, Inc., Form DEF 14A, filed with the Securities and Exchange Commission March 18, 2014.
21. McKesson, Inc., Form DEF 14A, filed with the Securities and Exchange Commission June 19, 2014.
22. Apple Inc., Form DEF 14A, filed with the Securities and Exchange Commission January 22, 2015.
23. Mai Iskandar-Datta and Yonghong Jia, “Valuation Consequences of Clawback Provisions,” Accounting Review 88 (2013): 171–198.
24. Lilian H. Chan, Kevin C.W. Chen, Tai-Yuan Chen, and Yangxin Yu, “The Effects of Firm-Initiated Clawback Provisions on Earnings Quality and Auditor Behavior,” Journal of Accounting and Economics 54 (2012): 180–196.
25. Equilar, Inc., “S&P 1500 Peer Group Report: An Analysis of Peer Groups at S&P 1500 Companies” (2014). Accessed February 18, 2015. See www.equilar.com.
26. John M. Bizjak, Michael L. Lemmon, and Lalitha Naveen, “Does the Use of Peer Groups Contribute to Higher Pay and Less Efficient Compensation?” Journal of Financial Economics 90 (2008): 152–168.
27. Michael Faulkender and Jun Yang, “Inside the Black Box: The Role and Composition of Compensation Peer Groups,” Journal of Financial Economics 96 (2010): 257–270.
28. The Kroger Company, Form DEF 14A, filed with the Securities and Exchange Commission May 14, 2013; Safeway, Inc., Form DEF 14A, filed with the Securities and Exchange Commission April 1, 2013.
29. Equilar, Inc., “Compensation Consultant League Table” (2014). Accessed February 19, 2015. See www.equilar.com.
30. Chris S. Armstrong, Christopher D. Ittner, and David F. Larcker, “Corporate Governance, Compensation Consultants, and CEO Pay Levels,” Review of Accounting Studies 17 (June 2012): 322–351.
31. A similar argument has been made about the same firm providing both audit- and nonaudit-related services to a client. We discuss this in greater detail in Chapter 10, “Financial Reporting and External Audit.”
32. See Martin J. Conyon, Simon I. Peck, and Graham V. Sadler, “Compensation Consultants and Executive Pay: Evidence from the United States and the United Kingdom,” Academy of Management Perspectives (2009): 2343–2355; Brian Cadman, Mary Ellen Carter, and Stephen Hillegeist, “The Incentives of Compensation Consultants and CEO Pay,” Journal of Accounting and Economics 49 (2010): 263–280; Kevin J. Murphy and Tatiana Sandino, “Executive Pay and ‘Independent’ Compensation Consultants,” Journal of Accounting and Economics 49 (2010): 247–262; Jenny Chu, Jonathan Faasse, and P. Raghavendra Rau, “Do Compensation Consultants Enable Higher CEO Pay? New Evidence from Recent Disclosure Rule Changes,” Social Science Research Network (2014). Accessed February 19, 2015. See http://ssrn.com/abstract=2500054.
33. Chris S. Armstrong, Christopher D. Ittner, and David F. Larcker (June 2012).
34. Symantec Corp., Form DEF 14A, filed with the Securities and Exchange Commission September 4, 2014.
35. Equilar, Inc., proprietary compensation and equity ownership data for fiscal years from June 2013 to May 2014.
36. David F. Larcker, Allan McCall, and Brian Tayan, “What Does It Mean for an Executive to Make a Million?” Stanford Closer Look Series (December 14, 2011). Accessed May 5, 2015. See http://www.gsb.stanford.edu/faculty-research/centers-initiatives/cgri/research/closer-look.
37. Equilar Inc., “2015 Innovations in CD&A Design: A Proxy Disclosure Analysis” (2015). Accessed April 16, 2015. See www.equilar.com.
38. Xavier Gabaix and Augustin Landier, “Why Has CEO Pay Increased so Much?” Quarterly Journal of Economics 123 (2008): 49–100.
39. Steven N. Kaplan and Joshua Rauh, “Wall Street and Main Street: What Contributes to the Rise in the Highest Incomes?” Review of Financial Studies 23 (2010): 1004–1050.
40. Companies with weak board oversight are defined as those with dual chairman/CEO, boards with a large number of directors, boards with a large percentage of “gray” directors (directors who are not executives of the company but who have other financial connections to the company or management as a result of serving as a lawyer, banker, consultant, or other provider of services), boards on which a large percentage of outside directors are appointed by the CEO, boards with a large percentage of old directors, and boards with a large percentage of busy directors. See John E. Core, Robert W. Holthausen, and David F. Larcker, “Corporate Governance, Chief Executive Officer Compensation, and Firm Performance,” Journal of Financial Economics 51 (1999): 371–406.
41. Named executive officer (NEO) is an SEC designation that includes the principal executive officer, the principal financial officer, and the three most highly compensated executive officers. See Securities and Exchange Commission, executive compensation and related person disclosure. Section II.C.6. SEC Release 33-8732A § II.C.3.A. Accessed December 9, 2008. See www.sec.gov/rules/final/2006/33-8732a.pdf.
42. The Office of State Treasurer Denise L. Nappier, Press Release, “Nappier Says Four Companies Agree to Connecticut Pension Fund Resolutions, Setting New Standard for Disclosure of Executive Compensation in 2008 Proxies” (April 16, 2008). Last accessed November 11, 2010. See www.state.ct.us/ott/pressreleases/press2008/pr04162008.pdf.
43. Abercrombie & Fitch Form DEF 14A, filed with the Securities and Exchange Commission May 9, 2008.
44. Equilar, Inc., proprietary compensation and equity ownership data for fiscal years from June 2013 to May 2014.
45. Edward P. Lazear and Sherwin Rosen, “Rank-Order Tournaments as Optimum Labor Contracts,” Journal of Political Economy 89 (1981): 841–864.
46. Moody’s reviews CEO compensation as one factor contributing to a company’s credit rating. The rating agency finds that large performance-based compensation packages might be indicative of lax oversight and lead to increased risk taking that ultimately increases the likelihood of corporate default. See Chris Mann, “CEO Compensation and Credit Risk,” Moody’s Investors Service, Global Credit Research Report No. 93592 (2005). Accessed April 7, 2015. See https://www.moodys.com/researchdocumentcontentpage.aspx?docid=pbc_93592.
47. Jayant R. Kale, Ebru Reis, and Anand Venkateswaran, “Rank-Order Tournaments and Incentive Alignment: The Effect on Firm Performance,” Journal of Finance 64 (2009): 1479–1512.
48. Lucian A. Bebchuk, K. J. Martijn Cremers, and Urs C. Peyer, “The CEO Pay Slice,” Journal of Financial Economics 102 (2011): 199–221.
49. Omesh Kini and Ryan Williams, “Tournament Incentives, Firm Risk, and Corporate Policies,” Journal of Financial Economics 103 (2012): 350–376.
50. Cerner Corporation, Form DEF 14A, filed with the Securities and Exchange Commission April 10, 2014.
51. E.I. du Pont de Nemours and Company, Form DEF 14A, filed with the Securities and Exchange Commission March 14, 2014.
52. Gretchen Morgenson, “Explaining (or Not) Why the Boss Is Paid So Much,” New York Times (January 25, 2004): BU.1.
53. See Congressional Research Service, cited in Carol Hymowitz, “Pay Gap Fuels Worker Woes,” Wall Street Journal (April 28, 2008, Eastern edition): B.8. Carola Frydman of Harvard University and Raven Saks of the Federal Reserve, cited in Greg Ip, “Snow Rebuts Critics of Bush’s Economic Record; Treasury Chief Says Many Benefit from Expansion; Some Data Show Otherwise,” Wall Street Journal (March 20, 2006, Eastern edition): A.3. Institute for Policy Studies, cited in Phred Dvorak, “Theory & Practice—Limits on Executive Pay: Easy to Set, Hard to Keep,” Wall Street Journal (April 9, 2007): B.1. Towers Perrin (now Towers Watson), cited in Gretchen Morgenson AFL-CIO, “Executive Paywatch” (2014). Accessed January 21, 2014. See http://www.aflcio.org/corporate-watch/paywatch-2014.
54. Steve Crawford, Karen K. Nelson, and Brian Rountree, “The CEO–Employee Pay Ratio,” Social Science Research Network (2014). Accessed February 23, 2015. See http://ssrn.com/abstract=2529112.
55. Whole Foods, Form DEF 14A, filed with the Securities and Exchange Commission January 10, 2014.
56. Kenneth A. Merchant and Jean-Francois Manzoni, “The Achievability of Budget Targets in Profit Centers: A Field Study,” Accounting Review 64 (1989): 539–558.
57. Raffi J. Indjejikian, Peter Lenk, and Dhananjay Nanda, “Targets, Standards, and Performance Expectations: Evidence from Annual Bonus Plans,” Social Science Research Network (2000). Accessed October 16, 2008. See http://ssrn.com/abstract=213628.
58. Chen, Cheng, Lo, and Wang (2015) found that contractual protections such as employment and severance agreements can counteract managerial tendencies toward short-termism. See Xia Chen, Qiang Cheng, Alvis K. Lo, and Xin Wang, “CEO Contractual Protection and Managerial Short-Termism,” Accounting Review (forthcoming September 2015).
59. Paul M. Healy, “The Effect of Bonus Schemes on Accounting Decisions,” Journal of Accounting and Economics 7 (1985): 85–107. Robert W. Holthausen, David F. Larcker, and Richard G. Sloan, “Annual Bonus Schemes and the Manipulation of Earnings,” Journal of Accounting and Economics 19 (1995): 29–74.
60. Northrop Grumman, Form DEF 14A, filed with the Securities and Exchange Commission April 4, 2014.
61. Long-term performance plans appear to have a positive impact on managerial behavior and firm performance. For example, Larcker (1983) found that managers are likely to increase long-term capital investment following the adoption of a performance plan. He also found positive stock market response to the adoption of these plans, indicating that shareholders believe that they align managerial and shareholder interests. See David F. Larcker, “The Association between Performance Plan Adoption and Corporate Capital Investment,” Journal of Accounting and Economics 6 (1983): 3–29.
62. Shivaram Rajgopal and Terry Shevlin, “Empirical Evidence on the Relationship between Stock Option Compensation and Risk Taking,” Journal of Accounting and Economics 33 (2002): 145–171.
63. W. M. Sanders and Donald C. Hambrick, “Swinging for the Fences: The Effects of CEO Stock Options on Company Risk Taking and Performance,” Academy of Management Journal 50 (2007): 1055–1078.
64. David de Angelis and Yaniv Grinstein, “Performance Terms in CEO Compensation Contracts,” Review of Finance (2014): 1–33.
65. Raghuram G. Rajan and Julie Wulf, “Are Perks Purely Managerial Excess?” Journal of Financial Economics 79 (2006): 1–33.
66. Rangarajan K. Sundaram and David L. Yermack, “Pay Me Later: Inside Debt and Its Role in Managerial Compensation,” Journal of Finance 62 (2007): 1551–1588.
67. David Yermack, “Flights of Fancy: Corporate Jets, CEO Perquisites, and Inferior Shareholder Returns,” Journal of Financial Economics 80 (2006): 211–242.
68. Yaniv Grinstein, David Weinbaum, and Nir Yehuda, “The Economic Consequences of Perk Disclosure,” Johnson School Research Paper, Series No. 04-09, AFA 2011 Denver Meetings Paper, Social Science Research Network (2010). Accessed October 24, 2010. See http://ssrn.com/abstract=1108707.
69. Erik Beucler and Jack Dolmat-Connell, “Pay Disclosure Rules: Has More Become Less?” Corporate Board 28 (2007): 1–5.
70. RR Donnelly, Equilar, and the Rock Center for Corporate Governance at Stanford University, “2015 Investor Survey: Deconstructing Proxies—What Matters to Investors” (2015). Accessed May 5, 2015. See http://www.gsb.stanford.edu/faculty-research/centers-initiatives/cgri/research/surveys.
71. Amgen Inc., Form DEF 14A, filed with the Securities and Exchange Commission April 3, 2014.
72. Amgen, Executive Compensation Survey. Accessed November 11, 2010. See www.amgen.com/executivecompensation/exec_comp_form_survey.jsp.
73. Semler Brossy Consulting Group, LLC., “Year End Say on Pay Report” (2014). Accessed February 24, 2015. See http://www.semlerbrossy.com/sayonpay.
74. Equilar Inc., “CEO Pay Strategies Report” (2014). Accessed February 18, 2015. See www.equilar.com.
75. Yonca Ertimur, Fabrizio Ferri, and Volkan Muslu, “Shareholder Activism and CEO Pay,” Review of Financial Studies 24 (2011): 535–592.
76. Jie Cai and Ralph A. Walkling, “Shareholders’ Say on Pay: Does It Create Value?” Journal of Financial and Quantitative Analysis 46 (2011): 299–339.
77. Fabrizio Ferri and D. Maber, “Say on Pay Votes and CEO Compensation: Evidence from the United Kingdom,” Review of Finance 17 (2013): 527–563.
78. David F. Larcker, Gaizka Ormazabal, and Daniel J. Taylor, “The market reaction to corporate governance regulation,” Journal of Financial Economics 101 (2011): 431–448.
79. RR Donnelly, Equilar, and the Rock Center for Corporate Governance at Stanford University (2015).