
13. Corporate Governance Ratings
Governance ratings is a relatively new industry in which consulting companies develop quantitative metrics to measure the effectiveness of a company’s governance system. The inputs in these models are based on governance attributes that we have discussed throughout this book, including the structure of the board, elements of the executive compensation plan, antitakeover provisions, and other features. Researchers have also developed indices that rely on similar inputs. The question remains whether governance ratings and indices accurately measure governance quality and predict the likelihood of negative outcomes.
In this chapter, we discuss the methodology used to develop governance ratings and evaluate their accuracy. We begin by reviewing the ratings developed by Institutional Shareholder Services and GMI Ratings. We then examine the models of governance quality that have been developed by researchers.
Third-Party Ratings
Ratings by knowledgeable independent third parties are common and can be useful to consumers in assessing the quality of products or services. Ratings are particularly important in markets where consumers do not have complete information about the items they are evaluating or when product or service quality is not easily observable. For example, restaurant customers can rely on Michelin Guide or Zagat ratings to select a restaurant in a new city, auto customers can review J.D. Power and Associates or Consumer Reports rankings to assess customer satisfaction with various models, and prospective undergraduate and graduate students can read the rankings of U.S. News & World Report to determine the prestige of a particular educational institution.
For ratings to be useful, they must provide credible information. Three factors are particularly critical in establishing credibility. First, ratings must be objective, in that they are based on data that an outside observer would similarly evaluate. Second, the ratings provider must be free from conflicts of interest that would compromise the judgment of the provider. Third, the ratings provider must be able to demonstrate the predictive ability of its ratings. That is, the ratings must not simply describe past outcomes but must be correlated with future outcomes of interest to the users. This last point is critical. For example, if a traveler finds that the ratings of Zagat are not consistent with her own experience at the same restaurants, she will cease to rely on them when making decisions about where to eat. The Zagat system then would lose its relevance. Market pressure creates an incentive for Zagat to maintain the integrity of its ratings system.
Ratings are also important not only for their role in shaping consumer behavior but also for their impact on the company whose products and services are being rated. The very presence of J.D. Power in the market puts pressure on car manufacturers to maintain and improve the quality standards of each successive model. Because of their perceived expertise, ratings firms can serve as a disciplining mechanism on product or service providers. Given this position of influence, it is particularly important that the ratings system maintain integrity. The ratings industry can provide important information to consumers and firms that ultimately leads to more efficient decision making and resource allocation.
Credit Ratings
Perhaps the most prominent providers of financial ratings in the marketplace are credit-rating agencies. The largest three credit-rating agencies are Moody’s Investor Services, Standard & Poor’s, and Fitch Ratings. These institutions provide ratings on corporations based on their expected ability to repay debt obligations, or their creditworthiness. Creditworthiness is determined based on a combination of quantitative and qualitative factors, including availability of collateral, leverage ratios, interest coverage, and diversity and stability of revenue streams, among other factors. Institutional investors that invest in corporate debt use credit ratings to determine the likelihood that they will be paid the full principal and interest owed to them over the life of the bond. In some cases, investors such as money market funds are only allowed to invest in debt with a sufficiently high rating. Companies with higher credit ratings are generally rewarded in the market with lower interest rates on their borrowings, while companies with lower credit ratings are generally charged higher interest rates in an effort to compensate for the inherent risk.
The relative success of the credit rating system can be demonstrated by its predictive ability over time. For example, Moody’s keeps detailed statistics on default frequency by ratings category. Through this data, the company can demonstrate that higher-rated institutions have a lower likelihood of default than lower-rated institutions. For example, corporations that received Moody’s highest rating (Aaa) between 1970 and 2013 defaulted at a rate of 0.1 percent over the 10 years following the receipt of that rating. By contrast, corporations that received a speculative-grade rating (Ba or lower) defaulted on their debt obligations 33 percent of the time during the 10 years following that rating.1 As a result, Moody’s can point to historical correlations, supported by a deep sample of data, to demonstrate that its corporate credit ratings are predictive in nature (see Figure 13.1).

Source: Ou, Chiu, Zeng, and Metz (2014).
Figure 13.1 Cumulative corporate default rates by ratings categories.
As with other ratings systems, credit ratings fail when they are based on faulty assumptions or omit critical input data. Recent failures by the credit rating industry illustrate these risks. For example, in 2001, Moody’s came under considerable criticism for maintaining an investment-grade rating on Enron (Baa1) just weeks before the company collapsed into bankruptcy. Although the default of an investment-grade rated company is not a failure in a statistical sense, in the case of Enron, it was a failure in a methodological sense. Moody’s rating model failed to incorporate significant off-balance-sheet obligations that Enron had committed to through special-purpose vehicles. By failing to count these toward the total indebtedness of the company, Moody’s did not properly measure the riskiness of Enron’s capital structure. As a result, Enron’s creditworthiness was not consistent with the Baa1 rating assigned to it by Moody’s.
A similar methodological breakdown occurred in the rating of various asset-backed securities backed by U.S. subprime residential home mortgages between 2006 and 2008. Moody’s and the other two major rating agencies made assumptions about future home price appreciation, default frequency at the individual borrower level, and the correlation of default across geographical markets that proved to be highly erroneous. As a result, there was a systemic failure in securities backed by these mortgages, which spread to affect derivative investments that were tied to those securities as well. This failure contributed to the collapse of the credit markets in 2008.
The success and failure of credit ratings can serve as an example as we turn to the topic of corporate governance ratings. As we examine models developed by commercial providers and academics, we ask first and foremost whether they pass the test of predictive ability. Are positive corporate governance ratings correlated with positive corporate outcomes? Are the relative ratings assigned by each provider consistent with the relative outcomes of the entities being rated? Are methodological shortcomings compromising the integrity of these ratings systems? After all, if market participants are expected to make investment and financial decisions in part based on corporate governance ratings, they should have some assurance that these ratings are accurate. To make that assessment, the ratings must stand up to rigorous, objective testing.
Commercial Corporate Governance Ratings
Governance ratings firms rate companies on the overall quality of their governance system, taking into account structural factors. Some governance ratings firms include subratings on specific areas, such as audit quality, compensation, and antitakeover protections.
Two prominent corporate governance ratings firms exist: Institutional Shareholder Services (ISS) and GMI Ratings. ISS has developed three successive governance ratings systems over the past 15 years. ISS ratings are sold separately from the company’s proxy advisory services discussed in Chapter 12, “Institutional Shareholders and Activist Investors.” GMI Ratings has acquired three ratings systems through predecessor companies, one of which is currently in use.
ISS: Corporate Governance Quotient
One of the first ISS ratings systems, called the Corporate Governance Quotient (CGQ), was developed in 2002. The CGQ model included 65 variables in eight categories: the board of directors, audit, charter and bylaw provisions, state of incorporation, executive and director compensation, qualitative factors, equity ownership by board members and executives, and director education (see Table 13.1).
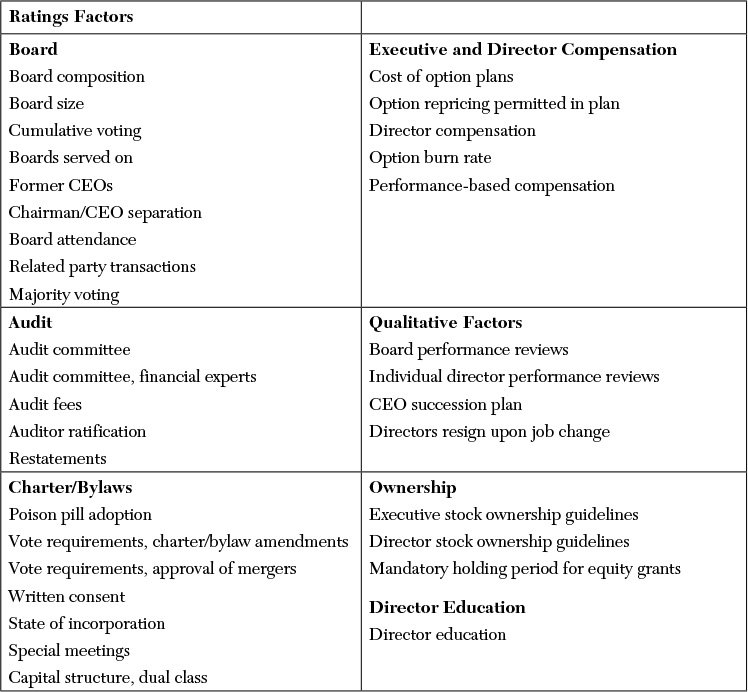
Source: Institutional Shareholder Services, “U.S. Corporate Governance Quotient Criteria.”
Table 13.1 Selected Ratings Variables: CGQ (2007)
Companies were assigned a numeric score on a scale of 0 (unfavorable) to 100 (favorable), based on their performance across these variables. Ratings were then distributed along a forced curve to reflect relative rather than absolute levels of corporate governance risk. Each company received two CGQ scores: The first measured its governance quality relative to its market index and the second relative to its industry.
ISS did not disclose technical details of how it developed CGQ. The ratings agency generally stated that it gathered a list of best practices—as reflected in rigorous research and in consultation with professionals and institutional money managers—and performed statistical analysis to determine correlations of each metric with performance and to assign weightings.2 ISS claimed that CGQ was a reliable tool for “identifying portfolio risk related to governance” and “leveraging governance to drive increased shareholder value.”3
ISS: Governance Risk Indicators
The second ISS ratings system, called Governance Risk Indicators (GRId), was introduced in 2010 to replace CGQ.4 The GRId model included a maximum of 166 data inputs in four “subsections”: audit, board structure, shareholder rights, and compensation. Selected inputs included these:
• The percentage of nonaudit fees as a percentage of total fees
• Whether the company had been subjected to an enforcement action in the previous two years
• The percentage of independent directors
• Independent or dual chairman/CEO
• Single or dual class of shares
• Poison pill that shareholders did not approve
• The percentage of the chairman’s compensation that is performance-based
The actual number of variables included in a company’s rating varied based on country of origin. The rating of a U.S. company was based on 63 variables. Variables mandated by law (such as independence standards of the compensation committee) and variables based on governance features that were not applicable (such as composition of the supervisory board) were not included. Each variable was then weighted. The weightings themselves also varied based on country of origin. For example, annual director elections were more heavily weighted in Canada than in the U.S. “to reflect geographical differences.”5
Companies received a composite GRId score to demonstrate overall governance quality and a GRId score for each subsection. Scores were distributed across a 10-point scale, +5 to –5, with zero representing neutral. Positive scores indicated “low concern” for a company’s governance and were awarded to companies that “exceed local best practice guidelines.” Neutral scores indicated “medium concern,” and negative scores indicated “high concern.”
According to ISS, GRId ratings were not intended to predict future operating performance or shareholder returns but to “help institutions and other financial market participants measure and flag investment risk.”6
ISS: QuickScore
ISS released its third ratings system, QuickScore, in 2013 to replace GRId. QuickScore rates companies on 200 governance factors categorized under four “pillars”: board structure, shareholder rights and takeover defenses, compensation, and audit and risk oversight. The factors are similar to those used in GRId, with additional factors such as these:
• The percentage of nonexecutive directors with lengthy tenure
• Whether the board recently took action that materially reduced shareholder rights
• The number and percentage of women on the board
• Whether the most recent say-on-pay proposal received shareholder support below 70 percent
• Whether the board failed to implement a majority-supported shareholder proposal
QuickScore includes other methodological features that are similar to GRId. For example, corporate ratings are assigned on a scale of 1 to 10, with 10 representing “high concern level.” Companies are also assigned pillar-level scores on this scale. QuickScores are given relative to the market index and on a geographic basis. ISS claims that its ratings “help institutional investors identify and monitor potential governance risk in their portfolios, and help companies identify possible investor concerns based on signals of governance risk.”7
GMI Ratings
GMI Ratings is owned by MSCI and represents the consolidation of three previous ratings companies that merged in 2010: GovernanceMetrics International, The Corporate Library, and Audit Analytics. (Prior to the acquisition of GMI Ratings, MSCI owned ISS from 2010 to 2014. In addition to GMI Ratings, MSCI owns firms that provide ratings and analysis of companies’ environmental, social, and governance-related business practices.)
The GMI Ratings system in place today is based on the methodology developed by Audit Integrity. The ratings agency assigns companies an Accounting and Governance Risk. (AGR) score based on data inputs that capture both accounting and governance risk factors.8 That is, unlike the ISS model, AGR takes into account detailed financial reporting metrics, such as abnormal accruals and variability in accounts. The AGR model also relies on time-series data to track the change in variables over time. Based on the output of this analysis, companies are forced into percentiles that reflect their aggregate level of accounting and governance risk and are categorized as follows:
• Very Aggressive—highest-risk companies, top 10 percent of the total universe
• Aggressive—high-risk companies, next 25 percent
• Average—moderate-risk companies, next 50 percent
• Conservative—low-risk companies, bottom 15 percent
GMI Ratings claims that the purpose of the AGR system is “to use publicly available data to discriminate between fraudulent and nonfraudulent companies.”9
Testing the Predictability of Corporate Governance Ratings
Ultimately, the usefulness of a governance rating is contingent upon its predictive nature. It is not sufficient for a governance ratings firm to articulate and defend the rationale behind its methodology. It needs to demonstrate that its ratings are correlated with outcomes that investors care about, such as operating performance, stock price performance, or the avoidance of bankruptcy, accounting restatements, and litigation (see the following sidebar).
The research evidence suggests that ISS ratings do not have predictive ability. Daines, Gow, and Larcker (2010) found that ISS ratings (CGQ) were not correlated with future accounting restatements, class-action lawsuits, accounting operating performance (return on assets), market-to-book ratio, and stock price performance. They also found little correlation between the CGQ ratings assigned by ISS and its proxy recommendations. The authors concluded that “substantial measurement error [exists] in commercial corporate governance ratings” and that “boards of directors should not implement governance changes solely for the purpose of increasing their ranking.”14
Rigorous research on subsequent ISS ratings systems—GRId and QuickScore—has not been performed, but there is little reason to believe that these ratings, which are similar in structure to CGQ, can accurately measure governance quality.
Research suggests that the GMI Ratings system has somewhat higher predictive ability. As discussed in Chapter 10, “Financial Reporting and External Audit,” Price, Sharp, and Wood (2011) and Correia (2014) both found that AGR scores are correlated with financial misstatements.15 Daines, Gow, and Larcker (2010) found that AGR has some ability to predict future restatements, class-action lawsuits, and operating and stock price performance. The authors noted that the success of the model might be due to the inclusion of financial statement data rather than a pure reliance on “observable corporate governance mechanisms, such as board structure.”16 To our knowledge, there are no commercial governance ratings that are highly correlated with future outcomes likely to be associated with poor corporate governance.
Governance Rating Systems by Academic Researchers
Academic researchers have also put considerable effort toward the development of models to measure governance quality. The typical model takes the form of a corporate governance index that aggregates several input variables into a single metric. To construct an index, the researcher selects governance features that are deemed to be important, such as board structure, antitakeover provisions, and bylaw restrictions. These variables are quantified (usually through the assignment of binary numerical values, 0 or 1) and compiled into a single index that is said to reflect overall governance quality. A company’s governance score can be readily compared against those of others to gauge its relative effectiveness.
Gompers, Ishii, and Metrick (2003) developed one of the first firm-specific corporate governance indices.17 They included in their study 1,500 publicly traded U.S. corporations (primarily those in the S&P 500 Index and other major indices) between 1990 and 1999. To construct the index, they relied on corporate governance features tracked by the Investor Responsibility Research Center (IRRC). IRRC collects data on 28 variables, 22 of which are related to governing documents and 6 of which are related to antitakeover protections (reduced by the authors to 24 after taking into account overlaps—see Figure 13.2).

Source: Gompers, Ishii, and Metrick (2003). Copyright by the President and Fellows of Harvard College and the Massachusetts Institute of Technology.
Figure 13.2 Governance features included in G-Index.
As we can see from the list, the input variables are heavily weighted toward antitakeover measures, which was the main focus of IRRC during this time. Each company was assigned one point for each provision that is viewed as negatively impacting shareholder rights and zero for each provision that favors shareholder rights. These values were then totaled to create a governance index (or G-Index), which, according to the authors, served as a “proxy for the balance of power between shareholders and managers.”
To test their model, the authors grouped companies with similar G-Index scores into buckets. Those with a low G-Index score (less than or equal to five) were deemed to be shareholder friendly. These companies were given the label “democratic” companies. Those with a high G-Index (greater than or equal to 14) were deemed to restrict shareholder rights and were labeled “dictator” companies. The results of the study are striking. An investment strategy that involves simultaneously buying the democratic portfolio and shorting the dictator portfolio earned abnormal returns of 0.71 percent per month (8.5 percent annually) over the measurement period (September 1, 1990, to December 31, 1999). Furthermore, the authors found that a one-point increase in the G-Index was correlated with an 11.4 percent reduction in market-to-book value over the measurement period. That is, the companies with more favorable shareholder rights exhibited higher stock price returns and higher market valuations than companies with worse shareholder protections.
These returns are extremely impressive. In fact, they are so impressive that they merit closer scrutiny. Is it possible for a collection of publicly available, plain-vanilla governance features to produce this level of excess stock returns? Is the stock market this inefficient in processing information on corporate governance?
Several researchers have reexamined the findings. Core, Guay, and Rusticus (2006) found that the G-Index investment strategy lost the ability to generate substantial excess returns when the time period in the analysis was extended to include 2000–2003.18 Whereas the democratic portfolio of Gompers, Ishii, and Metrick (2003) outperformed the dictatorship portfolio between 1990 and 1999 (23.3 percent versus 14.1 percent), it substantially underperformed between 2000 and 2003 (–5.8 percent versus 4.3 percent). That is, after the crash of the technology sector, there were no statistical differences between the returns to dictator and democracy firms (see Figure 13.3).

More recently, Bebchuk, Cohen, and Ferrell (2009) attempted to refine the G-Index to improve its predictive ability. The authors posited that one of the shortcomings of the G-Index could be that its inputs were not selected based on a preexisting and proven correlation to corporate performance. Instead, they were chosen based on the simple fact that IRRC tracked them. Therefore, several could potentially be irrelevant or redundant. The authors therefore selected a subset of the IRRC inputs that they believed had the strongest relationship to corporate performance. These included staggered boards, limitations on shareholder ability to amend the company bylaws, limitations on shareholder ability to amend the company charter, the requirement of a supermajority to approve a merger, the use of golden parachutes, and the use of a poison pill. The authors explained that they selected the first four of these because they limited “the extent to which a majority of shareholders can impose their will on management.” They selected the last two because they are “the most well-known and salient measures taken in preparation for a hostile offer.”19
Companies were assigned a 1 for the enactment of each provision that restricted shareholder rights and a 0 for the absence of such provisions. Total values therefore ranged from 6 to 0, with a 6 indicating poor corporate governance and a 0 indicating good corporate governance. The authors named their index the E-Index because it was intended to measure management entrenchment. Most firms scored between 1 and 4, indicating moderately low levels of management entrenchment. The measurement period included 1990–2003, thereby taking into account both favorable and adverse stock market conditions.
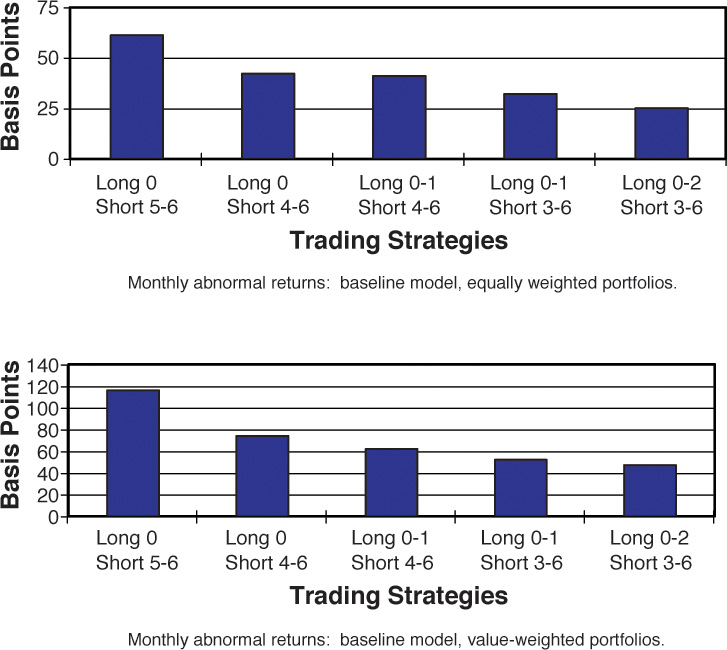
The authors then applied a similar “long–short” strategy, whereby companies with low E-Index scores were purchased and companies with high E-Index scores were shorted. They found that such a strategy would have yielded average abnormal returns of nearly 7 percent per year over the measurement period. Furthermore, they found that a long–short strategy that pitted the very best E-Index companies (long = 0) against the very worst (short = 5–6) was superior to one that pitted several rankings of the best scores (long = 0–2) against several rankings of the worst (short 3–6) (see Figure 13.4).
The results of Bebchuk, Cohen, and Ferrell (2009) are also striking, and research efforts to assess their validity are mixed. Johnson, Moorman, and Sorescu (2009) argued that excess returns in the portfolio were driven by different industry composition in the long and short portfolios and not by differences in governance features. Using better-specified tests for computing excess returns that adjust for industry differences, they concluded that neither the Gompers, Ishii, and Metrick (2003) trading strategy nor the Bebchuk, Cohen, and Ferrell (2009) trading strategy produced excess returns.20 Lewellen and Metric (2010) showed that although the trading returns vary depending on industry adjustment, the original G-Index and E-Index results remain intact.21
Cremers and Ferrell (2014) found mixed evidence that the G-Index and E-Index are associated with future abnormal stock returns.22 Their results varied depending on time period considered and the specific computation used to calculate returns.
Finally, Larcker, Reiss, and Xiao (2015) found coding errors in the underlying IRRC data and definitions used to produce E-Index and G-Index scores (such as the definition of golden parachutes and the method for measuring supermajority requirements for changing corporate bylaws and charters). After correcting errors and refining the variable definitions to conform to contemporary legal thinking, the trading strategy returns reported by Bebchuk, Cohen, and Ferrell (2009) are substantially reduced and in many cases no longer statistically significant.23
All in all, definitive conclusions have not been reached about the predictive ability of an index composed of mostly antitakeover provisions on future firm performance.
The Viability of Governance Ratings
Holding aside the mixed empirical research described in this chapter, a fundamental conceptual flaw arises with the idea of developing governance indices and ratings. Throughout this book, we have seen that although elements such as board independence, compensation structure, audit quality, and antitakeover provisions are important to governance quality, few obvious and uniform standards exist to aid in measuring these elements.24 In certain corporate situations, one structure might be effective in decreasing agency costs, while in other situations, that same structure might impose inefficient costs that actually impair corporate performance. A ratings model built on the assumption that a single governance structure can be built as a “best practice” and then uniformly applied across firms seems likely to fail.
Instead, governance quality should be assessed on a case-by-case basis, using independent judgment and a critical understanding of how various governance structures interact to improve or detract from corporate performance. One example of how this might work is seen in the method by which Fitch Ratings incorporates governance data into its credit analysis. The firm is cognizant of the fact that corporate governance can have an important influence on the likelihood of corporate default, so it incorporates an assessment of governance quality into its credit ratings. Although the firm reviews statistical data to uncover differences between companies and flags those with potentially outsized risk, Fitch makes its ultimate evaluation using what it calls a “contextual review.” This includes a “review [of] governance practices that require more qualitative analysis and cannot be readily measured in a data set (including the interplay of different practices).” Areas of particular focus are “board quality (independence and effectiveness), related party transactions, reasonableness of management compensation, integrity of audit process, executive and director stock ownership, and shareholder rights/takeover defenses.” Companies with “exceptionally weak or deficient governance practices” face the risk of downgrade.25
That is, Fitch aims to evaluate many of the governance functions that we have discussed throughout this book, but it does so through independent analysis, not under a check-the-box methodology. The firm clearly believes that this leads to richer, more thoughtful conclusions. Investors, regulators, and other constituents with a vested interest in corporate success might benefit by adopting a similar approach.
Endnotes
1. Sharon Ou, David Chiu, Zhi Zeng, and Albert Metz, “Special Comment: Corporate Default and Recovery Rates, 1920–2013,” Moody’s Investors Service (February 28, 2014). Accessed April 9, 2015. See https://www.moodys.com.
2. In its marketing materials, ISS claimed that CGQ was “a reliable tool for 1) identifying portfolio risk related to governance and 2) leveraging governance to drive increased shareholder value.” It also claimed, “There is no doubt that CGQ ratings could have helped some investment manager avoid the gigantic losses experienced during the corporate scandal era defined by the meltdowns at Enron, Global Crossing, and WorldCom.” See Institutional Shareholder Services, “U.S. Corporate Governance Quotient Criteria.” Accessed August 27, 2007. See www.issproxy.com/esg/uscgqcriteria.html. Also see Robert Daines, Ian D. Gow, and David F. Larcker, “Rating the Ratings: How Good Are Commercial Governance Ratings?” Journal of Financial Economics 98 (2010): 439–461.
3. Institutional Shareholder Services, “Corporate Governance Quotient.” Accessed August 27, 2007. See www.issproxy.com/esg/cgq.
4. Subodh Mishra, “Governance Risk Indicators: A New Measure of Governance-Related Risk,” Governance Institute and ISS (March 10, 2010). Accessed October 18, 2010. See www.riskmetrics.com/sites/default/files/ISS_GRId_Tech_Doc_20100310.pdf.
5. RiskMetrics/ISS explains: “[T]he weighting is higher in Canada (50 percent, compared with 33.3 percent for U.S. companies, of the takeover defenses subsection), reflecting the sharpened focus on Canadian issuers who elect their board through bundled or slated elections.” See ibid.
6. These claims are self-contradictory. Risk and performance are related. If you can predict “investment risk,” this necessarily translates into better risk-adjusted performance. See ibid.
7. ISS, “ISS Governance QuickScore: Overview,” (January 2013). Accessed May 5, 2015. See http://www.issgovernance.com/governance-solutions/investment-tools-data/quickscore/.
8. GMI Ratings, “The GMI Ratings AGR Model: Measuring Accounting and Governance Risk in Public Corporations” (2013). Accessed April 10, 2015. See http://www3.gmiratings.com/wp-content/uploads/2013/11/GMIRatings_AGR3.0Whitepaper_102013.pdf.
9. Ibid.
10. Institutional Shareholder Services, American International Group, Inc. CGQ Governance Profile, shareholder meeting date May 19, 2004; most recent CGQ profile update April 30, 2004.
11. Ian McDonald and John Hechinger, “Uneasy Sits the Greenbergs’ Insurance Crown: Marsh Faces Hurdles to Regain Investor Trust as It Confronts yet Another Batch of Allegations,” Wall Street Journal (October 18, 2004, Eastern edition): C1. Theo Francis and Jonathan Weil, “AIG Could Face Criminal Charges,” Wall Street Journal (October 22, 2004, Eastern edition): C.1.
12. Matthew Karnitschnig, Deborah Solomon, Liam Pleven, and Jon E. Hilsenrath, “U.S. to Take Over AIG in $85 Billion Bailout: Central Banks Inject Cash as Credit Dries Up; Emergency Loan Effectively Gives Government Control of Insurer; Historic Move Would Cap 10 Days That Reshaped U.S. Finance,” Wall Street Journal (September 17, 2008, Eastern edition): A.1.
13. Stephen Taub, “Did Governance Raters Foresee Marsh, AIG?” Compliance Week (October 26, 2004). Accessed November 12, 2010. See https://www.complianceweek.com/news/news-article/did-governance-raters-foresee-marsh-aig.
14. As cited in Daines, Gow, Larcker (2010).
15. Richard A. Price, Nathan Y. Sharp, and David A. Wood, “Detecting and Predicting Accounting Irregularities: A Comparison of Commercial and Academic Risk Measures,” Accounting Horizons 25 (2011): 755–780. Also see Maria M. Correia, “Political Connections and SEC Enforcement,” Journal of Accounting and Economics 57 (2014): 241–262.
16. Daines, Gow, Larcker (2010).
17. Paul Gompers, Joy Ishii, and Andrew Metrick, “Corporate Governance and Equity Prices,” Quarterly Journal of Economics 118 (2003): 107–155.
18. John E. Core, Wayne R. Guay, and Tjomme O. Rusticus, “Does Weak Governance Cause Weak Stock Returns? An Examination of Firm Operating Performance and Investors’ Expectations,” Journal of Finance 61 (2006): 655–687.
19. Lucian Bebchuk, Alma Cohen, and Allen Ferrell, “What Matters in Corporate Governance?” Review of Financial Studies 22 (2009): 783–827.
20. Shane A. Johnson, Theodore C. Moorman, and Sorin Sorescu, “A Reexamination of Corporate Governance and Equity Prices,” Review of Financial Studies 22 (2009): 4753–4786.
21. Stefan Lewellen and Andrew Metrick, “Corporate Governance and Equity Prices: Are Results Robust to Industry Adjustments?” Unpublished working paper, Yale University (2010).
22. Martijn Cremers and Allen Ferrell. “Thirty Years of Shareholder Rights and Firm Value,” Journal of Finance 69 (2014): 1167–1196.
23. David F. Larcker, Peter C. Reiss, and Youfei Xiao, “The Entrenchment Index and the Value of ‘Corporate Governance.’” Unpublished working paper (2015).
24. Larcker, Richardson, and Tuna (2007) tested a comprehensive list of governance attributes and found no statistical relation to corporate outcomes. See David F. Larcker, Scott A. Richardson, and I.rem Tuna, “Corporate Governance, Accounting Outcomes, and Organizational Performance,” Accounting Review 82 (2007): 963–1008.
25. Kim Olson, “Corporate Governance from the Bondholder’s Perspective: Measurement and Analytical Considerations,” Fitch Ratings (February 9, 2005).