Unlike the market for traditional packaged goods where the goal is often to sustain and grow a household brand over time, the film and television business operates by media blitz to try to create new brands overnight. A movie can become a brand unto itself, and what business other than the film business strives to create a new brand over a weekend? The time, money, and effort expended to create public awareness of a film in its opening weekend is staggering, and has become the front edge of criticism by artists who bemoan the subjugation of art to the beast of box office grosses.
Because a major studio film frequently needs to recoup better than $100 million between production and marketing costs—with the average cost of a studio film approximately $70 million and the average marketing costs approximately $35 milllion1—openings are critically important. (Note: These amounts were published by the MPA a few years ago, and while not recently updated, they still serve as one of the few “hard data points” published in the industry; as discussed in Chapters 1 and 9, SNL Kagan estimates that the costs were similar to these prior benchmarks, with the average studio film having a negative cost of $72.3 million in 2010 and $66.6 million in 2011, and domestic print and marketing costs of approximately $40 million; see Table 9.5 in Chapter 9.) One of the most interesting developments of the maturation of the distribution market is that the more important the revenue streams outside of box office have become, the more important the value placed on the box office. In other businesses, the thesis would be that as traditional outlets were overtaken by new channels of distribution, one might see the original outlets dwindle in importance and, in cases, be phased out entirely. Not so in the film world.
With the growth of other markets, and the potential for combined revenues from TV, video, merchandising, and new media sources to surpass revenues from movie theaters, the bellwether of box office has grown in importance. The reason is twofold, and relatively simple. First, the success of the box office continues to be an accurate barometer for the success in subsequent release markets. Second, the media frenzy surrounding theatrical release drives awareness that is amortized over the life cycle of the product and drives consumption months and even years later.
In terms of the influence of the Web and digital technologies on the theatrical market, while there are clearly major changes in exhibition and production systems (e.g., HD cameras and digital cinema), perhaps the most significant impact the digital revolution is having on theatrical exhibition is the way movies are marketed. Budgets for online marketing are growing, virtually every movie has its own website and Facebook page, and marketing executives are trying to generate “buzz” by pushing out trailers and other information to YouTube and an array of social media sites. Additionally, review sites such as Rotten Tomatoes aggregate critics’ opinions and reduce nationwide diverse reactions into a single, homogenized scorecard: What percentage of reviews are positive or negative? The ability to broadly market via leading websites and social media sites while narrowly targeting demographics via niche sites and seeding blogs and microblogging outlets is revolutionizing movie marketing—ask anyone under 25 today whether they check out a film first on the Web or on social media (where they may focus on “likes” or more specific recommendations from friends) as opposed to looking at a newspaper, and they are likely to sneer that you even posed the question. Although I could delve into these influences here, I simply want to highlight the impact, and instead address most of these factors in Chapter 9.
Theatrical Release as a Loss-Leader
Basic Definitions and the Uneasy Tension between Distribution and Production
Theatrical release simply means the exhibition of a film in movie theaters where revenue is derived from members of the public buying tickets. The “gate,” or the revenues derived from ticket sales, is what is referred to as “box office.” The amount of money that the distributor keeps from the box office receipts is called “film rentals.”
Box office can sometimes lead to misleading numbers when preparing macro-statistics on industry growth and trends because box office captures only a cumulative number. There are a myriad of ticket prices and discounts reflecting regional and local differences and accommodations for seniors and kids. Basically, the box office is an excellent measuring stick and the ultimate source of revenue, but it does not provide marketing data on who the consumers were or even how many of them attended (a concept that seems anachronistic in the age of social media, micro-blogging, and Web metrics). Box office over a period may have gone up, but that could mean that attendance was down while average ticket prices were up. Because of this ambiguity, some countries choose to measure trends by “admittance”; namely, how many people attended (i.e., tickets bought). This is customary in France, where the value of certain downstream rights is pegged to attendance rather than revenue figures.
Theatrical release is the first trigger among film windows, and because a film can be rereleased, the most common trigger is the “initial theatrical release.” How long a film stays in movie theaters is a factor of the film’s performance, and studios negotiate picture-specific deals with each theater into which a film is booked. Depending upon clout and stature, the distributor (e.g., the studio’s theatrical distribution arm) may be able to negotiate for guarantee or hold weeks, securing a set minimum period of time the film will be in release; guaranteed minimum weeks are obviously risky propositions for both sides, because if a film flops, the theater will want to drop it quickly and show something new, and the distributor will be reluctant to spend marketing dollars for fear of throwing good money after bad.
In extreme cases, the driving force may be neither of the negotiating parties, but the film’s director or producer who secured a release commitment from the distributing studio. Lack of trust inevitably fuels the relationship, because producers and directors who have put years of work into a project want as many guarantees as possible that their film will have the best possible chance to succeed. Cries of “they didn’t know how to handle the film” and other excuses are rife in Hollywood, in part because a project shifts 180 degrees in responsibility from delivery to release. During production, the director and producer are kings, and in almost total control over hundreds of people and millions of dollars. Once the film is delivered, the distributor is in near total control. An often-uneasy partnership is borne, and in failure it is easy to point a finger at the other party.
Distributors may be burdened with certain expectations, politics, and commitments, but basically function to make tough, on-the-spot business calls. Also, as suppliers, and factoring in their need to maintain good relationships with exhibitors, it does not behoove a distributor to keep a movie in theaters longer than makes sense. The relationship factor is then weighed together with opportunity costs (when the distributor could be substituting a more profitable picture) and the fact that the distributor is spending real money each day a film is in major release in marketing dollars to support cross-media campaigns.
The Theatrical Release Challenge—Locomotive for Awareness While Profits Remain Downstream
The other wrinkle is that, weekly box office numbers aside, there may be a marketing justification to keep a film in theaters. Because film rentals will rarely recoup a film’s investment, the theatrical release can be seen as a loss-leader to create awareness of the property for downstream video, TV, and other rights. In fact, looking at the ultimates for the film (i.e., lifetime projections of all revenue sources), most distributors are reconciled to losing money through this stage of exploitation. Accordingly, the distributor is not running a straightforward break-even analysis in trying to decide whether to keep a film in theaters versus pulling it (balancing opportunity cost versus continuing marketing costs); this calculation is coupled with a more complex marketing analysis, taking into account consumer impressions, market awareness, and impact on providing the bang to fuel subsequent exploitation. Namely, there cannot be much of a long tail without a launch.
Ultimately, those in charge of distribution are almost always in an awkward position—they have virtually no input in the creative product, and yet are responsible for opening the film (in tandem with the marketing department) and literally charting its destiny. A distributor must make a good picture great, and somehow find a way on “a dog” to pull enough box office out quickly to recoup some investment before the public sours; moreover, it needs to achieve this within a context of not really knowing what the reaction will be (given the “nobody knows” quandary of experience goods).
Hedging Bets and Profiling Release Patterns
The film Titanic provides another good example in this context, as it posed a dilemma for the distributor and studio having to make high-stakes calls without the benefit of knowing how the audience would react. The reviews before opening were dicey, and the picture was well known in the Hollywood community to be suffering from budget problems. In fact, rumor had it that Fox was so nervous about the budget that it was desperate to sell off rights and reduce its potential downside, which it ultimately did with Paramount (see Chapter 3).
Selling off the upside and mitigating its potential downside turned out to be Paramount’s gain, as the reviews were wrong and the picture became the all-time box office champ (until director James Cameron one-upped himself with Avatar). More than a box office champ, the film also defied the odds and played throughout the summer, staying on the charts for almost a whole year, ending up at $1.8 billion in worldwide box office ($600 million United States, $1.2 billion international).2 When a film continues playing like this, beyond a typical pattern where most films would see a decline, it is referred to in industry lingo as “it’s got legs.”
In trying to select the right strategy, a distributor needs to profile its film and match the pattern of release to the nature of the film. This is really the ambit of marketing (which, again, is discussed in detail in Chapter 9). Briefly, however, for a picture where word of mouth is important, the film may only be opened in select venues for buzz to build. Assuming success, the picture then expands locations as its reputation grows, as was the case for Sony’s release of Katherine Bigelow’s Zero Dark Thirty, launching in New York and Los Angeles before Christmas 2012 and then expanding in mid January. (Note: The initial limited release still satisfied eligibility for 2012 Academy Award contention, which can sometimes be a strategy to debut films in the holiday period and then expand in the New Year, given announcements of Oscar nominations occur early in January.) A staged release was also the strategy for Clint Eastwood’s Best Picture Oscar-winning film Million Dollar Baby (2005). Warner Bros. believed they had a strong picture, even one that might be Oscar caliber, but the women’s boxing theme and euthanasia twist needed nurturing to attract broad audiences. This strategy of building buzz before widening the release is also sometimes used when a film may be perceived as an art or period piece (e.g., some of the earlier Miramax pictures, such as Merchant Ivory Productions), as well as when a picture is perceived to appeal to more of an intellectual crowd. Woody Allen films would fall into this latter category, and tend to open in big cities, including his hometown and frequent film backdrop Manhattan, before broadening after hopefully generating buzz and critical acclaim.
The more typical strategy is to open a picture wide, taking as much box office upfront as possible when consumers are enticed into attending through the large upfront marketing campaign creating awareness.
Consent Decrees, Block Booking, and Blind Bidding
The current exhibition environment has come full circle from 50 or more years ago when most of the major studios owned theaters and vertically integrated the production–distribution–exhibition chain by preferentially selling to their own theaters. This included Paramount, MGM, 20th Century Fox, Warner Bros., and RKO. As a result of complaints by independents, the Department of Justice sued these five studios, alleging anticompetitive behavior, and won a landmark case. In 1948, the Supreme Court in U.S. v. Paramount et al. forced these defendant studios to sign a consent decree and divest themselves of theater ownership, while retaining distribution and production.
In addition to forcing divestiture, the consent decree reached beyond the theater-owner defendants and brought the remaining major studios (Columbia, Universal, United Artists) within its ambit regarding certain booking practices. At that time, studios routinely engaged in what is referred to as “block booking,” where the license of one picture was tied to the license of other films; in the extreme case, a producer/studio would pre-sell its entire slate of films for a year to a certain theater or theater chain. One tenet of antitrust law (at least at the time of the case) is that you cannot “tie” products, where a party uses the economic leverage of one product to force a buyer to also buy a second unrelated product that it does not want.
The justice department naturally saw block booking as anticompetitive, and outlawed the practice as part of the consent decree. Going forward, distributors were forced to sell films picture by picture, and theater by theater, with all theaters having a right to bid and compete to exhibit a film.
Another practice that was prohibited by the consent decree was “blind bidding.” Blind bidding is just as it sounds: a distributor would make a theater owner bid on a film and agree to terms without the benefit of seeing the movie first. This was a particularly onerous practice given the inherent challenges of handicapping creative goods. The decree proscribed this practice, and the new law mandated that all films needed to be screened before being sold or put out to bid.
Multiplexes and Bankruptcies of Major Chains
A number of factors led to a spate of bankruptcies of several major chains following boom years in the 1990s. Probably the biggest contributor was the simple fact that screens grew at a pace that far outstripped the rise in movie attendance. According to the National Association of Theater Owners (NATO), in the period from 1988 through 2000, the number of screens in the United States rose to approximately 37,000 from 23,000, representing a 61 percent increase, while theater admissions only rose by about 36 percent. The trend then leveled out, with screens flattening out and coming down only slightly from a 1999 peak to 36,000 + as of the mid 2000s.3
This growth was spurred by the phenomenon of multiplexes, which could leverage common infrastructure (concessions, ticket sales, ushers) across multiple screens, and vary theater size, allowing them to match capacity to demand. This was a compelling economic proposition, but the eight- to 10-screen expansion seemed tempered compared to the next iteration of megaplexes. AMC, which originated the multiplex from a modest two-theater experiment, started the megaplex trend in 1994, building a 24-theater complex in Dallas. The megaplexes included now-common features such as coffee bars, stadium seating, and video arcades, and soon everyone followed.4 The total number of theaters ultimately contracted, as exhibitors abandoned leases and consolidated screens into larger multi-screen venues; according to NATO, the number of locations actually contracted from 7,151 to 5,629 in the decade following the advent of multiplexes (e.g., roughly from 1995).5 The contraction, though, was not enough to counter the larger issue of a massive increase in screens, high operating costs from new megaplexes, and smaller percentage increases in ticket sales and price of tickets.
The net result was too many empty seats and too much overhead, a formula that led to the bankruptcy over time of most of the major chains, such as Loews Cineplex Entertainment, Carmike Cinemas, United Artists, General Cinema, and Regal Cinemas.6 In a sense, the economics of stadium theater venues are … like stadiums. Most of the time capacity is empty—some estimate that theaters operate in the range of 10–15 percent capacity (meaning most seats are empty most of the time)—and the key is maximizing consumption during peak full-capacity events (i.e., hits). This pattern means greater pressure than ever on turning over screens, as operators want something fresh to drive the audience, unable to afford to wait for a middling performer.
By 2013, the trend of declining screens had been halted, led largely by the growth of digital cinema (see below). For a roughly five-year period, the total screens in the U.S. has hovered around 39,000 and according to the MPAA 81 percent of all the U.S. screens in 2012 were in venues with eight or more screens—the new order is clearly the mega-multiplex, and probably more surprisingly is digital, with digital screens now representing 83 percent of all U.S. screens.7
The Digital Divide and Digital Cinema
The Growth of Digital Cinema
George Lucas and Lucasfilm helped pioneer D-cinema by shooting Star Wars: Episode II – Attack of the Clones digitally and releasing the film on 60-plus digital screens in North America in 2002. Much like Lucas had pushed sound presentation with his THX technology and business, D-cinema offered the potential of consistent picture quality. Given the lack of uniform standards, infrastructure, and others to come on board quickly, by the time Star Wars: Episode III – Revenge of the Sith came out three years later (May 2005), the amount of digital screens available had not appreciably increased.
With the studios banding together and setting standards in 2005 under the Digital Cinema Initiative (DCI) consortium, and the theater owners through NATO then building on the agreement and agreeing to specifications, the landscape was set for quick adoption and there was renewed hype. Despite this momentum, though, as of Christmas 2008 there were reportedly only approximately 1,000 screens out of the 35,000-plus screen universe in the United States equipped for digital projection.
Trying to make sense of the glacial adoption, I asked Tom Quinn, senior director of worldwide distribution for Lucasfilm—who managed multiple digital releases with different studio partners, and has had a catbird’s seat to watch the evolution of D-cinema—why he thought adoption had not yet, at that time, materialized. He advised:
The promise of D-cinema is undeniable from a long-term cost savings point of view for both studios and production companies. The challenges have been: Who will pay for it and whose technology will be used? As a comparison to what we witnessed in the home video industry, first with VHS versus Betamax, and more recently Blu-ray versus HD-DVD, the issues are much more complex. Exhibitors don’t really believe D-cinema will drive more ticket sales, and unless there is an impact on a game-changing scale as moving, for example, from cassette to DVD or black-and-white to color film motivating the consumer, they don’t feel they should be the ones bearing the costs of converting cinemas. Added to this is a system that has been virtually the same for 100 years and continues to work well—the “don’t fix what isn’t broken” mentality is hard for the studios to overcome. This is especially true given the high upfront costs of conversion and the fact shifting technology could be outdated soon after multi-component systems, including servers, projectors, etc., are installed.
Against this backdrop, and just when it appeared that it could take years for momentum to build (even though most in the industry were continuing to herald the benefits), the tide turned—and what nobody could have anticipated was, once the trend started to take hold, how fast the overall landscape would shift: by mid 2012, more than 27,000 screens in the U.S. had been converted to digital, and the Hollywood Reporter ran the shocking front-page headline, entitled “Fox Eyes End to 35 mm Film Distribution in U.S.” The article began: “Fox has become the first major Hollywood studio to officially notify theater owners that it will distribute all of its films domestically in a digital format within the next year or two, bringing an end to 35 mm prints.”8 Supporting this shift was the fact that by the end of 2012, there was a near-complete turning upside down of the digital screen penetration chart: from only 14.2 percent of all U.S. screens in 2008 to 83 percent of U.S. screens by 2013. Further, the MPAA, in its 2012 Theatrical Market report, noted that as of Q1 2013, more than two-thirds of the total 130,000 global cinema screens had been converted to digital (a combination of either 3D or digital non-3D).9 (Note: In U.S. screens by type, MPAA notes that in 2008, 5,515 were digital (both 3D and non-3D) out of 38,834 total screens, while in 2012, there were only 6,789 analog screens out of a U.S. screen universe of 39,918.)
When I asked Julian Levin, who headed the DCI and serves as executive vice president, digital exhibition & non-theatrical sales and distribution at 20th Century Fox, whether this was over-exaggerated or whether we truly would see prints go the way of 8-track tapes, he noted:
Elimination of 35 mm prints is already underway, and Fox has already stopped supplying 35 mm prints to several markets in Asia. Furthermore, the U.S. will probably stop using 35 mm prints in 2013, and many other international territories are sure to follow in the next few years. Once digital projection gained traction, with the added benefit of 3D, the point of no return came very quickly, faster than most would have perhaps imagined just a few years ago. The phase out will obviously be market-dependent, but when you reach more than 80 percent conversion of screens within certain markets, the move to all-digital starts to become self-fulfilling and, certainly, prints will become a thing of the past in many territories in the next 2–5 years.
How did this happen? First, it is instructive to look at the absolute numbers. Figure 4.1 is a parallel chart of historical penetration and forecast growth as predicted by 20th Century Fox while the tide was turning. Figure 4.2 is a parallel chart of historical penetration and forecast growth as predicted by 20th Century Fox for the international market.
Adoption of this scale required incentives to invest in the infrastructure, and the DCI was able to forge extremely productive partnerships between the content providers (i.e., studios) and exhibitors. The partnerships implemented what became known as “virtual print fees” to fund and amortize the cost of converting traditional cinemas to digital screens. The cost of conversion was reportedly very high—in the range of $80,000–100,000 per screen—and required some form of partnership/incentive scheme. A type of catalyst was needed, not simply because of the absolute costs and other obstacles that had hindered adoption, but also because conversions were being urged during a period of market turbulence (namely, how would cinemas fare overall in the face of digital disturbance and new forms of access to content) and not long after the time that the majority of major exhibition chains had emerged from bankruptcy. Addressing the macro industry costs, Time magazine, in its annual (2006) “What’s Next” issue, interviewed George Lucas for an article titled “Can This Man Save the Movies? (Again?)”10 and succinctly attributed the delay to theater owners: “When they hear the word digital, they reach for digitalis. Already feeling the hit for the 13 percent slump in moviegoing over the past three years, they aren’t eager to spend the more than $3 billion or so that it would cost to convert approximately 36,000 film projectors to digital.”
The virtual print program was designed to solve the inertia by looking at the differential between the cost of a physical print (such as $1,000) and the lower cost of a digital print and contribute the savings (or at least a part of the theoretical savings) into a pool. The specifics of how that savings was funded was then the subject of negotiation, but the key element is that rather than simply pocketing the savings, the interested parties agreed to impute costs as if physical prints were still being used and utilize that related pool of money to incentivize and fund conversions.
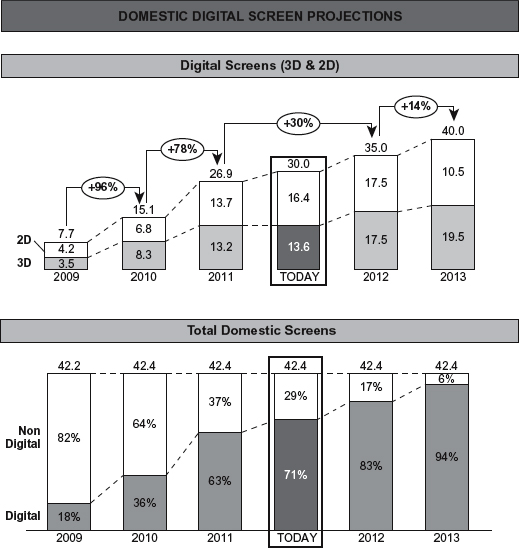
Figure 4.1 Historical Penetration and Forecast Growth as Predicted by 20th Century Fox for the U.S. Market
Courtesy of 20th Century Fox.
Again, I turned to Julian Levin, who advised the following regarding the implementation of these virtual print fee programs:
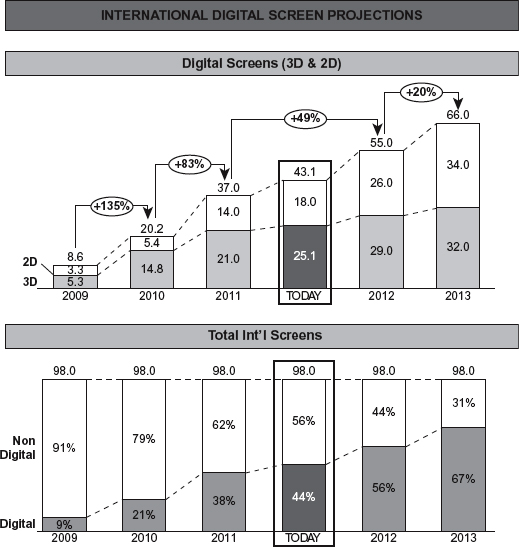
Figure 4.2 Historical Penetration and Forecast Growth as Predicted by 20th Century Fox for the International Market
Courtesy of 20th Century Fox.
In connection with financing the cost of digital projection systems around the world, Fox has made enormous efforts to create a business model that was extremely fair to exhibitors and with distributors contributing significantly to the cost. The business models varied and have evolved. Fox has created the following options for exhibitors:
■ Fox has closed a good number of deals with third-party integrators in the U.S. as well as internationally (some regionally around the world). These integrators would then arrange a structured financing scheme and contributions to the system cost and financing charges would be paid by distributors upon booking each movie on each screen (a “virtual print fee,” or VPF). These deals tended to be complex and required full transparency to recoupment (over 8–10 years), at which point the entire system cost be paid off.
■ Fox also made available “direct-to-exhibitor” deals, which were simplified, allowing an exhibitor to deal direct with Fox should the exhibitor elect not to go with a large third-party integrator. These deals tend to be structured where the exhibitor arranges the financing and Fox pays VPFs for a certain period of time, at which point the VPFs stop. These arrangements are subject to individual exhibitor issues, import duties, customs, taxes, and a variety of moving parts so the cost varies from one exhibitor to another and from one country to another.
■ In certain cases such as France, Italy, Germany, and Norway, the government got involved and provided a structure that exhibitors and distributors could participate in. Fox made accommodations for each of these nuances and guidelines.
■ Once the systems are paid off toward 2020, distributors should benefit from some 35 mm print cost savings, and exhibitors will have the benefit of automation, alternative content, live broadcast, and a host of other electronic efficiencies.
In summary, exhibitors have had ample opportunity to select what plan they prefer, and for those exhibitors who are still not prepared to move (quickly), they could well become a casualty of the global conversion to digital projectors.
The combination of virtual print fee incentives and related schemes (and one would suspect benchmarks requiring certain levels of conversion), spurred the market on from incremental growth to upwards of 1,000 screens/month, and the resulting overall shift in the market landscape as depicted in the charts above. At the same time, the introduction of 3D films, which require D-cinema, provided a further accelerant—a process that was helped significantly by Avatar, which put 3D on the map (see a further discussion regarding 3D below).
D-cinema refers to the process of exhibiting a movie in a theater by digital projection rather than via a film print. The incentives are multifold.
First, most believe that once economies of scale are reached (a driving factor behind the virtual print fee programs) that D-cinema will dramatically reduce the cost of distribution, with the cost of a D-cinema delivery a fraction of the cost of striking and shipping prints. Second, a digital copy does not degrade like a film print, in theory offering a perfect copy with pristine picture and sound each time; in layman’s terms, “no scratches.” Third, because of the costs, prints are often “bicycled” such that the first-run prints from larger cities and multiplexes will move to smaller towns after a few weeks. These locations are known as “second run” and their customers are forced to wait for new releases; eliminating print costs would expand distribution and bring films to these locations sooner.11 Finally, installation of D-cinema allows a digital infrastructure that can convert cinemas into multipurpose venues capable of special event programming, including 3D-film and live-event simulcasting (e.g., sports events, concerts, live theater/opera simulcasts).
Systems, Standards, and the Challenge of Keeping Pace with Technology Advances
D-cinema requires four elements that did not exist historically: a digital projector, a server holding the movie on a file, a digital master, and a delivery mechanism to transfer a copy of the film onto the server (Figure 4.3). Over time, the costs will come down, and the economies of scale in converting the market has already materially reduced the average cost of converting screens; nevertheless, as discussed above regarding virtual print fees, significant upfront investment is required from all sides. The exhibitors need to install projectors and servers (which collectively make up a digital projection system), while the distributors need to create D-cinema masters and standardize delivery mechanisms to clone the master and upload a copy to the in-cinema server.
Standards are, not surprisingly, challenging to cement. This is, in part, due to politics—different groups, such as NATO (exhibitors trade organization) and the DCI, originally promulgated their own standards—and differing opinions on key experience elements such as resolution quality. The de facto resolution standard was JPEG 2000 (“2K”), although many have subsequently pushed for 4K projectors. An interesting question arises as to whether at some point improved resolution is actually a negative: some believe that the 4K resolution is too high, creating an almost artificial, hyperreal, and defect-visible level.

Figure 4.3 The Elements of D-Cinema
Even if the 2K versus 4K debate is resolved (and architecture was put in place accommodating both), issues of frame rate and what is needed for 3D create new wrinkles (e.g., if 60 frames per second is desired and installed base of D-cinema is 48 frames per second, then down-conversion is required).
Technology ever marches on, and today there is discussion of laser projection technology, with the benefit of projecting brighter images. It is unlikely we will see the scale of investment again in the near future to upgrade cinemas, but all parties will continue to struggle with the line of improving the experience versus the costs associated.
Theaters on the Ropes—3D and Needing a New Hook
Against the backdrop of increasing piracy, potentially declining box office (as vicissitudes change the outlook every year or two, though 2012, helped by four different films cresting $1 billion at the box office—Skyfall, The Avengers, The Dark Knight Rises, and The Hobbit: An Unexpected Journey—saw an increase for the first time in two years, both in terms of absolute attendance and domestic box office revenue),12 and increased competition from other media sources (including streaming and downloading to portable downloadable devices), there is a frequent chorus of calls to save the movies. At times, talking about the business almost as if it were a dinosaur, articles and experts often cite reasons for moviegoing (aside from quality arguments) ranging from “movies are produced for the big screen experience” to “movies are a social experience.” The point is executives were becoming defensive and people, particularly theater owners, were concerned. What will bring people into the theaters in record numbers when consumers have a 50-inch LCD TV screen with high-definition content and theatrical-like surround sound? Even studio heads acknowledge the high costs to a family to go to the movies versus renting (babysitter + four tickets + parking + food = $100 versus DVD or VOD rental at less than $5). Although the deep 2008/2009 recession seemed to reverse the trend, as going to the movies proved an escape from economic gloom (as had happened historically), all of the foregoing challenges remain, and no doubt the theaters will need to continue to provide an enhanced and differentiating experience to the moviegoer.
D-cinema, and in particular 3D, was heralded as offering just this value-added experience. Beyond all the historical good reasons to go to the movies, and the quality upgrade of digital cinema, 3D was marketed as something new—one could claim it was back-to-the-future, 3D glasses and all. The argument was the glasses were better this time. Moreover, 3D was perceived as enough of a differentiator to raise ticket prices, to as high as $25, which would both offset the higher production costs of 3D plus help theaters defray the costs of digital conversion. In practice, the premium charged for 3D tickets is about $2–4 more than for traditional 2D, with this differential seemingly now somewhat universally applied. Regal, for example, added $3.50–4.00 for its venues that exhibited Monsters vs Aliens (2009),13 and AMC in Los Angeles charged $4 more on both adult and children’s tickets in 2012.14
A group of prominent directors, including Peter Jackson, George Lucas, Robert Zemeckis, James Cameron, and Robert Rodriguez all spoke out in favor of 3D and the theatrical experience. Some even started developing 3D projects or converting prior films into 3D, waiting to avail themselves of the new technological possibilities. Here was something that could not be matched in the living room. By 2007, James Cameron announced all his future films would be 3D (his first non-documentary movie directed since Titanic being Avatar), and Robert Zemeckis seemed to be following suit. Disney, which announced that all its future animated and Pixar films would be released in both 2D and 3D, even tried to co-opt the medium in its marketing by branding new releases as being in “Disney Digital 3D.” For the first time, significant numbers of 3D films were being produced (e.g., Warner’s Journey to the Center of the Earth, Fox’s Avatar, Lionsgate’s My Bloody Valentine, DreamWorks Animation’s Monsters vs Aliens), but the danger remained that production was well ahead of digital screen conversion, leaving distributors in a quandary and forcing the dual exhibition of the pictures intended exclusively for 3D in standard version simply to obtain enough screens for a wide release.15 DreamWorks Animation, betting big on 3D and having converted its pipeline to 3D productions, was able to expand 3D screen counts to 2,000 for its March 2009 release of Monsters vs Aliens, making it the broadest new 3D release while still falling well short of stated goals for a majority of screens exhibiting the film in 3D.16
As indicated by the statistics above, all of this changed within a couple of years. The digital transition had taken shape, and then the industry was jolted awake, first by the juggernaut of Avatar (becoming the all-time box office king, and garnering upwards of 70 percent of its box office from 3D releases), followed by the huge success of Disney’s rerelease of The Lion King in 3D ($172 million worldwide, and $94 million domestically).17 The conversion costs for 2012 high-profile launches of classics, including Star Wars: Episode I – The Phantom Menace and Titanic, were easily justified, and luminary filmmakers were unabashed with praise and predictions. In an advertisement run by the International 3D Society (www.international3dsociety.com), George Lucas lent his support to the organization’s “Make it 3D” campaign: “Digital 3D technology is revolutionizing filmmaking the way sound did in the 1920s. It will someday become the big-screen standard for presentation, with 3D replacing 2D the way color replaced black-and-white. It’s just a better way of looking at movies.”
In some sense, the 3D success and the conversion of screens to D-cinemas were symbiotic. On the one hand, a couple of high-profile pictures, the most prominent being Avatar, demanded the conversion, because 3D requires compliance with D-cinema specifications. On the other hand, among the benefits of baseline D-cinema conversion was then the relatively simple upgrade to offer 3D—and therefore exhibit moneymakers such as Avatar. To offer 3D in addition to D-cinema requires a lens that pulls across the projector and creates the polarization and depth; this, combined with the polarized glasses, which divides the 48 frames per second intwo two, creates the 3D effect. Accordingly, a theater needs both the equipment and the glasses—an incremental cost that is currently funded and passed on via the higher ticket prices charged for 3D admissions. Overall, the growth in 3D screens has been astounding, and largely parallels the phenomenal growth of digital screens generally: according to the MPAA, there were only 2,536 3D screens globally in 2008, with the number climbing to 45,545 by the end of 2012.18
It is too early to predict the outcome of the 3D trend—certainly, effects laden event films such as The Hobbit: An Unexpected Journey benefit from the premium pricing and lend themselves particularly well to the format, but the race to make everything 3D seems to have cooled. In 2012, the number of 3D releases dropped (from 34 to 28), but clearly there is a trend to produce in significant quantity, and for certain types of films it will be an expectation of fans.19
Distributor–Exhibitor Splits/Deals
The following discussion analyzes how money that comes into a theater from customers is split between the exhibitor (theater) and distributor (studio). Figure 4.4 illustrates the theatrical distribution chain, but if one looks past the moving parts, the key element in terms of theatrical revenues and returns is the simple link between the cinema and booking studio.
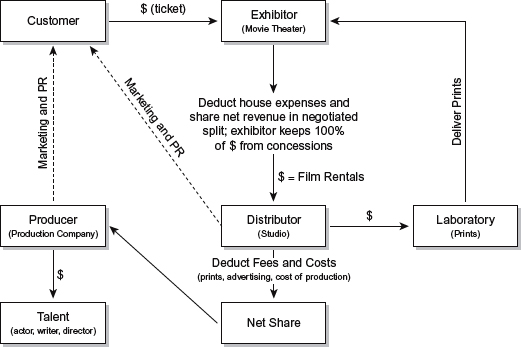
Figure 4.4 The Theatrical Distribution Chain
The amount of money that the studio/distributor keeps from the box office is all-important, because this is ultimately the “at-the-source revenue.” The industry rule of thumb is that the studio keeps roughly 50 percent of the cumulative box office: But how do you get there? Almost all exhibition deals are based around the following concepts:
■ House nut: The theater’s overhead costs, including rent, maintenance, utilities, labor costs, equipment, insurance, etc.
■ Film rental: The distributor’s share of the gross box office receipts
■ Runs: Lingo for how many theaters a film is booked in (but can also denote the first run of a picture)
■ Guaranteed weeks: How many weeks a theater commits to a film
■ Zones: The level of exclusivity in the market is defined by competitive versus noncompetitive zones.
The 90/10 deal used to be the standard, but is now used in a minority of instances. Nevertheless, they are still found, and are instructive in terms of how the concept of house nuts are applied and impact film rental calculations. When a distributor has screened a film for the major exhibitors and is ready to offer them the picture, the booking negotiation will usually address the following elements:
■ Playing time is the number of committed weeks (sometimes in two-week increments)
■ Percentage split of box office, after deduction of specified house nut
■ Minimum percentage/floor for distributor from box office, by week
Accordingly, a deal could look like the following:
■ Playing time: eight weeks (at high end)
■ 90/10 over $5,000 house expenses, with the following minimums:
– Week 1: 60 percent
– Week 2: 55 percent
– Week 3: 50 percent
– Weeks 4–5: 45 percent
– Weeks 6–8: 35 percent
Let us assume that the film brings in $40,000 in box office in week one, compared to another film with the same deal bringing in $10,000. How are the splits calculated?
Film One:
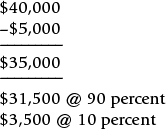
Minimum floor calculation: 60 percent of $40,000 = $24,000
Since $31,500 > $24,000, the distributor keeps $31,500
Exhibitor keeps $8,500 ($3,500 + $5,000)
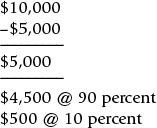
Minimum floor calculation: 60 percent of $10,000 = $6,000
Since $6,000 > $4,500, the distributor keeps $6,000
Exhibitor keeps $4,000 ($10,000 – $6,000), and loses money
Years ago, revenue guarantees would sometimes be applied against the splits, such that, in addition to minimum floors, there would be minimum guarantees. Not only is this practice gone, but true holdovers are a bit of an anachronism; a holdover clause used to trigger an automatic extension for another week (often on a rolling basis) in the event the box office for the picture exceeded a stipulated threshold in the prior week. Today, however, holdovers are dictated by pure economics, and as discussed later, a non-performing title will likely be “kicked out” regardless of contractual provisions to the contrary.
Aggregates: Alternative to 90/10 Deals with House Nut
An aggregate deal is one in which the distributor and exhibitor negotiate a fixed split of the gross box office receipts and do not apply/deduct a house nut. The economic incentives behind this deal largely include doing away with calculating the house nut (by ensuring the exhibitor will not earn less than its nut) and simplifying the accounting; the logic is that if, after all the line-item calculations, the distributor knows it is likely to keep 50 percent, why not just agree to 50 percent? There is, of course, a risk that money could be left on the table, but the bet is that within a narrow band, revenues will even out over time. If the spread were 10 percent, this would not work, but if the parties, through experience, know the spread may only vary by a couple of percent on a certain type of picture, then the risk may be considered nominal. Perhaps the best way to illustrate this is with an example.
If an exhibitor plays a major film that is likely to sell out regularly over the first week or two, it does not mind paying out on the 90/10 split—its nut is covered, and the seats are filled with patrons buying candy and popcorn. At any point that the minimum floor is triggered, however, the distributor is eating into the exhibitor’s house nut. Accordingly, the exhibitor has to ask itself: Would I prefer to book the film where I may not keep my full nut, or should I book a different film where I keep my full nut? This may sound like a simultaneous equation, in that there should be no difference if both movies initially perform well. However, there is a difference with major pictures that may take multiple screens, and where the nut applied may vary per screen. By applying a fixed split, the exhibitor is theoretically assured that its revenues will not fall below its nut.
Splits may then be negotiated in a number of ways. If the exhibitor has the leverage, then the rental percentage will be lower. Additionally, one can imagine cases making the calculation extremely complicated, such as in creating a scale of aggregates in which the flat splits change over weeks, stepping down similarly to the previous minimum-floor 90/10 deal. In this hypothesized instance, negotiations could trade off upfront versus downstream percentages. If the distributor achieves a slightly better deal up front, then it will likely give something up on the back-end, somewhat evening out the equation. At this point, though, one has to question whether there is any efficiency or incentive to move to an aggregate.
Having come full circle, if all that happens is the net dollars are somewhat evened out, why bother? Again, the simple answer that no one will admit to, but probably strikes close to the heart, is ease of administration: a flat deal is easier to calculate and administer. Another reason could be that to book multiple screens in a multiplex (and stick the exhibitor, with the potential opportunity cost of booking incremental screens that may yield better economics with another film), the distributor may want to offer an incentive. That incentive is the aggregate, which, on the surface, is calculated in a way that would otherwise somewhat match the expected return of a firm-term deal, yet by its formula ensures, in theory, that the exhibitor does not risk a split below its house nut. The distributor forfeits incremental revenue equal to the delta between the aggregate split and any higher amount it may have earned on a different deal, but theoretically makes up the difference by expanding its release with the additional screens. (Note: The notion of additional screens expanding the pie is a theoretical statement, for it assumes that the box office is actually generated, which may not happen; and it fails to take into account the incremental print costs of playing that additional screen.)
Despite contractual sliding scales (90/10 deals with minimums), the reality of the theatrical box office is that distributors and exhibitors have a symbiotic relationship and will often move off the letter of the contract. The contract with a sliding scale is sometimes referred to as “firm terms,” because there is a clear formula used for calculating film rentals from the box office gross. In contrast, “settlement” is just like it sounds: at the end of a picture’s run, the parties will sit down to evaluate performance and agree on a percentage. If this smells like a scene from a movie with people haggling in a back office, that is not too far from what can happen. The theatrical distribution business harkens back to the days of arm wrestling and handshakes, and in many cases it devolves to relationships and hard-nose negotiations.
Because distributors have a slate of films, the negotiations need to stay within the bounds of precedents and customary practices. Again, the parties need each other, and it is to neither side’s long-term advantage to fleece the other. Whether horse trading numbers of screens, or holding over a print longer than the pure economics of that particular film may justify based on that isolated film’s performance, there are lots of moving parts and chits to accumulate. When a studio promises a producer it can open a film to a certain breadth, or keep the film playing long enough to reach a certain total, it may need to do some juggling to achieve that goal. By splitting up the pie via settlement, there is obviously more flexibility; unfortunately, there is also more mystery. Ultimately, settlement can only influence results at the margins, because if the results strayed too far from firm terms, then one title would benefit at the expense of another and the system would break.
To “four wall” a movie means to literally rent the venue. In this scenario, the studio distributor will agree to a weekly rental amount and then keep 100 percent of the box office. This is the one scenario where film rentals are equal to box office. (Note: Given the extraordinary costs, in theory, any accounting should either allow the deduction of some form of house nut from the gross revenues or else allow a true flow through of the costs.)
A four-wall deal is unusual, but still occurs. It can come up in a case where the distributor wants a unique venue and this is the only way to ensure its film will be played and will not be dropped early. Another situation when a four-wall deal may make sense is when parties cannot agree to floors and splits; if a distributor was unwilling to accept the terms countered by an exhibitor, and the splits were too low, it might roll the dice to take on the house nut and keep the full gross. In theory, this situation is most likely to arise with a unique venue, possibly with a single screen, that has a high operating cost.
There are no hard-and-fast rules regarding releases, but the following are a few of the critical factors taken into account.
Day-and-Date
Films used to release in the United States and then open internationally weeks and even months later. Much of the delay was due to practical limitations: it would take time to complete the foreign versions (dubs and subtitles), and publicity tours were much easier to orchestrate in a staggered fashion.
With the globalization of the world, instant access from the Internet, and growing threats from piracy, more and more event films are being released simultaneously around the world—in film parlance, a “day-and-date” release. A day-and-date release allows for focused publicity, and affords international territories to capture the momentum rather than release a film when core fans are aware they are seeing the picture downstream. Moreover, for very large titles, it allows the release to become eventized. The largest contributing factor, though, is the ability to defeat piracy, an issue that many obsess over, given the potential for instant and global copies on the Internet.
International B.O. versus U.S.
As discussed in Chapter 1, in terms of windows generally, an increasingly important factor is the growing international box office relative to the whole pie. The numbers for international keep growing, as demonstrated in Table 4.1 from the MPAA’s statistics (based on U.S.$ billions) showing a 32 percent increase in international box office from 2008 to 2012.
When international box office invariably starts to account for the majority of worldwide box office, and in extreme cases represents 70 percent or even 80 percent of the total, then the issues of day-and-date, piracy, and the ability to adjust marketing campaigns take a backseat to the absolute numbers; it is not that these other factors are no longer important, but rather that strategy decisions become disproportionately influenced by the relative returns.
Table 4.1 MPAA Theatrical Market Statistics (Global Box Office All Films)
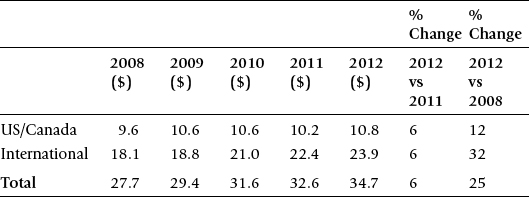
Data reproduced by permission of the Motion Picture Association of America, www.mpaa.org.
In 2012, without knowing what the results would be—remembering the mantra of “nobody knows anything”—Universal and Hasbro took the then-unusual step of releasing hoped-for summer blockbuster Battleship overseas before the U.S.—a strategy that was initially lauded, as the film (estimated cost $209 million) took in about $227 million internationally (63 territories) before the U.S. debut. Variety summarized: “Universal hoped to get a head start on the busy overseas summer schedule by launching Battleship internationally more than a month before the U.S. The tactic appeared to work—at first. During its world tour, Battleship surpassed overseas tallies of John Carter ($210 million) and Wrath of the Titans ($217 million) and now stands as the year’s fifth-highest grossing international release.”20 Unfortunately for Universal and Hasbro, Battleship launched in the U.S. to only $25.3 million the weekend prior to the Memorial Day holiday weekend, and with total domestic forecasts being downgraded to less than $60 million, Universal’s president of domestic distribution (Nikki Rocco) was quoted in the Los Angeles Times as stating: “This is not a total disaster,” in an article that started: “The box office debut of Battleship looked like a very different board game: Trouble.”21
John Carter, which was held up as a disaster for Disney, and led to vicious publicity, a $200 million write down, and the departure of its distribution head Rich Ross, had a comparably lopsided international total: of its $282.2 million worldwide box office, $209.7 million, or 74.3 percent, came from international markets.22 Although both of these examples can be held up, on the one hand, as failures when measuring the domestic totals of films costing more than $200 million, on the other hand both films earned more than $200 million internationally. Only in Hollywood could a $200 million run be deemed a failure, and this is in large part due to the heavy PR and historical focus of domestic performance; in contrast, if the films had generated more than $200 million in the U.S. and had underwhelmed internationally, it would not have made headlines, nor likely triggered collateral consequences.
This dichotomy of bashing a film if it underperforms in the U.S. without giving due credit to international success, and therefore overall performance, is inherently irrational, and will inevitably lead to a change in how releases are perceived. Over time, day-and-date releases, or even the pattern of foreign first and then domestic, will become the norm, and performance will be looked at on a global scale. Distributors will then look at which markets over- or underperformed—which happens today on all films anyway—and adjust models and future marketing expenditures and forecasts accordingly. One would posit that with all these rational steps, PR will follow suit, and less emphasis will be placed on domestic performance as an overall benchmark of success. (Note: In fact, 2012’s Life of Pi (Fox), while often cited as an exception, is a good example of international dominance in an instance where the film was hailed as a success both in the U.S. and worldwide, striking such a chord with global audiences that its international box office was roughly 80 percent of the worldwide total.) Focusing first on overseas results, though, given the Hollywood celebrity culture and nature of the beast, will take the longest to evolve. Expect huge successes in China to be hyped and followed, and U.S. performance to be overanalyzed and held up as a barometer for years to come.
Competition
All studios scrutinize the competitive landscape, as the cleaner window and the less competition, the better. Competition can be segmented into a number of categories.
First, there is competition from other product being released by the same studio/distributor. This is obviously the easiest category to address, and while studios will downplay this issue (under the rationalization that if they were not competing against their own film they would still be competing against something), there is obviously no reason to tax bandwidth and potentially compete against oneself. The second category is direct competition within a targeted demographic or genre. For example, if a major Disney animated movie is releasing, it probably makes better sense to pick a different time frame and not try to divide the animation audience; of course, given the cutthroat competition, there have been conscious attempts to directly release against a similar film in attempt to crush the competition and sustain an upper hand in the market. Additionally, competitive titles may afford an opportunity to counter-program, and a niche or differently targeted film may be able to provide an alternative to certain demographics, and in instances of box office dominated by tentpoles, may even be able to draft off the overall box office uplift. Finally, there is a fear factor—a big enough film that may monopolize the box office. This is especially true in cases of sequels, and often distributors will steer clear of event films, such as the next The Hobbit movie; if enough people move away, then opportunities arise to counter-program to targeted demographics.
Outside Factors (Events of National Attention)
Outside factors play a very important role; films are not simply competing against other films, but also for consumer dollars against other media. It is generally believed that certain events of national importance can siphon off attention and impact box office. Such events may include national political elections and major international sporting events, including the Olympics and the World Cup. These are all planned events that can be factored when planning release dates; however, in an increasingly connected and seemingly unpredictable world, news events, including wars and terrorist attacks, can also create reasons for lastminute juggling.
While the potential influence on diverting attention from the film is real, another key concern is the increased difficulty of marketing a property against these juggernauts of public attention. For example, media will be harder and more expensive to place at the peak of an election cycle. Accordingly, there can be a double hit: releasing a film in the window of an event of national importance will likely make it more expensive to reach desired awareness levels, and even if awareness targets are hit there is a risk that consumers will opt to spend their time and money on the national event that only occurs once every few years.
Acceleration of Revenues
Today, all focus seems to be on opening weekends, with distributors then modeling an ultimate box office based on an extrapolation from the initial week(s) and assumed declines. Historically, films could play for months, and it was not unusual for a blockbuster hit to play through, and even beyond, a season such as the summer. As the number of films made and released grew, competition grew with it. There are a number of interrelated factors that evolved, all feeding on each other, which accelerated this process and led to the compressed revenue cycle of a film taking in a higher and higher percentage of its overall revenue in the first 2–3 weeks of release.
First, people started to focus on opening weekends and records, putting pressure on openings. Marketing dollars were therefore allocated to open a film as large as possible—even if a film’s box office had a sharper week-to-week decline at the beginning than it may have had with a debut on fewer screens. The initial larger box office could make up for this drop and theoretically push the cumulative total higher than an otherwise narrower release would have yielded.
Second, with more and more films, the spacing between major movies shrank. Competitive windows have narrowed, and studios now look to all 52 weeks of the year to find the best competitive free window in which to release; moreover, the jockeying is all critical. Go out against the wrong film and you could be done in the first week, as it is extraordinarily rare that a film that is opened wide and does not perform to expectations then gains in a subsequent week. The system is designed not to let this happen, as a new movie is always on its heels, and if a film does not perform, someone else will take its screens. The exhibition business is ruthless and all about filling seats, not second chances.
Accordingly, distributors are looking to maximize shorter and shorter runs: What am I likely to open up against? What am I coming after? What is coming after me? Each of these factors can dramatically influence the film’s performance, and while there might have been months or at least a month between major titles, with the volume and budgets in current Hollywood this is now measured in weeks. A film that has two or three relatively clear weeks is now blessed, and as late as the mid 1990s this was hard to fathom.
The net result of the acceleration of revenue not only puts inordinate pressures on distributors and content owners, but has a disproportionate negative impact on theater owners. As described previously regarding rentals and weekly minimums, the longer a film plays, the more the split shifts to favor the theater owner; accordingly, theater owners are losing more of their upsides because they lock into revenue schemes where the upside is in downstream weeks that, at worst, no longer exist and, at best, have lower box office revenues to split. In discussing the plight of theaters, Forbes noted: “But the fact that films ‘play off’ and leave theaters faster is poison to the owners. It means that even if overall box office is constant or increasing, owners can be earning much less revenue. One Titanic, which didn’t open particularly well, but played for weeks, is worth more to theater owners than five successful films, each of which earns one-fifth as much.”23
Exacerbating these pressures are key holiday weekends and the built-in expectations of sequels (which often gravitate to these dates as a safe haven, given the usually high budgets). Opening in holiday periods when people have more free time to go to the movies has become a cultural tradition. In the U.S., Memorial Day weekend, Fourth of July, November (to play into Thanksgiving), and Christmas have become prime real estate. If a studio has a picture they view as a sure thing, they will leak out that date early and try to stake out that turf. Although the track record vindicates this strategy, because competition tends to cluster around these dates, it may not be the best strategy; to wit, Batman—The Dark Knight opened in mid July 2008 and went on to become the then-second highest grossing theatrical title of all time. Finally, what often is not talked about, but can be the most influential factor, is superstition. If a film (or director) has had good luck with a date, the studio may want to stick with that timing. I have seen many cases where a date seemed odd relative to the foregoing logical factors, only to realize it was the “director’s date” or was when the original film launched (in the case of plotting a release date for a sequel).
The Online and Digital Speed Factor
Pressure from Review Sites
It was already harder to open a movie with “word of mouth” in a world when slow buzz from the watercooler conversation could be replaced by instant access to national reviews by a site such as Rotten Tomatoes. Only a couple of years ago, the concern was that before a movie opened, potential viewers were privy to whether a majority of critics liked it or not. Today, though, if someone wants an opinion from a more trusted source, they are apt to check out opinions not just via aggregate review sites and on their favorite blogs, but also through a web of social media outlets (e.g., from Twitter to Facebook). This new instantaneous and filtered-for-your-tastes feedback is just another factor compressing timelines: the immediacy and breadth of information makes it hard to hide a bomb, while providing an extra impetus to crash the gates if people are raving.
Online Release
One alternative is to release a film online, either simultaneously with theatrical release or as a substitute unique outlet. In November 2007, director Ed Burns decided to release his $4 million movie Purple Violets on iTunes. Commenting that there was “not enough money to market the film, not a wide-enough release to even make a dent in the moviegoing public’s consciousness,” he pioneered releasing the film via iTunes, reportedly the first time a feature film was debuted on Apple’s download service.24
The model of launching a film online rather than theatrically has, to date, proven risky. The theory is that the online world provides instant access everywhere, and enough of a stampede to watch online would justify cannibalizing theatrical revenues. However, with 35,000 screens in the U.S. and most of the American population within a short drive of a theater, is a bit easier access really a compelling enticement? There are obvious consumer experience differences between seeing a movie online versus in-theater, plus serious economic hurdles, including: (1) theaters’ willingness to boycott films that go online and do not grant an exclusive theatrical window; (2) the risk of further impact on the DVD market (on Purple Violet, “video distributors had offered lower-than-expected advance payments for the film’s DVD right out of fear that its availability on iTunes would cannibalize home-video sales”);25 and (3) the fact that online marketing has not yet been proven successful as the sole vehicle to market a film (though, given the ability to demographically target with more efficient buys, someone is apt to take this risk and perhaps demonstrate a tipping point).
Records Are Not What They Used to Be—Dissecting Opening Weekends
An interesting fact about holidays and openings is that the record book is now more of a microscopic statistical analysis, with lots of people holding bits of records, the accounting segmented to spread the glory. There are now records for biggest one day (which I am proud to have been part of when Star Wars: Episode III – Revenge of the Sith opened to just over $50 million, only to see the record fall to The Dark Knight in 2008), but even that record has now been split into biggest Thursday opening versus biggest Friday versus biggest Saturday, with Saturday generally the biggest day for a film opening. Star Wars: Episode III – Revenge of the Sith leveled out the equation (at least for a while—all records are eventually broken) when its Thursday was bigger than any prior Saturday, but it was only a matter of time before new boundaries were set.
Much more complicated is the notion of the weekend box office. As noted earlier, weekends are customarily calculated as the Friday–Sunday box office. However, holidays skew the mix and can be four or six days. What is the period when Fourth of July falls on a Wednesday? This naturally leads to debates over the “highest weekend,” highest four-day weekend, highest holiday weekend, and highest four-day holiday weekend. Beyond holiday, there is the issue of studios opening “event films” earlier. This helps build buzz for the film leading into the weekend, as well as having the corollary impact of expanding the weekend box office: what a film has grossed by Sunday night. And we are not yet done!
A further wrinkle occurs with sneaks and screenings. Sometimes a film will have a very limited release earlier in the week to build some awareness. This was the pattern with Russell Crowe’s Cinderella Man, released on Friday June 3, 2005. The film actually hit some theaters in major markets for a special sneak the prior Sunday. While it is clear that this gross should not be counted in the following weekend, the line becomes blurred when a film opens midweek. Opening on a Thursday is now relatively common, and the Thursday numbers may or may not be included in the weekend. The studio will position the higher number as the weekend (taking it as a “four-day”), but the trades are likely to split that out and report the three-day and four-day numbers (since there are different records, and presumably it makes things more interesting).
The final issue has to do with midnight or late-night screenings that occur with huge event films. If you want to get picky, where does the 12:01 a.m. or 11:59 p.m. showing fit, and should these be separate or aggregated into the day or weekend? The only clear answer is that it all goes into the weekly gross and ultimate gross. I have not actually counted the permutations, but you should get the picture. To outsiders, it may seem a bit petty, like the multiple boxing crowns. Within the industry, however, it is like chum to a shark. It is an interesting exercise to go to Box Office Mojo and look at a top film and its “chart” section. For The Hobbit: An Unexpected Journey (2012), for example, I counted more than 50 types of rankings, and weekends are now tracked by calendar period (e.g., fall, December, holiday), opening periods by two-, three-, four-, five-, six-, seven-, eight-, nine-, and 10-day grosses, and consecutive (and nonconsecutive for good measure) weeks at number one—spin and bragging rights for all.
This would not be so important if it were not for the press and financial market expectations. The press will jump on box office and hit the ground running on Monday morning. Studio stock prices can rise and fall on these stories, as was the case when DreamWorks Animation released Madagascar on Memorial Day weekend, 2005. The film’s performance was closely scrutinized, as it was the first release following the company’s IPO, and analysts were watching carefully to gauge whether Shrek was a phenomenon, or whether the studio could repeat with blockbuster after blockbuster like Pixar. (Note: To be fair, there was further pressure in that just several days before, DreamWorks announced adjustments to its video numbers for Shrek 2.)
Against this backdrop, when Madagascar opened to $61 million, which is by anyone’s standards a huge number, it was still not up to hyped expectations: “Shares of DreamWorks Animation hit a new low Tuesday, dropping more than 9 percent as some on Wall Street deemed as uninspiring the domestic haul of $61 million that Madagascar garnered in its first four days at the box office and Lehman Bros. downgraded the stock.”26 In an equally extreme, and more recent, example, Men in Black 3’s $70 million four-day Memorial Day weekend 2012 domestic opening led to the Hollywood Reporter opening its front-page banner article, entitled “MIB3 Opens Biggest, but Doubts Remain,” as follows: “Despite a $203.2 million worldwide opening, the jury’s still out on whether Will Smith threequel Men in Black 3 can recoup its $230 million production budget and hefty marketing spend. The Sony tentpole grossed a modest $70 million … compared with the $75 million to $80 million that the studio was anticipating.”27
Studio Estimates
What is a bit mysterious is how that “weekend box office” is calculated. It seems difficult, if not impossible, to have final weekend numbers on Sunday (for the press to write about the weekend) without the benefit of Sunday’s full figures. The studios, accordingly, have to estimate box office; however, the studios have been doing this so long and know their clients (theaters) so well that they can extrapolate a market number with a fairly reliable measure of precision. Although the potential for gamesmanship exists, there are built-in incentives to keep reporting as accurate as possible; the studios want to avoid having to report that they overestimated and take down a number.
What does all this have in common? The big opening, which puts pressure on the splits and dogfights for screens and locations, also brings us back to the aggregate concept.
Table 4.2 is a hybrid example: assuming $100,000 in box office in week one, a decline of 50 percent to $50,000 in week two, a further decline to $30,000 and $25,000 in weeks three and four, a decline to $10,000 and $7,500 in the next two weeks, and two more weeks at $5,000 and $3,000.
Box Office |
|
Two weeks @ 60 |
(.60 × $100,000) + (.60 × $50,000) = $90,000 |
Two weeks @ 50 |
(.50 × $30,000) + (.50 × $25,000) = $27,500 |
Two weeks @ 40 |
(.40 × $10,000) + (.40 × $7,500) = $7,000 |
Balance @ 30 |
(.30 × $5,000) + (.30 × $3,000) = $2,400 |
Total Rentals = $126,900 |
Locations, Types of Runs, Length of Runs, Frenzy of Booking
While other facets of the distribution business, in particular pay TV and video, have changed dramatically over time, the theatrical booking business maintains much of its decades-old practices. This is a business of having to turn over thousands of screens and theaters every week, steeped in relationships at both head office and local booking office levels. There is almost the feeling of a never-ending poker game: cards are shuffled and dealt every week, some cards are traded in, and when final bets are placed everyone is waiting to see who has the high hand on the weekend.
Zones and Types of Theaters
Theater bookings in the United States follow relatively standard patterns. The entire country’s theater count is broken down into regions, cities, and districts, all falling under the management of the domestic theatrical distribution arm of a studio. This is typically managed in a regional structure, where a head office will manage multiple geographic regions such as the South, West, etc. Each region will, in turn, have a regional manager with an army of booking agents underneath him or her.
By having this level of management, the theatrical distribution arm will literally have a direct relationship with every single theater in the country, which totals around 4,000 locations with more than 35,000 screens.
In large urban areas where there are multiple cinemas within relatively close physical proximity, the theaters may be districted into zones or regions. These are not formal/legal classifications, but rather informal designations tacitly acknowledged by the individual theaters (or chains). If you are booking a film in a Regal cinema on Main Street, it may be accepted that you do not then book your film in the theater across the street at AMC’s multiplex, thus granting the theater a measure of exclusivity over its competitor. With the advent of multiplexes, and in particular the growth of large multiplexes, the level of jockeying has shrunk over time.
While focus is on multiplexes and optimizing top theaters (true top-performing theaters are often referred to in industry parlance as “guns” or “gun theaters”), there are a couple of other categories that come into play. For example, drive-ins always want top pictures, especially in summer months, and threshold decisions need to be made whether drive-ins will be single or double bills (as they tend to book double features), and whether the film will play day-and-date with multiplexes or move over to drive-ins at a later date. For so-called “second-run” theaters, often located in smaller towns, prints will be bicycled over to the local cinema after it has had its multiplex/wide launch. Accordingly, along with economic splits, zones, and lengths of runs (see next section), theatrical booking departments also have to deal with the placement patterns of first run versus second run versus specialty (e.g., drive-in) venues. (Note: Drive-ins and second-run theaters are becoming somewhat of a rarity, and accordingly the foregoing description is more of an historical anecdote, though still obviously illustrative of the broader issues in jockeying for screens.)
Booking: A Last-Minute Frenzy
When it gets down to a week or so before a film opens, it is a literal free-for-all. In a matter of days, a film can go from zero bookings to more than 3,000 theaters and 7,000 screens. During this booking time, it is all-out war, with distributors giving theaters terms, including the splits, the number of weeks, etc. In busy times, such as between Thanksgiving and Christmas and in the summer (especially Memorial Day through to the Fourth of July), every weekend is precious, and competition for locations and screens is extreme.
Even though distributors cannot book a theater until the exhibitors have seen the movie (as a result of the prohibition on blind bidding), it is fully impractical to wait until two weeks before a movie release to structure a game plan for booking thousands of venues. Long before the screenings take place, the distribution team will look at the population of theaters and competitive landscape of films and plot a strategy for locations and screens. Because this is done on a weekly basis, the parties are aware of each other’s general tactics and preferences, and relationships have evolved. Accordingly, if Disney is about to release a Pixar film, or Fox has a large action/star-driven vehicle, they will have a strong educated guess as to which theaters they are likely to target and be able to book in downtown Chicago. Much attention is obviously focused on securing prime venues. Not all theaters are equal, and every distributor wants to lock up its top “gun” site.
It is almost like Las Vegas, because there can be a feeding frenzy, and yet it is all about placing bets—nobody knows how any particular film will actually perform. That is where exhibitor conventions (e.g., ShowWest) are so important. They sell to the theaters and make them believe before selling to the consumers. The theater proposition is much simpler than the consumer: no matter what anyone tells you, the theater owners are often single-mindedly focused on traffic. “How many people will a film drive to the venue to buy popcorn?” is the bottom line. Forget about art, reviews, or actors. It is a business.
As an example, put yourself in the place of a theater owner with a screen in downtown Chicago. If you are offered a film starring Tom Cruise or Leonardo DiCaprio at an X percent aggregate, such as 55 percent with second week at 50 percent, would you take that film versus a new CG animated film from a leading producer with two 50 percents? And what if you also had another film with a 90/10, with a sliding scale of guarantees/minimums? What would you choose and what are the variables you would take into account?
Adding to the craziness of bookings are “exception” markets and theaters, where rent costs of a prime venue are so high that theaters may be treated on a different economic basis. There is endless jockeying and side exception deals to manage, where the incentive is actually to strike fair deals for both sides. While it is a cutthroat business, it is also a 52-week-per-year business where it does not behoove a distributor to force a deal that would cause a theater to lose money. There are many more misses than hits, and the distributor is likely to need a favor from an exhibition chain to open a movie that has poor reviews or otherwise looks in trouble.
Length of Runs
Another factor in booking is the length of the run. Arguably, this is the single most important factor other than the splits, and it influences the splits, given that they are tiered over the run. The following are the typical engagements:
■ six- to eight-week deals (less common)
■ four-week deals
■ two-week deals
Much of whether a deal falls into one category or not defaults to custom and practice. Certain towns (or locations) may be profiled as “eight-week towns,” and this is the standard deal for a picture of a specific profile. These weeks denote a “minimum run period,” and end up serving only as guidelines, both on success and failure. If a picture is still performing well and yielding returns greater than competitive/alternative product, logically it should continue to hold screens and keep playing. In the out weeks, there will be a floor for splits for which the picture will not drop below regardless of how long it plays. As noted earlier, a film such as Titanic, which played for weeks and months on end, while a boon to the distributor, is an even greater prize for the exhibitor—seats continue to be filled, and all at splits (if a 90/10 deal) favoring the theater. On the flip side, if a film is not performing, it may be kicked out early, with the distributor “granting relief” (see the section “Being Dropped”, page 184).
When booking theaters, distributors book both locations and then actual screens at those locations. To state the obvious, there are many more screens than locations, and for a major movie the ratio can be a multiple (e.g., 2:1). The number of locations/theaters is therefore the less interesting fact in terms of economics: the actual screens dictate both applicable house nuts/allowances, as well as the number of physical prints needed.
Prints can be very expensive, with an estimated average of approximately $1,500 per print for a major motion picture released widely through the studio system. (Note: Among the factors discussed above under D-cinema adoption is the opportunity to dramatically reduce these costs.) Of course, there are many variables that may go into a negotiation with a lab, including the type of film stock used and the length of the film (prints are still literally priced by the yard and deals are quoted in dollars or cents per foot). This does not sound too bad, until you run the numbers and extrapolate out worldwide costs for mega-movies that have a broad release, such as a Shrek or Spider-Man sequel. It is a trade secret how many screens were booked for Shrek 2 and Spider-Man 2, but let us assume there were upwards of 3,500 locations and take an average of two screens per location. That could yield more than 7,000 screens. For the sake of simplicity, assume some backup prints would be made for key locations, and the total print run was 7,500. The 7,500 prints multiplied by $1,500 per print is $11.25 million. And this is just for the United States, and does not include all the pre-print mastering and quality assurance services that would be on top of this variable figure—when Fox talks about converting fully to D-cinema and eliminating physical prints, the studio is eyeing millions in savings (eventually, post contributing virtual print fees) while marketing the improvements in quality.
As earlier noted, historically, films played longer and did not open as wide, which meant that prints could be reused; a film might open in a major city, and after it had played a while it would then move to a smaller town or location. The benefit to the distributor is there is no incremental cost. However, when a film opens very wide and a distributor tries to garner as much box office up front as possible, then the opportunities for reusing prints are reduced. Moreover, prints could be reformatted to be used internationally in same-language territories, allowing the “bicycling” of assets worldwide and amortizing these sunk costs over more runs. With the move to event films and day-and-date releases, these opportunities are also eliminated.
One net result of a major, wide, day-and-date release is to dramatically drive up the print costs—yet another factor that makes D-cinema, which can radically reduce these costs, attractive.
Partly as a consequence of multiplexes and booking multiple prints at a single venue, the concept of per-screen averages is often misunderstood and, at best, inconsistently applied or quoted. Trade journals and general industry lingo will often refer to per-screen averages, but the use of “screen” is a misnomer. Per-screen averages quoted in the trades and viewed for distribution decisions are actually often per-location averages.
It is not rocket science to compare competitive per-screen averages, as common reporting systems will report gross box office dollars and pretty accurately estimate the number of locations played. The math is simply total box office divided by number of locations. As a rule of thumb, an average of $10,000 or higher is extremely good, and a picture starts to lose momentum as the number dwindles into the low thousands and even less.
Although analysis is not taken down to the per-seat level, it is possible to back into the numbers and understand why this average is such a good barometer. Let us assume the following:
Assumptions:
■ Average ticket price: $7.00
■ Average theater size: 300 seats (probably high, but makes math easier)
■ One print per theater
■ Standard three-day weekend calculation
Potential Gross: $7 × 300 = $2,100 × 5 = $10,500 per day
Per Weekend
The screen average can then be segmented by these periods. Because the lion’s share of the weekly gross of a picture comes in on the weekend, this is the customary measurement for screen averages. The weekend is considered “three day,” meaning Friday–Sunday.
3 × $10,500 = $31,500 potential weekend gross
A film that has a $10,000 weekend per-screen average would indicate that fully one-third of all potential seats for all shows for the whole weekend were sold. At five showings per day, that takes into account 15 showings, which means that, on average, all of the primetime showings would need to be nearly sold out (assuming roughly five to six are at peak hours) to achieve this number, or that they could be 75 percent sold out with a smattering of audience at non-primetime dates.
When you start to see per-screen averages well above $10,000, both intuitively and empirically, it means that people are coming to the movie at multiple times (day and evening). This is generally only achieved with a wide demographic.
Of course, these numbers can be deceptive. The variables discussed previously can dramatically skew the results (as can demographics, where a kids movie will have lower average ticket prices). For example, the number of prints on average per theater (i.e., screens) will have the most profound impact, with the number of show times per day having the next most. Of course, the more showings and the more prints typically indicate a major film, and should boost the per-screen average. If a film opens very wide (large number of prints) and the per-screen average is not high, you will be able immediately to conclude the release is in trouble. The problem is that there may not be much time to adjust, especially if marketing expenditure has been front-loaded. Finally, the above assumes a flat ticket price, but children’s prices and matinees also influence the maximum potential gross (as can the new trend of premium pricing for 3D).
Interlocking
Interlocking is the practice of running two screens off a single projector/print. This practice is discouraged, and in most cases prohibited, by distributors. There are concerns about accounting, as splits and nuts are based on per-screen deals, and interlocking usually takes place for overflow demand rather than regular show times. There are also quality concerns, given the very nature of interlocking. Ultimately, fear of being mistreated overrides the economic efficiency of saving a print. In a true crunch, however, it is fair to assume that a blind eye may be turned. The chance to have another full house and additional gross is likely to hold sway at the margin.
Decay Curves and Drop-Offs—Managing the Release
Once the film opens, it becomes part art and part science in terms of managing locations and screens. What everyone focuses on are the week-to-week decays, in particular the decays from weekend to weekend. Regardless of how one defines the days of the opening weekend, for a decay curve you need a like-to-like comparison, and a Friday–Sunday benchmark is used.
It is unfair to refer to these charts as simply “decays,” because, depending on the release strategy, a film can actually increase from week to week. A picture that has a strategy of starting small and building an audience through reviews and word of mouth will expand locations. It may start at 100 theaters in major markets, and then wait to release wider nationally. The dream scenario is to open wide and have virtually no falloff, or even an uptick. This rarely happens, but occurred with Shrek in 2001, where its second weekend was nearly identical to its opening weekend (three-day to three-day, as one weekend was Memorial Day). This zero decay immediately indicated to DreamWorks that it had a major hit on its hands. The original Shrek grossed over $267 million, becoming the top animated film of all time at the point (yet another way to slice a record).28
Most films, however, follow traditional decays, meaning there is a relatively predictable pattern of drop-offs. The industry rule of thumb is that if you open well (namely, large!), a drop-off of approximately 50 percent in week two is anticipated. If the film drops significantly more, such as 60–70 percent, then one initially assumes that the marketing worked to drive people into the opening, but that the film may not have been well received—either word of mouth, or reviews, or competition took the wind out of its sails, and once this happens it is virtually impossible to recover. (Note: Given competition and accelerated box office takes, a larger drop-off may not mean the film is in trouble, but simply, in the case of a blockbuster or tentpole, that the first week was so large it will represent a disproportionate share of the total. See discussion below regarding acceleration of box office.) If the decay is in the acceptable range or even less than expected (this is what every executive is hoping for), then the goal immediately becomes to keep the decay from week two to week three within the same range, thereby keeping the momentum.
Depending on the percentage and the competition on the horizon, this is also when key marketing decisions are made. Do you run a hype or review advertisement (“Two thumbs up,” “Best picture of the year, according to …,” “Number 1 at the box office”)? There will usually be some marketing planned post release (called “sustain marketing”), but as films are becoming more and more front-loaded, much sustain marketing spending, especially in weeks past the first two or three weeks, may be allocated literally on the spot during the week.
Trend of Accelerated Decays for Blockbusters
The bigger the film and the bigger the opening, the steeper the decay will likely be up front. On Star Wars: Episode III – Revenge of the Sith, for example, the Thursday–Sunday “opening weekend” was over $150 million, with the following long weekend (Memorial Day) taking in $70 million at the box office. The pure three-day to three-day, however, was $108 million to $55 million (59 percent), representing an acceptable 50 percent drop.29
This is a typical pattern for a blockbuster, but one then hopes for the decay curve to flatten out. Because the numbers are so large, and there are so many prints and show times playing, there will inevitably be a large fall. As weeks progress, however, and multiplexes are only playing one or two prints for normal show times, and locations consolidate, the decay curve will hopefully flatten and the weekly drops will not be as precipitous.
As noted earlier, in terms of prints and multiplexes, this is where it is important to distinguish between locations and prints, and in terms of prints to distinguish between sizes of auditoriums within a multiplex (see “Move-Overs” below). When a film opens particularly wide and one sees a print count in the range over 7,000, there are almost always multiple prints in one location. Continuing with Star Wars: Episode III – Revenge of the Sith, on the weekend of June 2, 2005, for example, you could go to the movie listings and pull up a 16- or 20-plex, and notice that, in counting up the actual number of films playing there, it was only nine or 10, and similarly, in a theater half the size, namely an 8-plex, there were only six films playing. This is because event or would-be event films that were opened wide and had large demand played on multiple screens. One can assume that at the 8-plex playing only six films that both Star Wars: Episode III – Revenge of the Sith and Madagascar had multiple screens (two each); similarly, in the 16-plex playing only six films, one of the films may have had as many as four or five screens at one point, and potentially more on opening weekend.
Move-Overs
There is yet another variable to consider in understanding the print placements—the size of theater. In a 20-plex, for example, theater sizes can range from several hundred seats to a couple of hundred seats or less. While not all theaters are equal, similarly “not all prints are equal” in terms of potential gross within the complex. Thus, when a print of a film opens in the largest screen, after it has run for a week or two, demand will likely wane and the auditorium will play to fewer people per showtime; in the extreme, which happens quite frequently, a print will move from playing to capacity to sparse crowds fairly quickly. Keeping the print in the theater may make sense to the distributor who wants the largest potential gross (“I don’t care if it’s empty during the matinees and mid-week Joe, ‘cause I want that gross on the primetimes …”) in some scenarios. However, this will not make economic sense if the print/distributor is bearing the house nut; in fact, the print can lose money if the nut is significant.
The larger the auditorium, the larger the nut, so when demand wanes, the print “moves over” from a larger to a smaller screen. This has two benefits. First, as just noted, the smaller screen has a smaller house nut. Second, moviegoing is a social experience, and most people prefer to have a full house rather than an empty house—it is inevitably the crowd reaction and the shared experience of hearing screams, cries, quick intakes of air from being shocked, and even the occasional funny heckle that is part of the magic of the theater and makes seeing a movie in the theater fun. (Note: This also partially explains the preview and midnight screening crush of attendance, as it is just as likely that people want to see the film in an atmosphere charged with the same excitement they feel than that they have to see the film early. It is more the electricity and shared experience of the moment that likely drives most people than the bragging rights that they saw it a few hours or days ahead of someone else.) That social, collective experience simply cannot be replicated at home, no matter how nice a flat-screen TV and home theater environment someone has created—in the age of social media, where e-interactions masquerade as being social, but in fact can be experienced in isolation, Hollywood always touts the real collective social experience of theatre-going (also, please no texting or posting once the lights go down!).
Move-overs thus have multiple benefits to both parties, for economically having full auditoriums is beneficial to both the distributor and exhibitor. Similarly, if a multiplex is playing a film on multiple screens, and the percentage of seats filled per screen per show time starts to drop off, then a print will be dropped and the film shown on two screens rather than three, increasing the average capacity filled per showtime. Of course, the distributor wants to ensure that there are still sufficient play times for people to see the film, and it is the balancing of nearing capacity versus not turning away people (who may not return—carpe diem is the MO) that becomes the art of booking.
Finally, it is worth pointing out that all of these issues are tied to success. In the more typical pattern, a film will play one screen per theater location, and hold on for dear life to stay as long as possible before becoming dropped.
Being Dropped
Inevitably, every film leaves the theater, and it is hopefully after several weeks rather than several days. The fight to hold screens can be vicious, and several factors influence a film’s staying power. These key factors include:
■ The weekly gross of the theater. What was the film’s box office the prior week and weekend?
■ The weekly gross of the film relative to the competitive titles playing in the same complex. Are there other films in the theater (assuming it is a multiplex)?
■ The quantity of new films opening in the week, and the perceived strength/demand of the new product. Is there an expected blockbuster opening that will command multiple screens in a multiplex?
■ The number of screens in the complex.
■ The number of weeks the film has been in the theater. Is it the first or second week, or is it now into multiple weeks being played?
■ The terms. What is the rental percentage being asked by the distributor, and is there an applicable house nut?
■ The contractual terms. Is there a minimum booking period?
■ The quantity of competitive films in the marketplace that are “grossing.” Are there several pictures holding over with strong to respectable grosses, in addition to new films opening up?
■ What other pictures the studio has in release. All theaters want to keep each of the studios happy, and while there are no allocated slots, it may be difficult for Studio A to keep multiple screens (when some are marginal performing pictures) at the expense of a rival studio securing a screen.
■ Studio pressures/expectations driven by direct economics—achieving performance thresholds, which could be tied to economics, such as achieving a box office number that may trigger improved economics in a downstream revenue (e.g., pay TV output deals tiered to box office thresholds) and by indirect economics tied to relationships (e.g., fulfilling promises to the producer/director/actor—“Are you fighting for my picture?”).
■ What investment the studio has in the film. Not all pictures are equal in terms of the studio’s financial stake, and while every studio will tell you that it is fighting for every cent on every film, it is natural to question whether there is a bit more fight in a film where the studio has a bigger stake.
These are the type of factors influencing the decisions. They comprise a unique mix by blending straightforward economics, cutthroat competition, allocations (within and without groups), politics, ego, and differing agendas. A studio is very conscious both of relationships and performance, but when counting relationships, they are truly in the middle of two parties they need to please: the exhibitor and the producer. Although distributors have a tremendous amount of clout (without them, you simply do not get into the screens/theaters), they are between a rock and a hard place. During a release, they need to please the film-maker who only cares about his or her movie and maximizing its results (at the expense of anyone else’s film currently in release) and the theater chains who could care less about a particular film and only truly care about whether customers are filling the seats.
Tension arises because the factors weighed by the two sides (theater versus distributor) are dissimilar. The distributor is weighing a nearly impossible matrix of agendas, ranging from pleasing a star, to recouping an investment, to juggling multiple pictures within a slate, to maintaining pole position relationship treatment with a particular exhibition chain of theaters. The exhibitor, however, has relative tunnel vision focused on attendance: they can remain emotionally neutral and have virtually no reason to care about the particular film, only focusing on whether people come and the theater is full (taking their split and raking in concession money).
Despite the potential for a dizzying complex matrix, the end result of what stays in a theater is rarely a complex balancing act. Instead, it is absolutely Darwinian, and the strongest pictures survive. After every weekend, the distributor looks at a report of how its pictures performed and how they performed versus the competition. Box office information is freely available, and there is little argument as to relative standings. In an 8-plex theater, the local booker and theater are acutely aware of their ranking. If there are eight screens, and Studio A has one picture that came in last (eighth among eight), then that picture is going to get dropped in favor of a new picture coming into the market (or adding another good performer in the market that may not have been booked originally). The one exception to this rule is that by contract, as well as industry practice, virtually every major studio picture gets the benefit of the doubt for two weeks. If a studio is opening a movie with a major star or for a major director/producer, it will secure at least a two-week run, and will be hard pressed to pull it before this minimum period.
The survival-of-the-fittest mentality can be tempered by a few factors, such as the ability to move over. Because of the “not all screens are equal” factor, a film that is underperforming may still hold in a smaller auditorium because its gross remains strong enough to stay in the complex relative to competition. Moreover, all of the factors previously stated then can, and do, come into play at the margin. Most of the decisions are clear-cut. If the gross in a complex is $1,200 for a week and all other films are $3,000 and above, there is not much room for the distributor to argue; moreover, the smaller the complex, the easier the decision. A single screen or complex with six or fewer screens can ill afford to carry its overhead without performing product—they need to attract bodies and cannot amortize across product. If a movie is not working, they need to move on, and move on fast. However, with larger complexes, there is likely to be a range of performances, and it is therefore easier to accommodate relationships. If you have a 16-plex and Disney or Universal needs a screen, is the exhibitor going to shut them out on a marginal picture when they have an every-week of every-year relationship? If the picture is truly a disaster, then maybe, but if the distributor is pleading, then how much of a sacrifice is the 120-seat screen when there are 15 other screens booked with (hopefully) better-performing titles?
At the margins, studios may start splitting show times to stretch a picture’s run. As the picture declines, it may play to specific demographics where splitting prints may make sense for a particular week: “I’ll play X in the matinees and Y in the evenings.” This is a band-aid solution and rarely holds over into multiple weeks, but can make sense in the short term when there are tough calls. Essentially, this is a “something is better than nothing” mentality, and having capitulated halfway, you know your run is on a short rope. However, in the Darwinian world, once you are out, you are out, and there are probably few to no incremental costs to staying in the extra week—the print is already there, and every incremental dollar of box office helps amortize that cost and climb toward profits.
Decay Curves and Predicting Box Office
There is a relatively predictable pattern to performance, and, as discussed previously, the name of the game is flattening out the decay curve so that the week-to-week drop-offs are as small as possible. All films have a decay because the nature of the business is to eventize a release, and marketing has to be somewhat, if not fully, front-loaded to create the awareness for people to attend. Word of mouth (which, by the way, feels like an anachronistic phrase in the era of texting and social media, but which I am assuming will continue to be used by the industry to capture the broader context of spreading opinions by communicating verbally or electronically) can build a film that is opened small and then expands, but one can argue that this is merely a bell-curve release pattern strategy, and the decay starts being measured from the peak.
Accordingly, a decay curve is built from both expectations and by comparing drop-offs to comparable titles. By comparable, it may be that a film is compared to another title of similar genre with the same star: How does a Woody Allen movie or an Adam Sandler comedy decay? If the film is part of a series or franchise, then the task can be easier: How will Harry Potter 3 compare to Harry Potter 2? Thus, a studio may build a model taking the best comparables it can find and look at the week-to-week decays of that film; namely, by what percentage it dropped week to week in weeks X to Y. The film being measured will have to have its own base, but once it has a starting point (opening-week or two-week data), then it is possible to plot its performance against like titles. Week to week, you will measure whether you are above or below the imputed curve.
A challenge for marketing will be to keep the baseline up and keep stimulating the baseline with spikes of activity. The theory is that because a decay is inevitable, the higher the base, the higher the net result. If you started from $10 million versus $8 million and were likely to decay the following week by 40 percent in either scenario, then the following week would be $6 million versus $4.8 million (an incremental $1.2 million). Accordingly, if the prior week had been targeted at $8 million and there was marketing activity/expenditure green-lit to boost box office achieving $10 million, the net impact is hopefully much greater than the $2 million; instead, it is the $2 million and the gap in week two (incremental $1.2 million), plus the incremental benefit in subsequent weeks.
This all assumes, however, that the decays are consistent (which is not the case) and that you can straight-line the falloff tied to the higher base; in fact, no one really knows whether a program will truly raise the base in a trailing manner. Additionally, no one really knows whether the impact will be temporary and there will be a larger drop-off the subsequent week where the decay is catching up to the prior equilibrium and tracking more closely to the film’s “true demand” rather than the temporary demand that was stimulated.
Measuring the payoff or break-even is therefore tricky, and the easiest benchmark is to look at the isolated period. Will the incremental costs spent this week be recouped from the lift this week in box office and resulting rental dollars? If the answer is yes, then this is a pretty good bet, for there is a payoff with the potential upside of having lifted the base and gaining the incremental value in subsequent weeks (i.e., gaining the $1.2 million the next week).
Finally, it is worth noting that while the key decay curve to track is box office, it is also possible to track decays of both theater locations and prints. The final tools will therefore include a box office decay chart and a print and theater decay chart (Table 4.3).
Week |
Weekly Gross |
Cumulative Week Gross |
Number of Theaters |
Number of Prints |
Week 1 |
||||
Week 2 |
||||
Week 3 |
||||
Week 4 |
||||
Week 5 |
Residual Impact of Theater Ownership
A final wrinkle in the mix is theater ownership. It is natural to assume that a theater owned by Warner Bros., for example, is likely to give preference to a Warner title. Despite the breakup of vertical integration and the consent decree (see page 149, “Consent Decrees, Block Booking, and Blind Bidding”), as antitrust rules became relaxed in the 1980s under the Reagan administration, a number of studios began to acquire ownership interests in theaters again, in particular Warner Bros. and Paramount (Viacom). At the margin, this can influence a picture’s placement, as issues of personal theater preference are likely to lose out to the pure economics of whether a rival studio-owned venue will afford you the best chance of a long run (especially if you know a competitive film from that rival studio is set to open in X weeks).
The international market has grown to a point where it is common for a major studio release to have more locations booked internationally than domestically (though the numbers are relatively close); additionally, the international bookings may be more profitable on a per-print average. I have not seen a direct study on this, but it is empirically true: if the print count is relatively even, and international box office is a greater percentage of the worldwide box office than domestic box office, then each international print (on average) must yield a greater return/box office gross.
The reason for this is largely due to the clustering of population in urban centers and cities versus the diffuse, relatively rural and suburban population in the United States. It also suggests that there is international growth potential, although the shift in media and uptake of VOD and Internet is likely to encroach too quickly to let this theoretical experiment play out to its otherwise logical conclusion.
The international theatrical market has lagged behind the United States in a few areas, but that is now quickly changing. The U.S. market, accommodating the vast suburban sprawl that has come to typify the dispersion of population, had a boom in the 1990s building multiplexes. While this trend was mirrored internationally, the phenomenon of 16- and 20-plexes did not grow at the same breathtaking pace. In retrospect, this was good, for, as earlier discussed, virtually all the major U.S. chains filed for or flirted with bankruptcy. Cinemas internationally reflect the local culture, and while there is an element of standardization and copying, there are many cinemas in Europe, for example, that maintain the character of great art houses (though even these, in many instances, have been refurbished and split into multiple screens).
One interesting trend is that digital cinema took off more quickly overseas than in the United States. To a degree, this is a result of lag, for certain territories that recently or are just now upgrading are skipping intermediate steps and installing D-cinema. This is especially true in Asia, and in particular China. One has to be careful, however, in defining D-cinema as, in the rush to enter the market, a number of locations (at least initially) were utilizing projectors below the 2K projector standard endorsed by most studios as a minimum resolution.
How a Property Travels
It is important to bear in mind that each film is unique, and the genre, star, and director can have profound influences on how the particular picture will fare in a particular territory. An American comedy may not travel well in one place, an action star may have disproportionate popularity in a certain country, and a franchise may, for reasons obvious or inexplicable, be relatively strong or weak versus its domestic market or even a neighboring territory. In some cases, the reason may be linked to a local star, and in others it may be that a scene takes place locally, some of the filming may have taken place locally, or the subject matter may strike a particular chord culturally. In many cases, however, it can simply be a mystery why a film works better in one country than another; this is the job of the marketing division, and the litany of excuses is longer than the list of why a film succeeds.
The animation industry is a particular curiosity. It became the trend with Pixar and then DreamWorks Animation and Blue Sky (Ice Age) (and now a few others, including Sony) to cast high-profile stars as voice talent. However, when Tom Hanks does not play the part in the German dub, nor Eddie Murphy in Spanish, then those actors truly do not ever appear in the film. The marketing hook and performance that was so pivotal to the domestic campaign (and arguably success) are simply nonexistent. Somehow, this does not impact performance to the extent that one would guess it should. Perhaps the clout of Hollywood and the brand expectations from these studios are able to overcome this hurdle, and people come and enjoy the film anyway, in a classic sense of “not knowing what they missed.” This may simply be a testament to the film’s overall strength, or to the fact that when watching, viewers focus on the character and do not necessarily associate the character with a particular individual/voice. In certain territories, the voice-over actors tend to repeat, such that the person who dubs for Daniel Craig or Pierce Brosnan in Germany tends to do so for all their films; in essence, a permanent stand-in. This is the voice locally associated with the actor, and accepted. (Note: Because many want to see the original version, certain cinemas in major cities will play “OV” English language prints.)
The largest European markets include the UK, France, Germany, Italy, Spain, and Russia. The number of prints used for the markets is in the same order of magnitude for the UK, France, and Germany, but this does not necessarily correlate to box office performance. The number of prints may often be the highest in Germany due to its dispersed metropolitan centers. Unlike the UK, where a couple of cities such as London can dominate, Germany is more akin to the United States, with many “states” and major cities (e.g., Berlin, Munich, Frankfurt, Hamburg, Cologne), and requires a higher print count. For most U.S. films, however, the U.K. box office will be larger than the German box office. France, despite the concentration of population in Paris with its rich film tradition, also tends to have high print counts, frequently exceeding the UK. Print counts may be, from highest to lowest: Germany, France, and the UK, while the box office could be exactly the opposite, from highest to lowest: the UK, France, and Germany.
This potentially inverse relationship between bookings/prints and box office revenues simply highlights some of the challenges in managing and maximizing contribution from international territories.
Asia/Pacific and the Rise of China
The largest market for major Hollywood films for years was usually Japan, followed next by Australia and then South Korea. However, the explosive growth of China has catapulted it into the second biggest market in the world. In an article describing a Chinese group’s purchase in May 2012 of the U.S.’s second-largest theater chain, AMC Entertainment, the Los Angeles Times noted: “Last year, China saw a 30 percent increase in box office sales to $2.1 billion. This year it passed Japan as the biggest foreign market for Hollywood films.”30 Fueling and tracking the growth in revenues from China is its phenomenal screen growth. Screens have doubled in the last five years or so to approximately 11,000, giving it the second largest screen count in the world next to the U.S. These factors, plus the obvious growth of the middle class and consumer culture led the Economist to predict: “China’s box office revenues may overtake America’s by 2020.”31 Already, China’s box office is 25 percent of that of North America, hitting $2.7 billion in 2012 (versus North America’s $10.8 billion), surging 37 percent from 2011.32
An example of the market’s might was the April 2012 release of Titanic 3D, where the 3D rerelease of the original blockbuster broke the record for all-time opening, with an initial take of $67 million. To put that opening into perspective, the film had earned $44.5 million in the U.S. over its first two weeks,33 and the entire international opening in 69 territories garnered $98.9 million.34
I asked Mary McLaren, chief operating officer of theatrical for 20th Century Fox, to put the growth of China’s market in perspective, and she advised:
The growth of China’s box office is a phenomenal success story. In 2006, China was ranked number 12 in international box office; in 2011, they have moved up to become the number-two market internationally. When Fox released Star Wars: Episode III – Revenge of the Sith in 2005, China represented less than 2 percent of the international box office, delivering just over $9 million; today, the market routinely contributes more than 10 percent of a film’s international box office. China was our second-highest-grossing international market on Rise of the Planet of the Apes, with $31 million in box office, and the number-one international market for both Avatar and Titanic 3D, delivering staggering box office results of $203 million and $148 million, respectively. The good news for the industry is that the trend looks to carry on as digital screen growth continues to expand, with digital screens doubling and 3D screens nearly tripling in the past 16 months.
The growth of the Chinese box office and new stature as a top market is more remarkable when considering how few foreign films are released into the market each year. The Chinese have historically enforced a strict quota system, limiting the market to 20 foreign films per year. After a meeting with U.S. Vice President Joe Biden and the waiting-in-the-wings future premiere of China, Xi Jinping, in the U.S. in February 2012, the countries announced a raising of the limit to 34 per year, with the caveat that the additional 14 movies must be exhibited in 3D (or other large-screen format). Seeing the next gold rush, many in Hollywood are looking to circumvent the system, seeking coproduction deals that would skirt the quotas if the films are classified as local. It remains to be seen how effective studios and others will be in implementing coproductions, for beyond the routine complications (see coproduction discussion in Chapter 3), the level of control either directly or informally ceded in the China context may be greater than most are willing to accept; typical coproduction deals revolve around financing and balancing creative and economic decisions among partners, but in China coproduced properties are further subject to censor review and control.
Together with a relaxation of quotas, the Chinese government also adjusted the rules in terms of box office splits. The above discussion, in terms of film rentals and different structures, never applied to China, as the government, along with limiting foreign films, also managed a controlled system that dictated foreign distributors participated in a share of ticket sales ranging from 13.5–17.5 percent. For the new 14 3D or IMAX films permitted, the government now raised that percentage to 25 percent.35 Chris Dodd, the chairman of the MPAA, remarked on the landmark changes: “The industry has been living with the numbers in terms of percentages and quotas for 20 years … it begged for a conclusion.”36
Unlike the situation in Europe, the number of prints in Asia generally tracks revenues, with the higher print count representing the larger market and corresponding higher box office.
Latin America
By far the largest markets in the region are Mexico and Brazil, with Mexico dominating both in terms of box office and prints.
Boom International Markets Driving Increase in International B.O.
It is because of the phenomenal growth of major markets such as Russia, India, and now especially China—none of which were in the top 10 markets, nor even close to them, a mere handful of years ago—that the overall international box office, as discussed above, continues to grow as a percentage of global box office. The MPAA, in its 2011 Theatrical Market Statistics report, noted: “International box office in U.S. dollars is up 35 percent over five years ago, driven by growth in various markets, including China and Russia.”37
As a follow-on, its 2012 Theatrical Market Statistics report published total B.O. estimates for the top 10 international markets (Table 4.4).
The unwritten rule of the industry is that “the theater keeps the popcorn.” For decades, producers, distributors, and everyone else in the food chain of profits has tried, without success, to add concessions into the revenue base derived from theatrical exhibition. The “popcorn,” however, is considered sacrosanct and is reserved entirely for the exhibitor. As discussed previously and in Chapter 10, the revenue base upon which participations and profits are calculated includes only the distributor’s cut from ticket sales (i.e., film rentals, as previously discussed). The theater owner’s cut from the box office and the concessions are a vital part of the macroeconomic picture, but these revenues are excluded even from the baseline of calculations.
Table 4.4 2012 Top 10 International Box Office Markets, from MPAA Theatrical Market Statistics 201238
Territory |
2012 Box Office (US$ Billions) |
China |
2.7 |
Japan |
2.4 |
UK |
1.7 |
France |
1.7 |
India |
1.4 |
Germany |
1.3 |
South Korea |
1.3 |
Russia |
1.2 |
Australia |
1.2 |
Brazil |
0.8 |
■ The online and digital world is profoundly influencing the release strategy and timing of theatrical distribution: piracy concerns, exacerbated by file-sharing services and the potential for ubiquitous initial instant access to a film, are driving studios to release films “day-and-date” worldwide.
■ Sites that aggregate nationwide critics’ reviews, such as Rotten Tomatoes, are providing summary scorecards, theoretically hampering the ability to open a movie slowly and build “word of mouth”; the nature of cumulative and instant scorecards, coupled with mass and new immediate feedback from social media and microblogging sites, further accelerating marketing timelines and putting additional pressures on box office openings.
■ The online world affords a new, and still relatively untested, premiere release window, tantalizing some who could create sufficient demand to bypass the historical system and test online pay-per-view models.
■ Digital cinema can deliver pristine quality and, in the long run, lower cost distribution—its promise is finally being fulfilled, with adoption rates soaring globally over the last few years, to the point that studios are beginning to phase out the use of physical prints. Although this movement developed independently of the online world, growing competition from other media remains relevant in efforts to improve and differentiate the theatrical experience (which has also stimulated the growth of 3D), while also lowering its cost basis.
■ See also Chapter 9 for impact on marketing in the theatrical market.