Coming out of the Dark
Once upon a time in the dark ages when we relied on physical distribution, games had to be completed and ready to go before they could be flashed onto a ROM or pressed onto a CD. In that era we were lucky if the game even connected to the internet for an occasional patch, let alone being able to be continually linked back to our own game servers.
Since the advent of reliable connections, even (largely) on our mobile phones and tablets we have been able to make really intelligent use of this stream of information, not only to create synchronous experiences, but also to capture data on the real behavior of our players and adjust the game experience in targeted ways for specific groups of players.
Connected servers can receive metadata from our various devices containing named variables associated with a specific player session and we can then use that captured information to see exactly how real people actually play the game we lovingly created. The more we do this, the more we discover how wrong we can be in our assumptions and we can then find ways to make fine detailed iterative improvements.
Knowing What to Measure
Data can tell us all sorts of things. How much money we are making? How many players do we have? How many we have ever had? Different terminology and acronyms are thrown about to describe metrics we can use to assess the health of our game.
Some of the most used terms include:
- ARPU—average revenue per user (usually monthly).
- DAU—daily active users.
- ARPPU—average revenue per paying user (usually monthly).
- ARPDAU—average revenue per daily active user.
- MAU—monthly active users.
- MAU/DAU—a percentage that helps assess the engagement level of your game.
- D21/D7/D30/D90—a percentage of registered users still playing after the specified number of days.
- Churn rate1—the opposite of retention and usually measured by the total customers you had at the beginning of the month divided by the number you had at the end of the month, excluding the new customers gained that month. This number is closely related to the lifetime of a customer and if you have a 25 percent churn rate each month this implies that the average lifetime of your customers will be four months.
- K-Factor—the virality of your game; how many people an average player recommends multiplied by the percentage that downloads the game.
- Conversion—the percentage of players who have ever paid; often further broken down into whales (highest spenders) and minnows (lowest spenders).
- CPA/CPI—cost of acquisition or cost per install describes how much you have to spend in order to gain one player on average.
- LTV—lifetime value, or how much revenue on average each player generates before they churn.
Beware of Vanity
All of this stuff is good for your business and as a designer these metrics also help you understand how well your game is doing. However, what’s most interesting is how these numbers change in response to your ongoing adjustments and upgrades to the game. I’m not suggesting that the numbers don’t matter of course, these are the variables that tell you whether you have a viable game or not. However, there is no absolute right number, as long as you are making more money than it costs to build and operate the game.
These metrics allow us a way to track how much effect our incremental improvements over time are having and the direction (positive or negative) they take each time, which is what matters. From a design perspective we need to avoid falling into a vanity trap. It might be great for your marketing team to be able to talk about your total registered users, but unless you keep track of your D30 retention you could find yourself in real trouble. All-time statistics, like total registrations, only ever go up and we can confuse that with success. Talking these things up might distract people such as data-confused journalists and investors, but beware, as most of the credible ones will see that for what it is. Instead we need to use data to help us improve our designs, so let’s look at a number of techniques that everyone should use.
What Game Are You Playing?
The first technique we will look at will consider how we find the data we are missing, that we can’t collect. That might sound odd, but think about this. We can only capture things that a player actually does. With Apps we generally can’t capture when they log out of the system, unless we are really lucky and they choose to press the quit button. Most people don’t. They switch between apps and turn off their devices, which means that our game almost never has the opportunity to upload the data of the closure of a session. This becomes particularly relevant when a player doesn’t ever return and we never get the last post of data, i.e., when they have churned.
It’s actually not that easy to know with certainty whether someone has actually churned or not. But it is likely that if they don’t return within a month that the habit of playing has broken and usually we won’t see them again. There are exceptions. With PlayStation Home we found that a large percentage of users came back to see what new content we had several months later, which is probably a factor of its role as a part of the console experience.
Looking for Trends
We can’t know for certain if players will be coming back, but we can look at trends. For example, where was the last data point the game did best and does that seem to be a significant dropping off point for other players? Better yet, if we can map the first-time user experience against specific stages of the game we could post relevant data points to measure what stages those players got through and where they dropped out. If we are systematic about mapping this flow then we will be able to identify where the player failed to reach the next stage of the game and this gives us a very clear idea of where we might have a problem.
Comparing the progress of all of our players allows us to plot the behavior of thousands of players across the user journey and will tell us how significant an issue the problems we identify might be. This makes it easy to prioritize what we do next.
Filling the Funnel
This kind of report is called a funnel analysis2 because when drawn vertically it always ends up looking like one. More people go in at the top than trickle out of the bottom section, which will progressively reduce in size as players drop out at each stage.3
There is a problem with this, however. As we make changes to the platform we will inevitably impact the flow of the players through the game and we need a method to test the effectiveness of such changes. The best thing to do is to break down players into sections or cohorts of players with similar characteristics or who experience the same essential service over a specific time span and then compare the behavior between different groups. For example, we define one cohort of players as those who started playing after we released version 2.3 of our software and measure them separately from the cohort of players who started with version 2.4.
Tracking Players by “Days Since Download”
This ability to filter out comparative groups of players can be extremely powerful and allows developers and designers to get really useful analytical information based on actual behavior rather than just asking for feedback. Personally, I like to use a slight variation on cohort analysis. Rather than collating groups based on an actual dates—e.g., all users who started playing after build version 3.12.1—I like to compare all players using that version based on the number of days since each one started playing. In other words, I want to see how long each member of the cohort compares from the same baseline of behavior rather than the release data of the version. Why? It’s all about asking the right question. Focusing on the version of the build players are using is useful to allow us to compare that release and its performance against other releases. However, it assumes that players of that release are somehow identical. They won’t be. Their commitment to playing our game will vary. That doesn’t matter if you are only interested in the release performance. However, if you want to illuminate players’ attitudes it helps to compare their individual duration of play. Of course you could do a separate cohort based on each day, but that not only risks data overload but also makes it harder to compare like with like. Taking players of the same build and then looking at how quickly they drop out based on their personal duration of play helps us illuminate more detail of what may have gone wrong, and the funnel analysis will tell us where. Asking the right questions in this way makes it much easier to identify how the lifecycle process actually works in our game.
What’s Relevant?
Making the right choices about what data is relevant to capture or not is essential if you want to be able to make the right decisions about how to continually improve your game. We could just capture everything, as we don’t know what will be relevant in time. But that can become costly to store and can also can lead to you becoming blinded by the volume of data, unable to isolate the relevant information. However, at the same time you don’t want to capture too little because often we don’t know what we don’t know. So we have to ensure that we store as many potentially relevant data points as we can, the last thing we want is to discover a correlation to performance based on an attribute we don’t already capture. This creates a dilemma that most designers have no experience in solving, especially if you come from the console world. However, there are models out there that can help us to get our heads around this conundrum.
Food For Thought
For me I like to use a model from the food industry, which was first developed in combination between the Pillsbury Company, NASA, and the US Army Labs to provide safe food for manned space expeditions. It’s called hazard analysis and critical control points (HACCP)4 and is widely used in the food industry to this day. There are seven principles:
1. Hazard Analysis
Identify the potential safety hazards and the potential preventative measures. In the case of a game, this is generally to identify the experiences in a game that can lead to players churning from confusion, frustration and boredom. We then need to know what we can do to identify when those moments happen and how we can improve those when they occur.
2. Identify Critical Control Points
These are the critical steps or procedures in the manufacturing process where making a change will have a significant impact. For me one of the best examples in the food industry is when to test for metal content accidently dropped in the packaging or food. There is no point testing for this early in the manufacturing process as the machinery itself may subsequently introduce metal into the food (i.e., things drop off). So you leave metal detection until very late in the process. For our industry we need to consider the game as a flow and identify what level of detail becomes valuable to signal a decision made by the player, not least as we have to balance data-posting against the processes of the game. It’s unlikely that uploading every footstep made by a player in a game will be useful. However, this will vary for every type of game. For instance a first-person shooter noting the location of the player every ten seconds as well as, perhaps, every shot they make or when they take damage. This information could be used to create a heat-map to see how they interact inside each level. For an MMO this would probably be overkill and it might instead be more sensible to simply capture the players’ location every 30 seconds as well as the location of every combat encounter and its outcome.
3. Establish Critical Limits For Each Control Point
In the food industry there might be some tests where it’s not as simple as pass/fail for any given hazard so the process will consider whether the degree of a hazard is considered significant or not. Similarly in the games industry we want to identify how significant each of our data points are and establish limits that allow us to know if we are meeting our objectives or not. It’s hard to establish what we think this might be until we go live, however it’s often worth looking at data captured during free testing to establish a baseline of expectations. This will quickly be replaced by the real data of your first cohort of course, but having a baseline allows you to at least have considered your expectations.
4. Establish Control Point Monitoring Requirements
This is the stage the food industry looks at the tools they have to measure the problems and then will define how these are to be implemented. In the games industry we will have to build into the game the ability to post and capture the data points we have identified as critical control points and to establish how we will report on these issues in a format that the designer can use.
5. Establish Corrective Procedures
In food this is all about working out a systematic method to respond when one of these hazards occurs and how they then go about fixing the problems before the issue leaves the factory. In games we need to establish how we manage and interpret the data we have captured and feed that back into future updates of the game or perhaps use existing service management tools to communicate the problem to players so they can avoid the issues.
6. Review the HACCP Process
Finally it’s important to review that the process you have set up is working properly for its intended purpose. There is no point following a procedure that doesn’t actually achieve its goals.
7. Establish a Record-Keeping Process
Documenting what you have done is essential, especially in the food industry where this process is regulated. We also want to have appropriate records in games, not least as it’s important that we learn from our own history or be doomed to repeat it.
Thinking like this means that we have to take a holistic view of our game and look for the process flows that each player will go through. It’s an enormous area and to do it full justice we need both a good handle of statistical mathematics and to take time to understand what each data point means from a player perspective. However, what I hope to do in this short chapter is to get you started thinking about what data can do and how you can get started.
Data Protection or Too Much Information?
Once we have established the data points we want to collect we then need to take some time to work out the data model that will allow us to most efficiently collect, store and retrieve that information.
Using the HACCP model we can work out the information we want to capture but we need to work with the development team to turn this into a conceptual data model. That means looking at the data elements and defining them in terms of what type of information they are and how that information relates to other data points. So if we have a player entering a scene we need to know the player’s ID, the session ID for that game, and potentially the level or location they are interacting in. We don’t need to know that player’s real name for the purpose of improving the performance of the game, although there are places where we do need to identify them in some way—for example to confirm their purchases, to display their high-scores, or in relation to moderation purposes. Outside these areas we have to be very careful about real names, even alias names. There is a legal obligation in most countries to avoid creating any identifiable information, especially if they might be children, as part of our data protection responsibilities. This is an area where it’s always worth getting legal advice and making sure that your terms and conditions of play cover your use of data. Collecting data against a PlayerID is a good start, but you will still have to be careful about how this is made available and indeed largely you should prevent its use in reports at all, except where absolutely necessary for the functioning of the business. We usually don’t need the details of the individuals to get useful information on performance so this isn’t really any loss from the point of view of managing the game. We are more interested in the relationships between each data point and we need consistency in how they are captured, for example each player will only have one PlayerID, but they will play many sessions that might include multiple levels, which may also include interactions with other players and multiple plays each with different results for each player.
Infer What You Like
We also don’t need to capture every piece of information, just the variables that might change. We can infer other information from the combination of these variables and the known reference data. For instance we don’t need to know where in a level we find a specific corridor, that location is static, contained in the level map. We just need to know the XYZ coordinates. This kind of unchanging information we call reference data and we can use this to infer more detail about the events we are capturing. It’s not that these data points never change but any changes to them happen at predictable moments, such as updates, so are outside the frequency of play.
Draw Yourself a Map
Drawing these out into boxes with lines connecting them5 can be very useful as it also helps us not only map out the flow of our game but also helps to rationalize what data points we actually need to capture and what we can infer through the report. For example, we might want to capture how many locations a player visits in a game session. We can capture the date/time of entry into a given SpaceID by a specific named PlayerID and using the same SessionID. This string of data tells us everything we need to know on the database in order to work out a specific player’s path through the locations in the game over any given playing session. We can use our reference data to identify the map used in the SpaceID and cross-reference other players who were also in that location (identified by the SpaceID) during the same session (i.e., SessionID). Of course, the report we create from this data doesn’t show the actual PlayerID, instead we show the total number of players who pass that point in the game and we can even compare this process across different cohorts.
It’s hard to stress how useful it can be to take the time to map out this data. Not only does it make it much easier for your coding team to translate your data requirements into a database structure, it also allows you to make sure that you really understand the flow of the game, which feeds back into your game design. Part of this analysis should be to work out how frequently this data will be uploaded and how much structure and flexibility you will need to create reports. All of these factors affect the costs, complexity and reliability of the solution you will need to get useful results.
Losing My Connection
You also have to consider what happens when players are not connected. Are they still able to play? Will the game store the data in cache? How long will it do that for? What happens if that gets corrupted? Too many developers assume that players will find themselves in the best possible connection all the time, but we all know the reality is that there are always black spots and being unable to connect at times is something we cannot avoid. However, how can we be running a service if we allow the player to continue playing while they aren’t connected? Are there ways to allow the game to continue, even at an impaired level? We don’t want the lack of connectivity to break our carefully created, regularly repeated playing habits. This creates lots of questions about how the client-side of the software (the part run on the device) works and how it interacts with the server side (the part that runs on the network). How much data can we keep in storage in the cache, how long can players continue playing without a network connection? How do we encourage them to reconnect when there is data coverage? How do we avoid players manipulating the locally held data? What happens if players change the time/date on the device?
Connected Experiences
Similarly, we have to think about the server; what happens if too many players update information at the same time? How do we separate live operational data from historic data? How do we ensure that the reference data for a game is updated alongside other updates to the platform? What about malicious hacker behavior? How do we avoid a “denial of service” attack where we get thousands of spurious connections every second? How do we avoid a “man-in-the-middle” attack where someone intercepts the output from a game to our server? There are lots of potential problems. Many of which are resolved (or at least minimized) by using HTTPS6 posting (which uses SSL validates that the source and recipient are accurate and encryption to protect against eavesdropping and tampering) but that comes at a cost in terms of performance.
Designers often underestimate the complexity and overestimate the usefulness of using specific data points. Developers on the other hand often over specify the robustness of data platforms, but we do need to consider the security, flexibility and costs involved in such solutions.7
Expanding Possibilities
Once you have captured your data, the possibilities explode. We can interpret historic data using techniques using prepared reporting tools or even directly using SQL (Standard Query Language) to “slice and dice” the available information into nuggets of insight, such as the funnel analysis we have already mentioned, but in addition we can look at real-time data. This requires a very different reporting system but can provide brilliant information and an instant view of what players are actually doing at that moment in time. This type of analysis is really useful for live operations teams rather than designers specifically, however.
To Be or Not To Be
There is one technique that has radically changed the landscape, however. AB testing. In this approach we offer up to different cohorts of users different versions of our game. The differences can be very simple, perhaps different colored buttons on the “buy” options. Indeed it’s important that these changes are discrete and isolated from each other, although there is no specific limit on the number of alternatives we can test for each discrete change. The idea is we see the responses of the players in the cohorts we have selected and determine which alternative has the best effect in terms of the use of that feature. It’s an extremely powerful technique as it allows us to adapt extremely quickly to the needs of our audience based on what they actually do rather than what they say they do. However, it’s not without its limits. We have to be keenly aware of two things. First, that although the majority might prefer one version of the change, other users might actually prefer one of the alternatives. You may well be segregating your audience based on the behavior of the larger number of users rather than opening up the game to a wider audience. This process will, if you are not careful, become more pronounced over time as each movement towards the “majority” may further alienate the minority audience, reducing their numbers further. The second issue is that AB testing doesn’t tell you why the change worked and quite often will have unexpected consequences. The most telling of these is the longevity or lifetime value of the customer. Take a game where the player is presented with a choice of buying a small amount of in-game currency at one price or a much larger amount at a heavily discounted price. We may well see a massive increase in revenue in the short term if we emphasize the highest price option; e.g., £69 for 10,000,000 gems. However, what this might hide is that, although this price point works for our most engaged players, it may alienate or even scare off other players who are still in the learning stage. Putting reminders to buy things, and at higher costs, will inevitably drive new sales but it may well do so at the cost of the lifetime value of the players. Worse still, it may cause more delicate players to churn early. It’s possible that these guys would never have spent as much, but it’s more likely that you will have capped your potential long-term revenue.
I’m not telling you that AB testing is a bad idea—quite the opposite. I’m just saying that the use of data is complex and easy to get wrong without great care. We need to appreciate exactly what our data means and its consequences. That is like a form of shadow that each change to our game design will cast. The only way to understand this shadow is to talk to our users and get some insight, something raw data alone won’t give us.
Testing is a Process
Player surveys, focus groups and formal play-testing sessions have gone out of favor recently given that we can capture such a huge amount of information about what players do. They are unreliable and messy and can’t help you predict future actions. However, this kind of qualitative research can provide you with a good understanding of “why” players behaved in a particular way. Understanding motivations is key to making the right choices about what we see coming out of the raw behavioral data we capture, and without talking to players, how can we get that right? This shouldn’t be considered as a one-time thing. Good testing is a process that allows us to compare behavior over time, not just in a single snapshot. It also doesn’t have to be too expensive and, done well, can help your validate major feature changes in a way that opens the game out to new possibilities and new audiences rather than just relying on the feedback of the audiences you have.
This is important as your design process shouldn’t ignore opinions of other users, especially those who don’t currently play our games. Balancing data and insight together means you can adapt and expand your audience appeal in both the short term and the long term.
On the other hand, we must also be careful to understand the difference between opinion and data. When we show our games to other people, we inevitably influence their responses to us. They may want to please us or to show off how clever they are. I’m not suggesting people will be deliberately awkward but they will inevitably be influenced by your presence. This is one of the reasons it’s so important to create the right repeatable conditions for play testing; not just going down to the local bar and showing random people. Similarly when you make a release to a beta community, compare what they say with what they actually do—especially, after you make significant updates to the flow or difficulty of the game8. Compare the reactions and behavior, but more than that, isolate the differences between new participants to the beta after that release was made to the established players. Something that used to be easy but is made harder might get a bad reaction from established players, but may at the same time enhance the retention level of the new players. We have to be careful with our interpretations as they might not be as obvious as they first appear.
Summing Up
Capturing data about how players play your game is now as much a part of the design process as creating game mechanics or the monetization model. This may seem to be adding more work and effort, but in fact will pay dividends to you. The more data you have, the more insight you will gain and the easier it will be for you to test and improve your player’s experience. This has become a critical tool for the designer and we should embrace it.
However, to make this work for you it’s really important to ask the right questions. Knowing what you need to know is critical and often we can be confused by a wrong interpretation of what our data means. This often leads well-meaning developers who want to make better games to fail and simply produce games that are better at making money but are in the end unsatisfying and alienate their own core audience.
Getting this right is about capturing enough information so you can isolate the unknown variables without risking the data blindness that comes with capturing everything. The only way to do that is to look at what actions correspond to genuine choices by the player and even just documenting that will help you have a better insight on how your game will perform. That’s a worthwhile exercise in its own right.
Notes
1 There is a debate over whether we should use the term D1 or D2 to measure the first days retention. Personally I prefer to use D2, but some prefer to think that the first day of play is day 0 and use D1. Churn is an oddly useful measurement. It’s negative focus (i.e., looking at the number of people who leave your game) but this allows you to think about what you need to fix and how imperative it is to do that. It’s psychologically different from how you might respond to increasing retention and also makes it easier to argue for resources in your team, http://en.wikipedia.org/wiki/Churn_rate.
2 Funnel analysis is a tool commonly used in sales analysis as it helps understand where in the cycle we have to focus our attention to increase the rate of conversion, http://en.wikipedia.org/wiki/Funnel_chart.
3 As well as looking at which players leave your game at particular points is also useful to compare that with how many act in positive ways, for example, sharing their successes and failures through the games social channels. We don’t necessarily want to entirely throw away a moment in the game many players love if a few players leave at that point—there might be other reasons they are leaving.
4 I first became aware of HACCP in my first full-time job (before I started in games) where I was involved producing software for food technicians, mostly in chocolate manufacture. It came up again when I worked in the pensions industry looking at online security and electronic document storage and now seems to follow me into data capture for games, https://en.wikipedia.org/wiki/Hazard_analysis_and_critical_control_points.
5 The brave among you will want to check out a systematic approach for documenting entity relationships called UML (Unified Modelling Language). This is used in software engineering, object-orientated programming and, of course, data modelling, but don’t let that put you off—it’s pretty a useful approach to learn, http://en.wikipedia.org/wiki/Unified_Modeling_Language.
6 While it’s not a universal panacea for all things in online security, the HTTPS protocol is a vital component of what makes the internet function for businesses. Essentially this is the combination of the normal HTTP (Hyper Text Transfer Protocol) and the encryption protocols provided SSL (Secure Sockets Layer)—more recently updated to TLS (Transport Layer Security), http://en.wikipedia.org/wiki/HTTP_Secure.
7 On the plus side there are a number of services out on the market that can help, some like Flurry are free (at the time of publication at least), as long as you don’t mind the limited options and the fact that your data will anonymously go into the pool of market data that Flurry reports on its blog. Personally, I think this is a good idea as it gives you a real benchmark of your relative success.
8 Before we launched the 3G carrier Three in the UK we conducted countless focus group tests to understand what users would want most from the new service. Video calling kept coming up as the most important innovation, but it flopped. Why? Because making a call in test conditions was nothing like the real-world where you didn’t know if you had coverage, your friends had a compatible phone, etc. Add to that the risk of being found in your underpants or having to stare at your boss when on a video call, even if they aren’t telling you off. Reality and expectation are rarely the same.
Exercise 11: How Does Your Design Encourage Discovery?
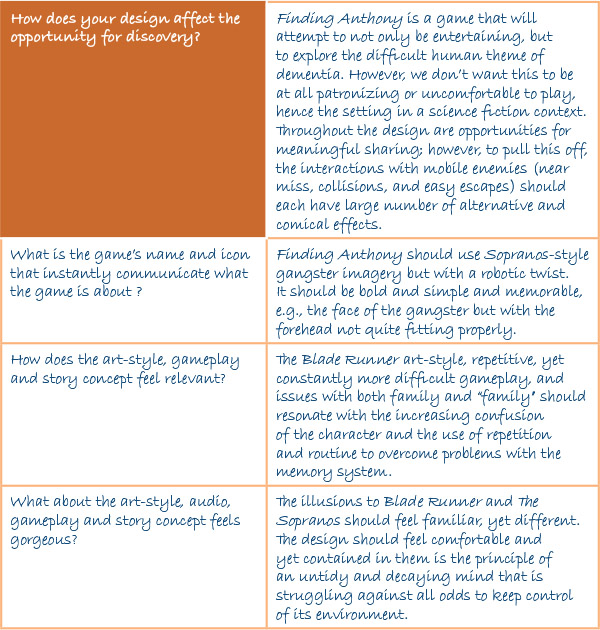
In this exercise we need to work out how our game design itself contributes to the discovery process and what elements in the design make it more likely to take advantage of any opportunity for either in-person or online social discovery. Additionally, we will look at some of the basic elements you need to consider to make sure that players have the best possible chance to understand what your game is about and why they will select that game not only from the app store but also why they will remember the icon on the device and select it again a second and many subsequent times.
In working through this exercise we need to consider the way in which our game design works for our objectives to be found. The art style and gameplay can be extremely important in this as they have to convey the relevance of the game to that player in an immediate and gorgeous manner. We often only have the name and the icon to explain why players should care and this means we need to capture their imagination as simply as possible. In the real world we should AB test both of these in detail, but for the purposes of this exercise just write down your initial thoughts, we can improve on them later.
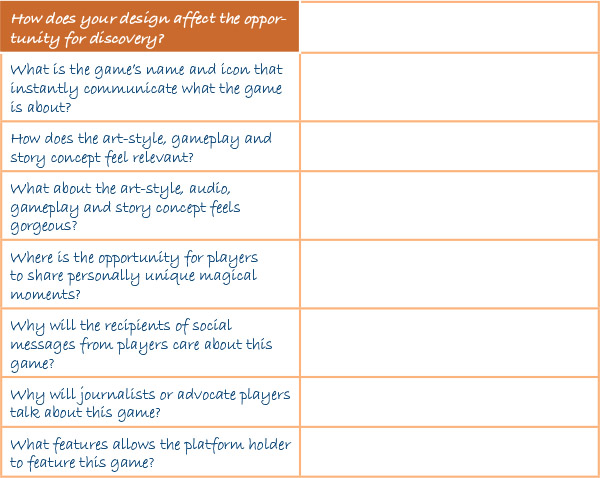
We should also think about how the game creates magical moments of delight that players actively want to share with others and why their friends will care about those moments. Will they be able to create unique expressions of their gameplay ability or creativity through your game? Further than this we need to consider not just the players and their friends but also the other audiences. Why will journalists and app store managers care about your game?
Worked Example: