CHAPTER 23
HEDGING MORTGAGE SECURITIES TO CAPTURE RELATIVE VALUE355
I. INTRODUCTION
Because of the spread offered on residential agency mortgage-backed securities, they often outperform government securities with the same interest rate risk and therefore they can be used to generate enhanced returns relative to a benchmark when the yield advantage of mortgage securities is attractive. However, to execute this strategy successfully, the prepayment risk of mortgage securities must be managed carefully. In this chapter, we will see how this is done. Specifically, we will see how to “hedge” the interest rate risk associated with a fixed rate mortgage security in order to capture the spread over Treasuries.356 Note that we use the terms mortgage-backed securities and mortgage securities interchangeably in this chapter. As explained earlier, the most basic form of mortgage-backed security is the mortgage passthrough security. Securities that are created from mortgage passthrough securities include collateralized mortgage obligations and mortgage strips (interest-only and principal-only securities).
II. THE PROBLEM
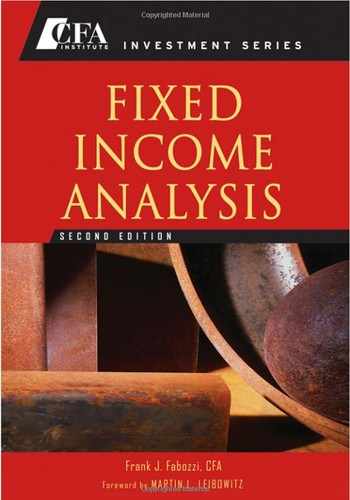
To illustrate the problem faced by a portfolio manager who believes that the spread offered on a mortgage security, is attractive and wants to hedge that spread, look at Exhibit 1. The exhibit shows the relationship between price and yield for a mortgage passthrough security. The yield for a mortgage security is the cash flow yield.357 The price-yield relationship exhibits both positive and negative convexity. At yield levels above y*, the mortgage security exhibits positive convexity; at yield levels below y*, the mortgage security exhibits negative convexity.
EXHIBIT 1 Price-Yield Relationship for a Mortgage Passthrough Security
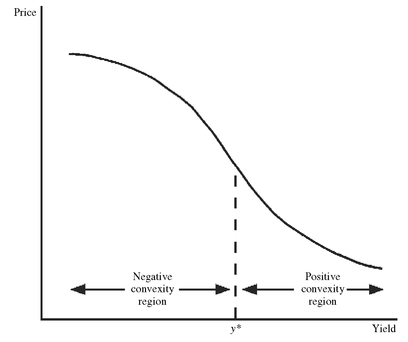
It is important to understand this characteristic of a mortgage security. One way to understand it is to look at what happens to the change in price when interest rates move up and down by the same number of basis points. This can be seen in Exhibit 2 which shows the price-yield relationship for a security that exhibits positive convexity such as a Treasury security and a security that exhibits negative convexity. Let’s look at what happens to the price change in absolute terms when interest rates change. From Exhibit 2 we observe the following property:
For a security that exhibits positive convexity, the price increase when interest rates decline is greater than the price decrease when interest rates rise.
This is not the case for a security that exhibits negative convexity. Instead, we also observe from Exhibit 2 the following property:
For a security that exhibits negative convexity, the price increase when interest rates decline is less than the price decrease when interest rates rise.
Why will a mortgage security exhibit negative convexity at some yield level? The explanation is the homeowner’s prepayment option. The value of a mortgage security declines as the value of the prepayment option increases. As mortgage rates in the market decline, the value of the prepayment option increases. As a result, the appreciation due to a decline in interest rates that would result if there had not been a prepayment option will be reduced by the increase in the value of the option.
We can see this by thinking about an agency mortgage security as equivalent to a position in a comparable-duration Treasury security and a call option. We can express the value of the mortgage security as follows:
EXHIBIT 2 Price Changes Resulting from Positive and Negative Convexity
Source:
P0 = initial price
PA = price if yield decreases from y0 to y- for the negative convexity bond
PB = price if yield decreases from y0 to y- for the positive convexity bond
PC = price if yield increases from y0 to y+ for the negative convexity bond
PD = price if yield increases from y0 to y+ for the positive convexity bond Implications:
For a given change in yield, for a bond with positive convexity:
PB - P0 > |PD - P0| (i.e., gain is greater than the loss)
For a given change in yield, for a bond with negative convexity:
|PC - P0| > PA - P0 (i.e., loss is greater than the gain)
Value of mortgage security = Value of a Treasury security - Value of the prepayment option
The reason for subtracting the value of the prepayment option is that the investor in a mortgage security has sold a prepayment option. Consider what happens as interest rates change. When interest rates decline, the value of the Treasury security component of the mortgage security’s value increases. However, the appreciation is reduced by the increase in the value of the prepayment option which becomes more valuable as interest rates decline. The net effect is that while the value of a mortgage security increases, it does not increase by as much as a same-duration Treasury security because the increase in the value of the prepayment option offsets part of the appreciation.
When interest rates rise, we see the opposite effect of the prepayment option. A rise in interest rates results in a decline in the value of the Treasury security component of the mortgage security’s value. At the same time, the value of the prepayment option declines. The net effect is that while the value of a mortgage security deceases, it does not decline in value as much as a same-duration Treasury security because the decline in the value of the prepayment option offsets part of the depreciation.
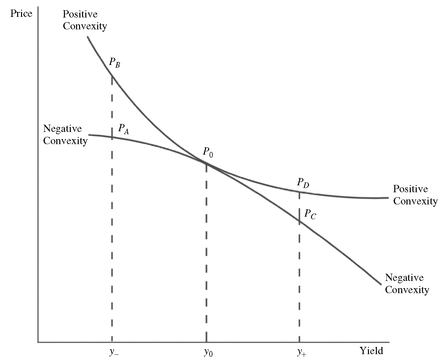
EXHIBIT 3 Positive and Negative Convexity and Duration Changes
Another way of viewing positive and negative convexity is how the duration changes when interest rates change. Exhibit 3 shows tangent lines to the price/yield relationship for two securities, one exhibiting positive convexity and the other negative convexity. The tangent line is related to the duration. The steeper the tangent line, the higher the duration. Notice in Exhibit 3 the following:
| Effect on duration when interest rates | ||
|---|---|---|
| Convexity | fall | rise |
| Positive | increases | decreases |
| Negative | decreases | increases |
That is, for a security that exhibits positive convexity, the duration changes in the desired direction; for a security that exhibits negative convexity, there is an adverse change in the duration.
While a mortgage security can exhibit both positive and negative convexity, a Treasury security exhibits only positive convexity. Look at the problem of hedging the interest rate risk associated with a mortgage security by either shorting Treasury securities or selling Treasury futures (i.e., hedging an instrument that has the potential for negative convexity with an instrument that only exhibits positive convexity). As explained in Chapter 22, the hedging principle is that the change in the value of the mortgage security position for a given basis point change in interest rates will be offset by the change in the value of the Treasury position for the same basis point change in interest rates. When interest rates decline, prepayments cause the value of a mortgage security to increase less in value than that of a Treasury position with the same initial duration. Thus, when interest rates decline, simply matching the dollar duration of the Treasury position with the dollar duration of the mortgage security will not provide an appropriate hedge when the mortgage security exhibits negative convexity.
For this reason, many investors consider mortgages to be market-directional investments that should be avoided when one expects interest rates to decline.358 Fortunately, when properly managed, mortgage securities are not market-directional investments. Proper management begins with separating mortgage valuation decisions from decisions concerning the appropriate interest-rate sensitivity of the portfolio. In turn, this separation of the value decision from the duration decision hinges critically on proper hedging. Without proper hedging to offset the changes in the duration of mortgage securities caused by interest rate movements, the portfolio’s duration would drift adversely from its target duration. In other words, the portfolio would be shorter than desired when interest rates decline and longer than desired when interest rates rise.
III. MORTGAGE SECURITY RISKS
Proper hedging requires understanding the principal risks associated with investing in mortgage securities. There are five principal risks: spread, interest-rate, prepayment, volatility, and model risk.359 The yield of a mortgage security—the cumulative reward for bearing all five of these risks—has two components: the yield on equal interest-rate risk Treasury securities plus a spread. This spread is itself the sum of the option cost, which is the expected cost of bearing prepayment risk, and the option-adjusted spread (OAS), which is the risk premium for bearing the remaining risks, including model risk.
A. Spread Risk
A portfolio manager would want to invest in mortgage securities when their spreads versus Treasuries are large enough to compensate for the risk surrounding the homeowner’s prepayment option. Because the OAS can be thought of as the risk premium for holding mortgage securities, a portfolio manager does not seek to hedge spread risk. If a portfolio manager hedges against spread widening, she also gives up the benefit from spread narrowing. Instead, a portfolio manager seeks to capture the OAS over time by increasing the allocation to mortgage securities when yield spreads are wide and reducing exposure to mortgage securities when yield spreads are narrow.
To calculate the OAS for any mortgage security, a prepayment model is employed that assigns an expected prepayment rate every month—implying an expected cash flow—for a given interest rate path. These expected cash flows are discounted at U.S. Treasury spot rates to obtain their present value. This process is repeated for a large number of interest rate paths. Finally, the average present value of the cash flows across all paths is calculated. Typically, the average present value across all paths is not equal to the price of the security. However, we can search for a unique “spread” (in basis points) that, when added to the U.S. Treasury spot rates, equates the average present value to the price of the security. This spread is the OAS.
Historical comparisons are of only limited use for making judgments about current OAS levels relative to the past, because option-adjusted spreads depend on their underlying prepayment models. As a model changes, so does the OAS for a given mortgage security. There are periods where prepayment models change significantly, making comparisons to historical OASs tenuous. A portfolio manager should augment OAS analysis with other tools to help identify periods when spreads on mortgage securities are attractive, attempting to avoid periods when spread widening will erase the yield advantage over Treasuries with the same interest rate risk. The risk that the OAS may change, or spread risk, is managed by investing heavily in mortgage securities only when the initial OAS is large.
B. Interest Rate Risk
The interest rate risk of a mortgage security corresponds to the interest rate risk of comparable Treasury securities (i.e., a Treasury security with the same duration). This risk can be hedged directly by selling a package of Treasury notes or Treasury note futures. Once a portfolio manager has hedged the interest rate risk of a mortgage security, what can the manager earn? Recall that by hedging interest rate risk, a manager synthetically creates a Treasury bill and therefore earns the return on a Treasury bill. But what still remains after the interest rate risk is removed is the spread risk which, as just explained, is not hedged away. So, the portfolio manager after hedging interest rate risk can earn the Treasury bill return plus a spread over Treasuries. However, a portfolio manager cannot capture all of this spread because some of it is needed to cover the value of the homeowner’s prepayment option. After netting the value of the option, the portfolio manager earns the Treasury bill rate plus the potential to capture the OAS.
1. Yield Curve Risk Duration and convexity are measures of interest rate risk for “level” changes in interest rates. That is, if all Treasury rates shifted up or down by the same number of basis points, these measures do a good job of approximating the exposure of a security or a portfolio to a rate change. However, yield curves do not change in a parallel fashion. Consequently, portfolios with the same duration can perform quite differently when the yield curve shifts in a nonparallel fashion. Yield curve risk is the exposure of a portfolio or a security to a nonparallel change in the yield curve shape.
One approach to quantifying yield curve risk for a security or a portfolio is to compute how changes in a specific spot rate, holding all other spot rates constant, affect the value of a security or a portfolio. The sensitivity of the change in value of a security or a portfolio to a particular spot rate change is called rate duration.360 In theory, there is a rate duration for every point on the yield curve. Consequently, there is not one rate duration, but a profile of rate durations representing each maturity on the yield curve. The total change in value if all rates change by the same number of basis points is simply the duration of a security or portfolio to a change in the level of rates. That is, it is the duration measure for level risk (i.e., a parallel shift in the yield curve).
Vendors of analytical system do not provide a rate duration for every point on the yield curve. Instead, they focus on key maturities of the spot rate curve. These rate durations are called key rate durations.
The impact of any type of yield curve shift can be quantified using key rate durations. A level shift can be quantified by changing all key rates by the same number of basis points and computing, based on the corresponding key rate durations, the affect on the value of a portfolio. The impact of a steepening of the yield curve can be found by (1) decreasing the key rates at the short end of the yield curve and determining the change in the portfolio value using the corresponding key rate durations, and (2) increasing the key rates at the long end of the yield curve and determining the change in the portfolio value using the corresponding key rate durations.
The value of an option-free bond with a bullet maturity payment (i.e., entire principal due at the maturity date) is sensitive to changes in the level of interest rates but not as sensitive to changes in the shape of the yield curve. This is because for an option-free bond whose cash flow consists of periodic coupon payments but only one principal payment (at maturity), the change of rates along the spot rate curve will not have a significant impact on its value. In contrast, while the value of a portfolio of option-free bonds is, of course, sensitive to changes in the level of interest rates, it is much more sensitive to changes in the shape of the yield curve than individual option-free bonds.
In the case of mortgage securities, the value of both an individual mortgage security and a portfolio of mortgage securities will be sensitive to changes in the shape of the yield curve, as well as changes in the level of interest rates. This is because a mortgage security is an amortizing security with a prepayment option. Consequently, the pattern of the expected cash flows for an individual mortgage security can be materially affected by the shape of the yield curve. To see this, look at Exhibit 4 which shows the key rate durations for a Ginnie Mae 30-year 10% passthrough, the current coupon passthrough at the time the graph was prepared. Exhibit 5 shows the key rate duration profile for a principal-only (PO) and an interest-only (IO) mortgage strip created from the Ginnie Mae passthrough whose key rate durations are shown in Exhibit 4.
From Exhibit 4 it can be seen that the passthrough exhibits a bell-shaped curve with the peak of the curve between 5 and 15 years. Adding up the key rate durations from 5 to 15 years (i.e., the 5-year, 7-year, 10-year, and 15-year key rate durations) indicates that of the total interest rate exposure, about 70% is within this maturity range. That is, the effective duration alone masks the fact that the interest rate exposure for this passthrough is concentrated in the 5-year to 15-year maturity range.
A PO will have a high positive duration. From the key rate duration profile for the PO shown in Exhibit 5 it can be seen that the key rate durations are negative up to year 7. Thereafter, the key rate durations are positive and have a high value. While the total risk exposure (i.e., effective duration) may be positive, there is exposure to yield curve risk. For example, the key rate durations suggest that if the long end of the yield curve is unchanged, but the short end of the yield curve (up to year 7) decreases, the PO’s value will decline despite an effective duration that is positive. 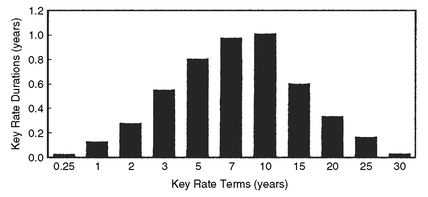
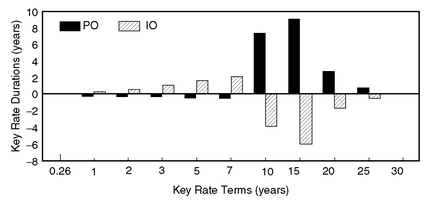
EXHIBIT 4 Key Rate Duration Profile for a 30-Year Ginnie Mae Passthrough
Source: Exhibit 12 in Thomas S.Y. Ho, “Key Rate Durations: Measures of Interest Rate Risks,” Journal of Fixed Income (September 1992), p. 38.
This copyrighted material is reprinted with permission from Institutional Investor, Inc. Journal of Fixed Income, 488 Madison Avenue, New York, NY 10022.
EXHIBIT 5 Key Rate Duration Profiles for a PO and an IO for Current Coupon Ginnie Mae
Source: Exhibit 13 in Thomas S.Y. Ho, “Key Rate Durations: Measures of Interest Rate Risks,” Journal of Fixed Income (September 1992), p. 38.
This copyrighted material is reprinted with permission from Institutional Investor, Inc. Journal of Fixed Income, 488 Madison Avenue, New York, NY 10022.
IOs have a high negative duration. However, from the key rate duration profile in Exhibit 5 it can be seen that the key rate durations are positive up to year 10 and then take on high negative values. As with the PO, this security is highly susceptible to how the yield curve changes.
While the key rate durations are helpful in understanding the exposure of a mortgage security or a portfolio to yield curve risk, we will present an alternative methodology for assessing the yield curve risk of a mortgage security when we discuss the hedging methodology in Section V.
C. Prepayment Risk
When interest rates decline, homeowners have an economic incentive to prepay their existing mortgages by refinancing at a lower rate. As demonstrated earlier, because of the prepayment option the duration of mortgage securities varies in an undesirable way as interest rates change: extending as rates rise and shortening as rates fall. Therefore, the percentage increase in price of a mortgage security for successive 25 basis point declines in yield, for example, becomes smaller and smaller. Conversely, the percentage decline in price becomes greater as interest rates rise. Termed negative convexity, this effect can be significant—particularly for mortgage securities that concentrate prepayment risk such as interest-only strips.
When interest rates change we must offset the resultant change in mortgage durations in order to keep the overall interest rate risk of the portfolio at its desired target. Neglecting to do so would leave the portfolio with less interest rate risk than desired after interest rates decline and more risk than desired after rates increase. A portfolio manager should adjust for changes in durations of mortgage securities—or equivalently, manage negative convexity—either by buying options or by hedging dynamically.
Hedging dynamically requires lengthening duration—buying futures—after rates have declined, and shortening duration—selling futures—after rates have risen.361 Whether a portfolio manager employs this “buy high/sell low” dynamic strategy, or buys options, the portfolio’s performance is bearing the cost associated with managing negative convexity by foregoing part of the spread over Treasuries.
D. Volatility Risk
An investment characteristic of an option is that its value increases with expected volatility.362 In the case of an interest rate option, the pertinent volatility is interest rate volatility. The prepayment option granted to a homeowner is an interest rate option and therefore the homeowner’s prepayment option becomes more valuable when future interest rate volatility is expected to be high than when it is expected to be low. Because the OAS adjusts to compensate the investor for selling the prepayment option to the homeowner, OAS tends to widen when expected volatility increases and narrow when expected volatility declines.
A portfolio manager can manage volatility risk by buying options or by hedging dynamically. The selection depends on the following:
• When the volatility implied in option prices is high and the portfolio manager believes that future realized volatility will be lower than implied volatility, he should hedge dynamically.
• When implied volatility is low and the portfolio manager believes that actual future volatility will be higher than implied volatility, he should hedge by purchasing options.
Because it has been our experience that implied volatilities have tended to exceed subsequent realized volatility, we have generally hedged dynamically to a greater extent than we have hedged through the use of options.
E. Model Risk
Mortgage prepayment models generate cash flows for a given set of interest rate paths. But what happens when the models are wrong? In the rally of 1993, premium mortgages prepaid at much faster rates than predicted by most prepayment models in use at that time. Investors who had purchased interest-only strips (IOs) backed by premium mortgages, and had relied on the prepayment predictions of those models, sustained losses. It is important to note that prior to the rally, the OAS on IOs seemed attractive on a historical basis. However, the model OAS assumed a conditional prepayment rate (CPR) of 40% for premium mortgages; the actual CPR for premium mortgages was as high as 60%, causing the realized OAS to be negative.
Current models calibrate to historical experience. Although a portfolio manager does not know the magnitude of model error going forward, he can measure sensitivity to model error by increasing the prepayment rate assumed by the model for mortgage securities that are hurt by faster-than-expected prepayments and decreasing the prepayment rate assumed by the model for mortgage securities that are hurt by slower-than-expected prepayments.
Over time it has become cheaper to refinance mortgages as technological improvements have reduced the costs associated with refinancing. We expect this type of prepayment innovation to continue in the years ahead. Models calibrated to past behavior will understate the impact of innovation. Therefore, when evaluating mortgage securities that are vulnerable to this type of risk, a portfolio manager should carefully consider the likelihood and the effect of prepayment innovation in determining the size of a portfolio’s mortgage securities. Although a portfolio manager cannot hedge model risk explicitly, he can measure it and manage it by keeping a portfolio’s exposure to this risk in line with that of the broad-based bond market indices.
IV. HOW INTEREST RATES CHANGE OVER TIME
While key rate duration is a useful measure for identifying the exposure of a portfolio to different potential shifts in the yield curve, it is difficult to employ this approach to yield curve risk in hedging a portfolio. An alternative approach is to investigate how yield curves have changed historically and incorporate typical yield curve change scenarios into the hedging process. This approach has been used by several firms that specialize in the management of mortgage-backed securities.363
Empirically, studies have found that yield curve changes are not parallel. Rather, when the level of interest rates changes, studies have found that short-term rates move more than longer-term rates. Some firms develop their own proprietary models that decompose historical movements in the rate changes of Treasury strips with different maturities in order to analyze typical or likely rate movements. The statistical technique used to decompose rate movements is principal components analysis.
Most empirical studies, published and proprietary, find that more than 95% of historical movements in rate changes can be explained by changes in (1) the overall level of interest rates and (2) twists in the yield curve (i.e., steepening and flattening). For example, Morgan Stanley’s proprietary model of the movement of monthly Treasury strip rates finds the following “typical” monthly rate change in basis points for three maturities: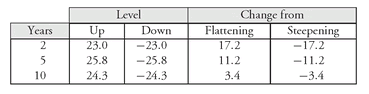
“Typical” means one standard deviation in the change in the monthly rate. The last two columns in the above table indicate the change in the monthly rate found by principal components analysis that is due to a flattening or steepening of the yield curve. From the above table, the impact on the yield curve for a typical rise in the overall level of interest rates and a flattening of the yield curve is found as follows. To find the typical change in the slope of the 10-year - 2-year yield-curve segment, the difference between the 17.2 basis points at 2-year, and 3.4 basis points at 10 years is computed. The difference of 13.8 basis points means that the typical monthly flattening is 13.8 basis points. The typical monthly steepening is 13.8 basis points.
Because of the importance of yield curve risk for mortgage securities, a hedging methodology should incorporate this information about historical yield curve shifts. We will see how this is done in the next section.
V. HEDGING METHODOLOGY
As explained in Chapter 22, hedging is a special case of interest rate risk control where the portfolio manager seeks to completely offset the dollar price change in the instrument to be hedged by taking an opposite position in an appropriate hedging instrument that will produce the same dollar price change for the same change in interest rates. In the discussion in Chapter 22, the methodology presented for hedging a non-mortgage security addressed only a parallel shift in the yield curve.
To properly hedge the interest rate risk associated with a mortgage security, the portfolio manager needs to incorporate his knowledge of the following:
• how the yield curve changes over time
• the effect of changes in the yield curve on the homeowner’s prepayment option
Using this information, a portfolio manager can estimate how mortgage security prices will change as interest rates change.
A. Interest Rate Sensitivity Measure
Scott Richard and Benjamin Gord introduced the concept of interest-rate sensitivity (IRS) and discussed why it is a better measure of interest rate risk than modified or effective duration.364 IRS measures a security’s or a portfolio’s percentage price change in response to a shift in the yield curve.
Since two factors (the “level” and “twist” factors discussed in the previous section) have accounted for most of the changes in the yield curve, two Treasury notes (typically the 2-year and 10-year) can hedge virtually all of the interest rate risk in mortgage securities. Since two hedging instruments are used, the hedge is referred to as a two-bond hedge.
To create the two-bond hedge, we begin by expressing a particular mortgage security in terms of an “equivalent position” in U.S. Treasuries or “equivalent position” in Treasury futures contracts.365 We identify this equivalent position by picking a package of 2-year and 10-year Treasuries that—on average—has the same price performance as the mortgage security to be hedged under the assumed “level” and “twist” yield curve scenarios. For hedging purposes, the direction of the change—up or down in the case of the “level” factor, flattening or steepening in the case of the “twist” factor—is not known. (In calculating how the price will change in response to changes in the two factors, it is assumed that the OAS is constant.)
In this way, the portfolio manager can calculate the unique quantities of 2-year and 10-year Treasury notes or futures that will simultaneously hedge the mortgage security’s price response to both “level” and “twist” scenarios. This combination is the appropriate two-bond hedge for typical yield curve shifts and therefore defines the interest rate sensitivity of the mortgage security in terms of 2-year and 10-year Treasury notes or futures.
B. Computing the Two-Bond Hedge
The steps to compute the two-bond hedge are as follows:
Step 1: For an assumed shift in the level of the yield curve, compute the following:
• price of the mortgage security for an assumed increase in the level of interest rates
• price for the mortgage security for an assumed decrease in the level of interest rates
• price of the 2-year Treasury note (or futures) for an assumed increase in the level of interest rates
• price of the 2-year Treasury note (or futures) for an assumed decrease in the level of interest rates
• price of the 10-year Treasury note (or futures) for an assumed increase in the level of interest rates
• price of the 10-year Treasury note (or futures) for an assumed decrease in the level of interest rates
Step 2: From the prices found in Step 1, calculate the price change for the mortgage security, 2-year Treasury note (or futures), and 10-year Treasury note (or futures) for the assumed shift in the level of interest rates. There will be two prices changes for each of the mortgage security, 2-year hedging instrument, and 10-year hedging instrument.
Step 3: Calculate the average price change for the mortgage security and the two hedging instruments for the assumed shift in the level of interest rates assuming that the two scenarios (i.e., increase and decrease) are equally likely to occur. The average price change will be denoted as follows:
MBS priceL = average price change for the mortgage security for a level shift
2-H priceL = average price change for the 2-year Treasury hedging instrument for a level shift
10-H priceL = average price change for the 10-year Treasury hedging instrument for a level shift
Step 4: For an assumed twist (flattening and steepening) of the yield curve, compute the following:
• price of the mortgage security for an assumed flattening of the yield curve
• price of the mortgage security for an assumed steepening of the yield curve
• price of 2-year Treasury note (or futures) for an assumed flattening of the yield curve
• price of 2-year Treasury note (or futures) for an assumed steepening of the yield curve
• price of 10-year Treasury note (or futures) for an assumed flattening of the yield curve
• price of 10-year Treasury note (or futures) for an assumed steepening of the yield curve
Step 5: From the prices found in Step 4, calculate the price change for the mortgage security, 2-year Treasury note (or futures), and 10-year Treasury note (or futures) for the assumed twist in the yield curve. There will be two prices changes for each of the mortgage security, 2-year hedging instrument, and 10-year hedging instrument.
Step 6: Calculate the average price change for the mortgage security and the two hedging instruments for the assumed twist in the yield curve assuming that the two scenarios (i.e., flattening and steepening) are equally likely to occur. The average price change will be denoted as follows:
MBS priceT = average price change for the mortgage security for a twist in the yield curve
2-H priceT = average price change for the 2-year Treasury hedging instrument for a twist in the yield curve
10-H priceT = average price change for the 10-year Treasury hedging instrument for a twist in the yield curve
Step 7: Compute the change in value of the two-bond hedge portfolio for a change in the level of the yield curve. This is done as follows. Let
H2 = amount of the 2-year hedging instrument per $1 of market value of the mortgage security
H10 = amount of the 10-year hedging instrument per $1 of market value of the mortgage security
Our objective is to find the appropriate values for H2 and H10 that will produce the same change in value for the two-bond hedge as the change in the price of the mortgage security that the portfolio manager seeks to hedge.
The change in value of the two-bond hedge for a change in the level of the yield curve is:
H2 × (2-H priceL) + H10 × (10-H priceL)
Step 8: Determine the change in value of the two-bond hedge portfolio for a twist in the yield curve. This value is
H2 × (2-H priceT ) + H10 × (10-H priceT)
Step 9: Determine the set of equations that equates the change in the value of the two-bond hedge to the change in the price of the mortgage security. To be more precise, we want the change in the value produced by the two-bond hedge to be in the opposite direction to the change in the price of the mortgage security. Using our notation, the two equations are:
Level: H2 × (2-H priceL) + H10 × (10-H priceL) = - MBS priceL
Twist: H2 × (2-H priceT ) + H10 × (10-H priceT ) = - MBS priceT
Step 10: Solve the simultaneous equations in Step 9 for the values of H2 and H10. Notice that for the two equations, all of the values are known except for H2 and H10. Thus, there are two equations and two unknowns.
In Step 9, a negative value for H2 or H10 represents a short position and a positive value for H2 or H10 represents a long position.
C. Illustrations of the Two-Bond Hedge
To illustrate the steps to compute the two-bond hedge, we will examine at two different dates: February 12, 2003 and March 4, 1997. Illustration 1 shows a combination of a long position and a short position in two hedging instruments to hedge the long position in a passthrough security. Illustration 2 involves a short position in two hedging instruments in order to hedge a long position in a passthrough security.
1. Illustration 1: Two-Bond Hedge with a Long and Short Position In this illustration we will see how to hedge a position in the Fannie Mae 5% coupon passthrough on February 12, 2003. The price of this mortgage security was 99.126. In our illustrations we will use the 2-year and 10-year Treasury note futures as the hedging instruments for the two-bond hedge. The prevailing price for the 2-year Treasury note futures was 107.75. The prevailing price for the 10-year Treasury note futures was 114.813.
a. Finding the Two-Bond Hedge Step 1: In computing the price resulting from a change in the level of interest rates, an increase and decrease of 24.3 basis points is used. (This is the typical monthly overall change in the level of rates.) The dollar price change per $100 of par value is shown below:
| Price for | ||
|---|---|---|
| Instrument | increase in yield | decrease in yield |
| Fannie Mae 5% | 97.787 | 100.334 |
| 2-year Treasury note futures | 107.333 | 108.168 |
| 10-year Treasury note futures | 113.137 | 116.510 |
For the Fannie Mae 5%, the Monte Carlo simulation model is used to calculate the price after the change in yield. The OAS is held constant at its initial value in the valuation model. (The prices of the two futures instruments are based on the valuation methodology described previously.)
Step 2: From the prices found in Step 1, calculate the price changes:
| Price for | ||
|---|---|---|
| Instrument | increase in yield | decrease in yield |
| Fannie Mae 5% | -1.339 | 1.208 |
| 2-year Treasury note futures | -0.417 | 0.418 |
| 10-year Treasury note futures | -1.676 | 1.697 |
Step 3: Calculate the average price change (using absolute values) for each instrument resulting from a level change:
MBS priceL = 1.274
2-H priceL = 0.418
10-H priceL = 1.687
Step 4: In computing the price resulting from a twist in the shape of the yield curve, the 2-10 slope is assumed to change by 13.8 bps. (Recall from Section IV that this is the typical monthly twist in the shape of the yield curve.) The dollar price per $100 of par value is shown below:
| Price for | ||
|---|---|---|
| Instrument | flattening | steepening |
| Fannie Mae 5% | 98.89 | 99.363 |
| 2-year Treasury note futures | 107.441 | 108.064 |
| 10-year Treasury note futures | 114.342 | 115.285 |
Step 5: From the prices found in Step 4, calculate the price changes:
| Price for | ||
|---|---|---|
| Instrument | flattening | steepening |
| Fannie Mae 5% | -0.236 | 0.237 |
| 2-year Treasury note futures | -0.309 | 0.314 |
| 10-year Treasury note futures | -0.471 | 0.472 |
Step 6: Calculate the average price change for each instrument resulting from a twist in the yield curve:
MBS priceL = 0.237
2-H priceL = 0.312
10-H priceL = 0.472
Step 7: The change in value of the two-bond hedge portfolio for a change in the level of the yield curve is:
H2 × (0.418) + H10 × (1.687)
Step 8: The change in value of the two-bond hedge portfolio for a twist of the yield curve is:
H2 × (0.312) + H10 × (0.472)
Step 9: The two equations that equate the change in the value of the two-bond hedge to the change in the price of the mortgage security are:
Level: H2 × (0.418) + H10 × (1.687) = -1.274
Twist: H2 × (0.312) + H10 × (0.472) = -0.237
Step 10: Solve the simultaneous equations in Step 9 for the values of H2 and H10. This is done as follows:
Solve for H2 in the “Level” equation:
H2 = (-1.274 - 1.687H10)/0.418 = -3.048 - 4.036H10
Substitute the above for H2 in the “Twist” equation:
[-3.048 - 4.036H10](0.312) + H10(0.472) = -0.237
- 0.950976 - 1.259232H10 + 0.472H10 = -0.237
- 0.950976 - 0.787232H10 = -0.237
Solve for H10:
0.787232H10 = -0.713976
H10 = -0.906945
To obtain H2, we can substitute H10 = -0.906945 into the “Level” or the “Twist” equation and solve for H2. Substituting into the “Level” equation we get:
H2 × (0.418) + (-0.906945) × (1.687) = -1.274
H2 × (0.418) - 1.530016 = -1.274
H2 = 0.612478
Thus, H2 = 0.612478 and H10 = -0.906945.366
The value of 0.612478 for H2 means that the par amount in the 2-year Treasury note futures will be 0.612478 per $1 of par amount of the mortgage security to be hedged. So, if the par amount of the Fannie Mae 5% to be hedged against interest rate risk is $1 million, then 2-year Treasury note futures with a notional value of $612,478 (= 0.612478 × $1 million) should be long (i.e., buying 2-year Treasury note futures). Notice that we have an example here of going long in a futures contract despite that we are seeking to hedge a long position!
The value of -0.906945 for H10 means that the par amount in the 10-year Treasury note futures will be 0.906945 per $1 of par amount of the mortgage security to be hedged. Assuming again that the par amount of the Fannie Mae 5% to be hedged is $1 million, then 10-year Treasury note futures with a notional value of $906,945 (= 0.906945 × $1 million) should be shorted.
b. Duration Hedge versus Two-Bond Hedge It is interesting to note the difference between the potential performance difference between the bond hedge using duration only and the two-bond hedge that takes into consideration changes in both level and twist changes.
At the time of the hedge, the Fannie Mae 5% passthrough had an effective duration of 5.5. Using only duration to obtain the hedge position, it can be demonstrated that if the yield curve shift is a level one, the following price changes would result: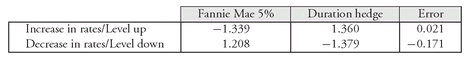
The above results indicate that if the duration hedge is used, when interest rates increase, the Fannie Mae 5% will decline by 1.339 points but the gain from the duration hedge will be 1.36 points. Hence, using a duration hedge the gain will be greater than the loss, resulting in a profit on the hedge. As can be seen from the results above, the opposite occurs if interest rates decline. This is the reason there is a market belief that mortgage securities are “market-directional” investments.
However, evidence using the two-bond hedge suggests otherwise: because the yield curve seldom moves in a parallel fashion, properly hedged mortgage securities are not market-directional. The two-bond hedge would produce the following results: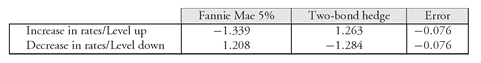
As can be seen from the above table, when “likely level and twist” changes in the yield curve are accounted for, virtually all of the market-directionality is removed. The “error” in the two-bond hedge is a measure of the negative convexity of the Fannie Mae 5% passthrough. For a 24 basis point move (one stand deviation of monthly level shift) in the 10-year—assuming no rebalancing of the hedge—the Fannie Mae 5% passthrough would underperform its two-bond hedge using Treasury note futures by 8 basis points (or eight cents per $100 of par amount). This loss is more than offset by the carry advantage of a mortgage security over Treasuries (i.e., the higher interest earned on the mortgage security versus the cost of financing the Treasury positions). For example, the Fannie Mae 5% has a yield of 5.17% and a 200 basis point spread to Treasuries. This implies that every month this security has a carry advantage of 17 basis points (200 basis points/12), more than enough to offset the 8 basis point hedging loss.
Let’s take a look at the Fannie Mae 5% duration and the duration implied for the two-bond hedging package. The duration for the Fannie Mae 5% is 5.5. We can obtain the implied duration of the two-bond hedge by computing the dollar value of a basis point (DV01) for the 2-year and 10-year Treasury note futures contracts.367 The DV01 for the 2-year Treasury note futures is 0.0186. For the 10-year Treasury note futures the DV01 is 0.067. So the hedging package (i.e., the two-bond hedge) has a DV01 that is the weighted average of the two dollar durations as shown below:
0.612478 × 0.0186 + (-0.906945) × 0.067 = -0.049373
The sign is negative because of the inverse relationship between price change and interest rates. This implies that the two-bond hedge for the Fannie Mae 5% has a duration of (0.049373/99.126)) × 10,000 = 4.98. This is about 9% less than the duration of 5.5 for the Fannie Mae 5%.
2. Illustration 2: Two-Bond Hedge with Two Short Positions The position to be hedged in Illustration 2 is the Freddie Mac 7.5% coupon passthrough on March 4, 1997. The price of this mortgage security was 99 25/32. As with Illustration 1, we will use the 2-year and 10-year Treasury note futures as the hedging instruments for the two-bond hedge. While in Illustration 1 a long position was required in the 2-year Treasury note futures and a short position in the 10-year Treasury note futures, we will see that a short position is required in both hedging instruments in Illustration 2.
We will not go through all the steps but just provide the following basic information so that the positions in the hedging instruments can be computed:
ΔMBS priceL = 1.22 Δ2-H priceL = 0.62 Δ10-H priceL = 1.69
ΔMBS priceT = 0.25 Δ2-H priceT = 0.01 Δ10-H priceT = 0.55
Based on the above information, we can complete Steps 7 through 10 as shown below:
Step 7: The change in value of the two-bond hedge portfolio for a change in the level of the yield curve is found as follows:
H2 × (0.62) + H10 × (1.69)
Step 8: The change in value of the two-bond hedge portfolio for a twist of the yield curve is found as follows:
H2 × (0.01) + H10 × (0.55)
Step 9: The two equations that equate the change in the value of the two-bond hedge to the change in the price of the mortgage security are:
Level: H2 × (0.62) + H10 × (1.69) = -1.22
Twist: H2 × (0.01) + H10 × (0.55) = -0.25
Step 10: Solve the simultaneous equations in Step 9 for the values of H2 and H10. This is done as follows:
Solve for H2 in the “Level” equation: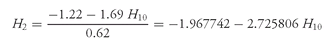
Substitute the above for H2 in the “Twist” equation:
[-1.967742 - 2.725806 H10](0.01) + H10(0.55) = -0.25
- 0.019677 - 0.027258 H10 + 0.55 H10 = -0.25
- 0.019677 + 0.522742 H10 = -0.25
Solve for H10:
0.522742 H10 = -0.230323
H10 = -0.440605
To obtain H2, we can substitute H10 = - 0.440605 into the “Level” or the “Twist” equation and solve for H2. Substituting into the “Level” equation we get:
H2 × (0.62) + (-0.440605) × (1.69) = -1.22
H2 × (0.62) - 0.744622 = -1.22
H2 = -0.766739
Thus, H2 = -0.766739 and H10 = -0.440605.
These values indicate that a short position will be taken in both the 2-year and 10-year Treasury note futures. The value of 0.766739 for H2 means that the par amount in the 2-year Treasury note futures will be 0.766739 per $1 of par amount of the mortgage security to be hedged. So, if the par amount of the Freddie Mac 7.5% to be hedged against interest rate risk is $1 million, then 2-year Treasury note futures with a par amount of $766,739 (= 0.766739 × $1 million) should be shorted. Similarly, the value of 0.440605 for H10 means that the par amount in the 10-year Treasury note futures will be 0.440605 per $1 of market value of the mortgage security to be hedged.
Once again we see the value of using the two-bond hedge rather than using a duration hedge. At the time of the hedge, the Freddie Mac 7.5% passthrough had an effective duration of 4.4. Using only duration to obtain the hedge position, it can be demonstrated that if the yield curve shift is a parallel one, the following price changes would result: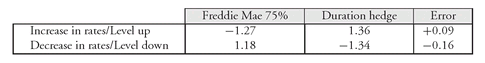
As in Illustration 1, using a duration hedge the gain will be greater than the loss, resulting in a profit on the hedge and suggesting that mortgage securities are “market-directional” investments. However, for the two-bond hedge we would find the following: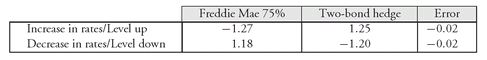
As can be seen from the above table, when typical changes in the yield curve are accounted for, virtually all of the market-directionality is removed.
D. Underlying Assumptions
Now that the underlying principles and mechanics for hedging the interest rate risk of a mortgage security have been covered, let’s look at the underlying assumptions for the two-bond hedge. They are:
• the yield curve shifts used in constructing the two-bond hedge are reasonable
• the prepayment model used does a good job of estimating how the cash flows will change when the yield curve changes
• assumptions underlying the Monte Carlo simulation model are realized (e.g., the interest rate volatility assumption)
• the average price change is a good approximation of how the mortgage security’s price will change for a small movement in interest rates
This last assumption may be unacceptable for certain types of mortgage securities as explained in the next section.
VI . HEDGING CUSPY-COUPON MORTGAGE SECURITIES
In many cases, the “average” price change is a good approximation of how a mortgage security’s price will change for a small movement in interest rates. This can be seen by the tangent line labeled “Current Coupon” in Exhibit 6. However, some mortgage securities are very sensitive to small movements in interest rates. For example, a mortgage security whose coupon is 100 basis points higher than the current coupon could be prepaid slowly if rates rise by 25 basis points but prepaid very quickly if rates fall by 25 basis points. Small changes in interest rates have large effects on prepayments for such securities and hence on their prices.
A mortgage security with this characteristic is referred to as a “cuspy-coupon” mortgage security. For such mortgage securities, averaging the price changes is not a good measure of how prices will change. In other words, the tangent line (labeled “Cuspy Coupon” in Exhibit 6) is not a good proxy for the price/yield curve. At times, cuspy-coupon mortgage securities offer attractive risk-adjusted expected returns; however, they have more negative convexity than current-coupon mortgages.
Hedging cuspy-coupon mortgage securities only with Treasury notes or futures contracts may leave the investor exposed to more negative convexity than is desired. The negative convexity feature, as has been mentioned, is the result of the option that the mortgage security investor has granted to homeowners to prepay. That is, the investor has effectively sold an option to homeowners. To hedge the sale of an option (i.e., a short position in an option), an investor can buy an option. Thus, a portfolio manager can extend the two-bond hedge by buying interest rate options to offset some or all of a cuspy-coupon mortgage security’s negative convexity.
We will use a Freddie Mac 8.5% passthrough, a cuspy-coupon mortgage security in February 1997, to illustrate how the two-bond hedging methodology is extended to include options. The price of the Freddie Mac 8.5% passthrough was 103.50.
Without going through the mechanics of how to construct the two-bond hedge, panel a in Exhibit 7 shows (1) the change in the price for the mortgage security and (2) the change in the value of the two-bond hedge for changes in the level and twist in the yield curve. The last column in panel a of the exhibit shows the error for the two-bond hedge. The error is due to the negative convexity characteristic of the Freddie Mac 8.5% passthrough (cuspy-coupon mortgage security).
Because the prepayment option of the Freddie Mac 8.5s is closer to the refinancing threshold than that of the Freddie Mac 7.5s at the time of the analysis, the two-bond hedge error is greater: -0.05 for the 8.5s versus -0.02 for the 7.5s. Buying calls and puts eliminates this drift. Specifically, we added the purchase of the following two option positions per $100 of the Freddie Mac 8.5s to be hedged:
• $18 6-month call option on a 10-year Treasury note with a strike price of 99.5
• $17 6-month put option on a 10-year Treasury note with a strike price of 95
EXHIBIT 6 Mortgage Price/Yield Curve
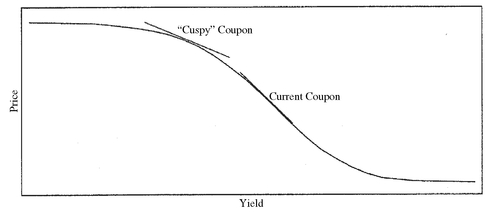
EXHIBIT 7 Alternatives for Hedging a Cuspy-Coupon Mortgage Security
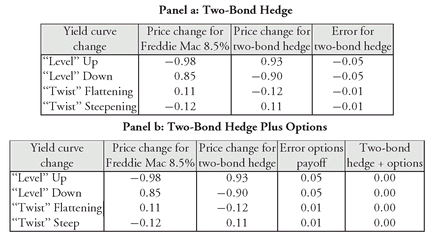
(At the time, the 10-year Treasury was priced at 97 15/32.) Determining how to obtain the positions in the options is beyond the scope of this chapter.
Panel b of Exhibit 7 shows that adding the two option positions on the 10-year note offsets the two-bond hedge error, making the total package (mortgage security + two-bond hedge + options) insensitive to likely interest rate movements. Of course, buying these options requires paying a premium which amounted to about 7 basis points per month. Since the yield advantage of the 8.5s versus Treasuries was about 11 basis points, the expected excess return over Treasuries was about 4 basis points per month after we hedge out the negative convexity.
..................Content has been hidden....................
You can't read the all page of ebook, please click here login for view all page.