
Using the code editor
Exploring the core Visual Studio tool windows
Reorganizing your workspace
So far you have seen how to get started with Visual Studio 2010 and how to customize the IDE to suit the way that you work. In this chapter, you learn to take advantage of some of the built-in commands, shortcuts, and supporting tool windows that will help you to write code and design forms.
As a developer you're likely to spend a considerable portion of your time writing code, which means that knowing how to tweak the layout of your code and being able to navigate it effectively are particularly important. Visual Studio 2010 introduces an all new WPF-based code editor that provides numerous new features from what was available in previous versions of Visual Studio.
When you open a code file for editing you are working in the code editor window, as shown in Figure 4-1. The core of the code editor window is the code pane in which the code is displayed.
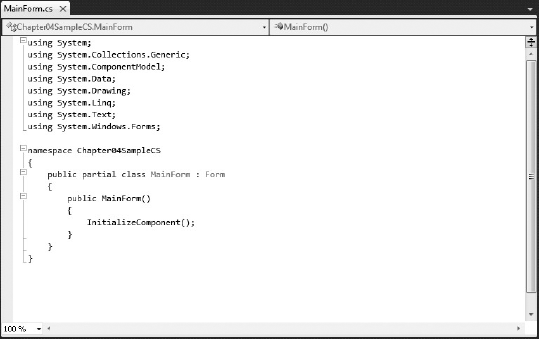
Above the code pane are two drop-down lists that can help you navigate the code file. The first drop-down lists the classes in the code file, and the second one lists the members of the selected class in the first drop-down. These are listed in alphabetical order, making it easier to find a method or member definition within the file.
As you modify the code in the code editor window, lines of code that you've modified since the file has been opened are marked in the left-hand margin (which can be seen in Figure 4-2) — yellow for unsaved changes and green for those that have been saved.
Effective class design usually results in classes that serve a single purpose and are not overly complex or lengthy. However, there will be times when you have to implement so many interfaces that your code file will become unwieldy. In this case, you have a number of options, such as partitioning the code into multiple files or using regions to condense the code, thereby making it easier to navigate.
The introduction of partial classes (where the definition of a class can be split over two or more files) means that at design time you can place code into different physical files representing a single logical class. The advantage of using separate files is that you can effectively group all methods that are related, for example, methods that implement an interface. The problem with this strategy is that navigating the code then requires continual switching between code files.
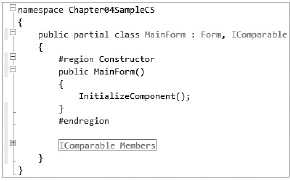
An alternative is to use named code regions to condense sections of code that are not currently in use. In Figure 4-2 you can see that two regions are defined, Constructor and IComparable. Clicking the minus sign next to #Region condenses the region into a single line and clicking the plus sign expands it again.
In addition to regions that you have defined, Visual Studio 2010 has the ability to auto-outline your code, making it easy to collapse methods, comments, and class definitions. Auto-outlining is enabled by default, but if it's not enabled you can enable it using the Edit
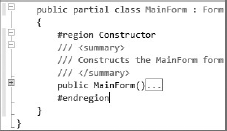
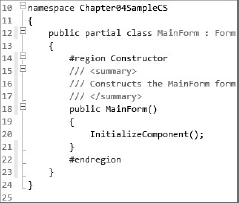
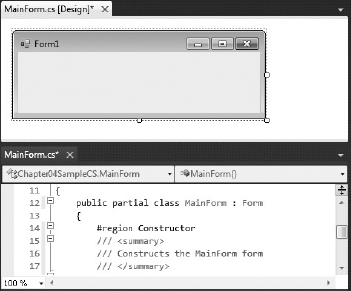
Figure 4-3 shows four condensable regions. One is a defined region called Constructor, however there are also three other automatic regions, outlining the class, the XML comments, and the constructor method (which has been collapsed). Automatic outlines can be condensed and expanded in the same way as regions you define manually.
The Edit
Note
One trick for C# developers is that Ctrl+] enables you to easily navigate from the beginning of a region, outline, or code block to the end and back again.
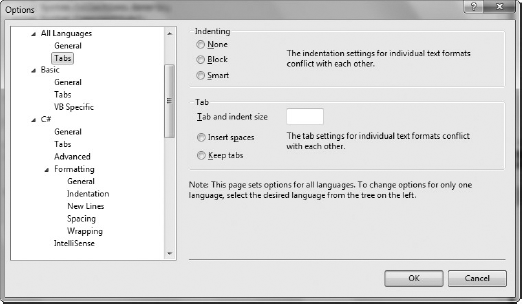
By default, Visual Studio 2010 assists you in writing readable code by automatically indenting and aligning. However, it is also configurable so that you can control how your code is arranged. Common to all languages is the ability to control what happens when you create a new line. In Figure 4-4 you can see that there is a Tabs node under the Text Editor
By default, the indenting behavior for both C# and VB.NET is smart indenting, which will, among other things, automatically add indentation as you open and close enclosures. Smart indenting is not available for all languages, in which case block indenting is used.
Note
If you are working on a small screen, you might want to reduce the tab and indent sizes to optimize screen usage. Keeping the tab and indent sizes the same ensures that you can easily indent your code with a single tab keypress.
What is interesting about this dialog is the degree of control C# users have over the layout of their code. Under the VB Specific node is a single checkbox entitled "Pretty listing (reformatting) of code," which if enabled keeps your code looking uniform without your having to worry about aligning methods, closures, class definitions, or namespaces. C# users, on the other hand, can control nearly every aspect of how the code editor reformats code, as you can see from the additional nodes for C# in Figure 4-4.
Visual Studio's Smart Indenting does a pretty good job of automatically indenting code as it is written or pasted into the code editor, but occasionally you can come across code that has not been properly formatted, making it difficult to read. To have Visual Studio reformat the entire document and set the brace locations and line indentations, select Edit
When writing code, to indent an entire block of code one level without changing each line individually, simply select the block and press Tab. Each line will have a tab inserted at its start. To unindent a block one level, select it and press Shift+Tab.
Note
You may have noticed the Tabify/Untabify Selected Lines commands under the Edit
As you move within and between items, Visual Studio 2010 tracks where you have been, in much the same way that a web browser tracks the sites you have visited. Using the Navigate Forward and Navigate Backward items from the View menu, you can easily go back and forth between the various locations in the project that you have made changes to. The keyboard shortcut to navigate backward is Ctrl+–. To navigate forward again it is Ctrl+Shift+–.
The Visual Studio code editor is very rich with far more features than we can cover in depth here. However, here are a few additional features that you may find useful.
A new feature in Visual Studio 2010 is reference highlighting. All uses of the symbol (such as a method or property) under the cursor within its scope are highlighted (as shown in Figure 4-5). This makes it easy to spot where else this symbol is used within your code. You can easily navigate between the uses by Ctrl+Shift+Up/Down.
You can use Ctrl+Mouse Wheel to zoom in and out of your code (effectively making the text larger or smaller). This feature can be especially useful when presenting to a group to enable the people at the back of the audience to see the code being demonstrated. The bottom left-hand corner of the code editor also has a drop-down enabling you to select from some predefined zoom levels.
You can turn on word wrap in the code editor from the options. Go to Tools
You can turn this on for the current project by selecting Edit
To keep track of where you are in a code file you may find it useful to turn on line numbers in the code editor (as shown in Figure 4-6). To turn line numbers on, go to Tools
Sometimes you want to view two different parts of the same code file at the same time. Split view enables you to do this by splitting the active code editor window into two horizontal panes separated by a splitter bar. These can then be scrolled separately to display different parts of the same file simultaneously (as shown in Figure 4-7).
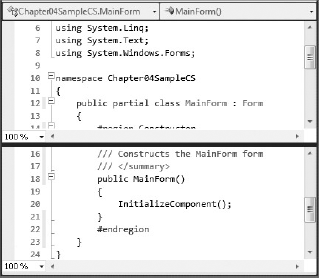
To split a code editor window, select Split from the Window menu. Alternatively, drag the handle directly above the vertical scroll bar down to position the splitter bar.
Drag the splitter bar up and down to adjust the size of each pane. To remove the splitter simply double-click the splitter bar, or select Remove Split from the Window menu.
A welcome new feature in Visual Studio 2010 for those with multiple monitors is the ability to "tear off" or float code editor windows (and tool windows) and move them outside the main Visual Studio IDE window (as shown in Figure 4-8), including onto another monitor. This allows you to now make use of the extra screen real-estate that having multiple monitors provides by enabling multiple code editor windows to be visible at the same time over separate monitors. To tear off a window, make sure it has the focus and then select Float from the Window menu. Alternatively, right-click the title bar of the window and select Float from the drop-down menu, or simply click and drag the tab for that window (effectively tearing it away from its docked position) and position it where you want it to be located.
You may find halving the code editor window in split view (discussed in the previous section) in order to view different parts of a file at the same time too much of a limited view, so you might want to use the floating code windows feature instead to open another code editor window for the same file, and place it, say, on a different screen (if you have a multiple monitor setup). The trick to doing this (because double-clicking the file again in the Solution Explorer simply activates the existing code editor window instance for that file) is to select New Window from the Window menu. This will open the file currently being viewed in another window which you can then tear away and position as you please.
If you don't have the privilege of having more than one monitor, it is still possible to view more than one code editor window at the same time. You do this by creating tab groups, and tiling these groups to display at the same time. As their name would indicate, a tab group is a group of code editor window tabs, with each tab group appearing in a separate tile. Multiple tab groups can be created, limited only by the amount of screen real-estate they will occupy. You can choose to tile the tab groups vertically or horizontally, although you cannot use a mix of the two.
To start this process you need to have more than one tab open in the code editor window. Ensure a code editor tab has the focus, then select Window
Alternatively, you can simply drag a tab below or beside an existing one and dock it to achieve the same effect.
You can drag tabs between tab groups or move them between tab groups using Window
To restore the user interface to having a single tab group again, move the tabs from the new tab group(s) back into the original one again and the tiling will be removed.
To be a truly productive developer it can help to know various advanced features available in the code editor that are hidden away but can save you a lot of time. Here are some of the most useful commands that aren't immediately obvious within the code editor.
Often you need to comment or uncomment a block of code, and you don't want to have to add/remove the comment characters to/from the start of each line, especially when there are many lines in the block. Of course, in C# you could wrap the block of code between a /* and */ to comment it out, but this type of comment isn't available in Visual Basic, and it can be problematic in C# when commenting out a block that already contains a comment using this style.
Visual Studio provides a means to comment/uncomment a block of code easily, by selecting the block, then selecting Edit
The easiest way to access these commands (you are likely to use these often) is via their shortcuts. Press Ctrl+K, Ctrl+C to comment a block of code, and Ctrl+K, Ctrl+U to uncomment it. The Text Editor toolbar is another simple means to access these commands.
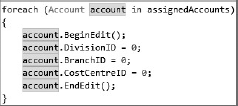
Also known as box selection, column selection, rectangle selection, or vertical text selection, block selection is the ability to select text in a block (as shown in Figure 4-10) instead of the normal behavior of selecting lines of text (stream selection). To select a block of text, hold down the Alt key while selecting text with the mouse, or use Shift+Alt+Arrow with the keyboard. This feature can come in handy when, for example, you have code lined up and want to remove a vertical portion of that code (such as a prefix on variable declarations).
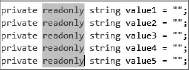
Multiline editing is a new feature available in Visual Studio 2010 that extends the abilities of block selection. In previous versions, after selecting a vertical block of text you could only delete, cut, or copy the block. With Visual Studio 2010 you can now type after selecting a vertical block of text, which will replace the selected text with what's being typed on each line. This can be handy for changing a group of variables from private to protected, for example.
Note
You can also insert text across multiple lines by creating a block with zero width and simply starting to type.
Visual Studio keeps track of the last 20 snippets of text that have been copied or cut to the clipboard. To paste text that was previously copied to the clipboard but overwritten, instead of the normal Ctrl+V when pasting, use Ctrl+Shift+V. Pressing V while holding down Ctrl+Shift cycles through the entries.
To quickly navigate to the definition of the class, method, or member under the cursor, right-click
You can find where a method or property is called by right-clicking its definition and selecting Find All References from the drop-down menu, or placing the cursor in the method definition and pressing Shift+F12. This activates the Find Symbol Results tool window and displays the locations throughout your solution where that method or property is referenced. You can then double-click a reference in the results window to navigate to that result in the code editor window.
Note
This feature has somewhat been made obsolete by the new Call Hierarchy window, discussed later in this chapter. However, it can still be a quick way to view where a method is used without navigating through the Call Hierarchy window.
As you become more familiar with Visual Studio 2010, you will spend less time looking for functionality and more time using keyboard shortcuts to navigate and perform actions within the IDE. One of the tool windows that's often overlooked is the Command window, accessible via View
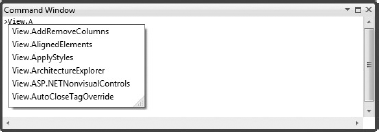
A full list of the Visual Studio commands is available via the Environment
The commands fall into three rough groups. Many commands are shortcuts to either tool windows (which are made visible if they aren't already open) or dialogs. For example, File.NewFile opens the new file dialog. Other commands query information about the current solution or the debugger. Using Debug.ListThreads lists the current threads, in contrast to Debug.Threads, which opens the Threads tool window. The third type includes those commands that perform an action without displaying a dialog. This would include most macros and a number of commands that accept arguments (a full list of these, including the arguments they accept, is available within the MSDN documentation). There is some overlap between these groups: for example, the Edit.Find command can be executed with or without arguments. If this command is executed without arguments, the Find and Replace dialog is displayed. Alternatively, the following command will find all instances of the string MyVariable in the current document (/d) and place a marker in the code window border against the relevant lines (/m):
>Edit.Find MyVariable /m /d
Although there is IntelliSense within the Command window, you may find typing a frequently used command somewhat painful. Visual Studio 2010 has the ability to assign an alias to a particular command. For example, the alias command can be used to assign an alias, e?, to the find command used previously:
>alias e? Edit.Find MyVariable /m /d
With this alias defined you can easily perform this command from anywhere within the IDE: press Ctrl+Alt+A to give the Command Window focus, then type e? to perform the find-and-mark command.
You will have imported a number of default aliases belonging to the environment settings when you began working with Visual Studio 2010. You can list these using the alias command with no arguments. Alternatively, if you want to find out what command a specific alias references, you can execute the command with the name of the alias. For example, querying the previously defined alias, e?, would look like the following:
>alias e?
alias e? Edit.Find SumVals /m /doc
Two additional switches can be used with the alias command. The /delete switch, along with an alias name, removes a previously defined alias. If you want to remove all aliases you may have defined and revert any changes to a predefined alias, you can use the /reset switch.
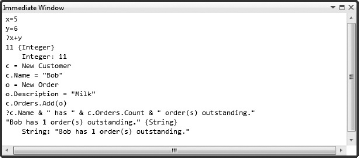
Quite often when you are writing code or debugging your application, you will want to evaluate a simple expression either to test a bit of functionality or to remind yourself of how something works. This is where the Immediate window comes in handy. This window enables you to run expressions as you type them. Figure 4-12 shows a number of statements — from basic assignment and print operations to more advanced object creation and manipulation.
Note
In Visual Basic you can't do explicit variable declaration in the Immediate window (for example, Dim x as Integer), but instead you do this implicitly via the assignment operator. The example shown in Figure 4-12 shows a new customer being created, assigned to a variable c, and then used in a series of operations. When using C#, new variables in the Immediate window must be declared explicitly before they can be assigned a value.
The Immediate window supports a limited form of IntelliSense, and you can use the arrow keys to track back through the history of previous commands executed. Variable values can be displayed by means of the Debug.Print statement. Alternatively, you can use its ? alias. Neither of these are necessary in C#; simply type the variable's name into the window and press Enter to print its value.
When you execute a command in the Immediate window while in design mode, Visual Studio will build the solution before executing the command. If your solution doesn't compile, the expression cannot be evaluated until the compilation errors are resolved. If the command execute code has an active breakpoint, the command will break there. This can be useful if you are working on a particular method that you want to test without running the entire application.
You can access the Immediate window via the Debug
Note
Note that in order to execute commands in the Immediate window you need to add > as a prefix (for example, >cmd to go to the Command window); otherwise Visual Studio tries to evaluate the command.
Also, you should be aware that the language used in the Immediate window is that of the active project. The examples shown in Figure 4-12 will work only if a Visual Basic project is currently active.
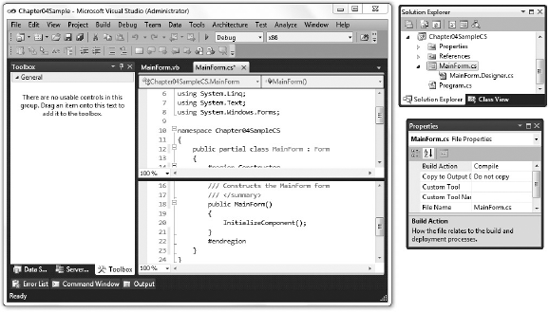
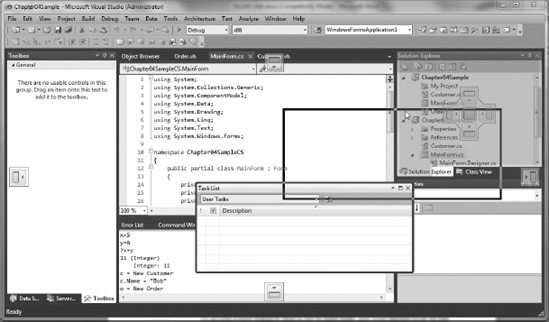
Although the Solution Explorer is probably the most useful tool window for navigating your solution, it can sometimes be difficult to locate particular classes and methods. The Class View tool window provides you with an alternative view of your solution that lists namespaces, classes, and methods so that you can easily navigate to them. Figure 4-13 shows a simple Windows application that contains a single form (MainForm), which is selected in the class hierarchy. Note that there are two Chapter04Sample nodes. The first is the name of the project (not the assembly as you might expect), and the second is the namespace that MainForm belongs to. If you were to expand the References node, you would see a list of assemblies that this project references. Drilling further into each of these would yield a list of namespaces, followed by the classes contained in the assembly.
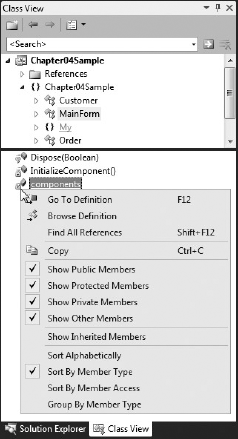
In the lower portion of Figure 4-13 you can see the list of members that are available for the class Form1. Using the right-click shortcut menu, you can either filter this list based on accessibility, sort and group the list, or use it to navigate to the selected member. For example, clicking Go To Definition on InitializeComponent() would take you to the Form1.Designer.vb file.
The Class View is useful for navigating to generated members, which are usually in a file hidden in the default Solution Explorer view (such as the designer file in the previous example). It can also be a useful way to navigate to classes that have been added to an existing file — this would result in multiple classes in the same file, which is not a recommended practice. Because the file does not have a name that matches the class name, it becomes hard to navigate to that class using the Solution Explorer; hence the Class View is a good alternative.
The Error List window displays compile errors, warnings, and messages for your solution, as shown in Figure 4-14. You can open the Error List window by selecting View
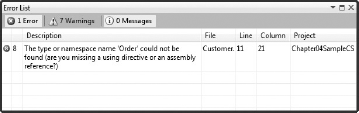
You can filter the entries in the list by toggling the buttons above the list to select the types of errors (Errors, Warnings, and/or Messages) you want to display.
Another way of viewing the classes that make up your application is via the Object Browser. Unlike most other tool windows, which appear docked to a side of Visual Studio 2010 by default, the Object Browser appears in the editor space. To view the Object Browser window, select View
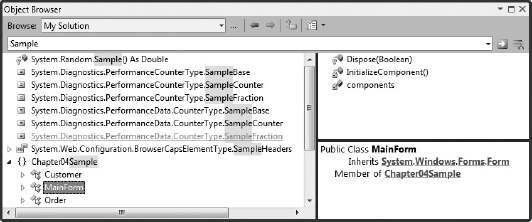
In the top right-hand portion of Figure 4-15 you can see the list of members for the selected class (MainForm), and in the lower window the full class definition, which includes its base class and namespace information. One of the options in the Browse drop-down of Figure 4-15 is a Custom Component Set. To define what assemblies are included in this set you can either click the ellipsis next to the drop-down or select Edit Custom Component Set from the drop-down itself. This presents you with an edit dialog similar to the one shown in Figure 4-16.
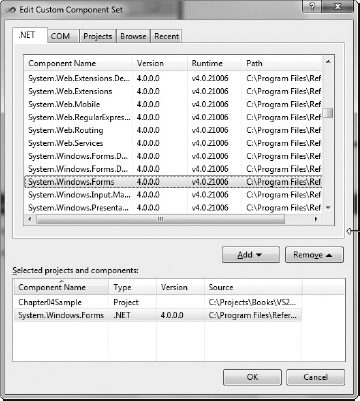
Selecting items in the top section and clicking Add inserts that assembly into the component set. Similarly, selecting an item in the lower section and clicking Remove deletes that assembly from the component set. Once you have finished customizing the component set, it will be saved between Visual Studio sessions.
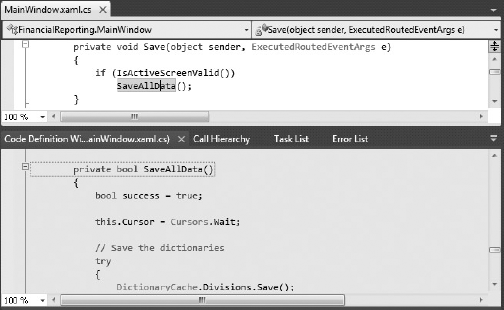
When navigating around your code you might come across a method call that you'd like to view the code for without leaving your current position in the code editor. This is where the Code Definition window can come in handy, to show the source of the method when the cursor has been placed within a reference to it (as shown in Figure 4-17). Access it via View
Note
You can also use the Code Definition window with the Class View and the Object Browser windows to view the code for the selected member of a class.
A new feature in Visual Studio 2010, the Call Hierarchy window displays all the calls to and from a method (or property or constructor, but each henceforth referred to as methods), enabling you to see where a method is being used and additionally what calls it makes to other methods. This enables you to easily follow the execution path and the flow of the code.
To view the call hierarchy for a method, select a method definition in the code editor window and select View Call Hierarchy from the right-click context menu. This adds the method to the tree in the Call Hierarchy window with two subnodes — Calls To (MethodName) and Calls From (MethodName), as shown in Figure 4-18.
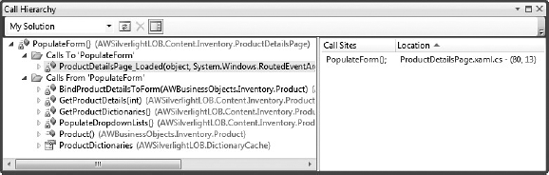
Expanding the Calls To (MethodName) lists all the methods that call the specified method. Expanding the Calls From (MethodName) lists all the other methods that are called by the specified method.
The Call Hierarchy window allows you to drill down through the results to build a hierarchy of the program execution flow — seeing which methods call the specified method, which methods call them, and so on.
Double-clicking a method navigates to that method definition in the code editor window.
Note
You can view the call hierarchy for methods in the Class View window or the Object Browser window also, by right-clicking the method and selecting View Call Hierarchy from the drop-down menu.
Despite the fact that the Call Hierarchy window can be left floating or be docked, it doesn't work in the same way as the Code Definition window. Moving around the code editor window to different methods will not display the call hierarchy automatically for the method under the cursor — instead you will need to explicitly request to view the call hierarchy for that method, at which point it will be added to the Call Hierarchy window. The Call Hierarchy window can display the call hierarchy for more than just one method and each time you view the call hierarchy for a method it is added to the window rather than replacing the call hierarchy currently being viewed. When you no longer need to view the call hierarchy for a method, select it in the window and press Delete (or the red cross in the toolbar) to remove it.
Note
This window can come in very handy when working on an unfamiliar project or refactoring a project.
Editing HTML files, using either the visual designer or code view, is never as easy as it could be, particularly when you have a large number of nested elements. When Visual Studio .NET first arrived on the scene, a feature known as document outlining came to at least partially save the day. In fact, this feature was so successful for working with HTML files that it was repurposed for working with non-web forms and controls. This section introduces you to the Document Outline window and demonstrates how effective it can be at manipulating HTML documents, and forms and controls.
The primary purpose of the Document Outline window is to present a navigable view of HTML pages so that you could easily locate the different HTML elements and the containers they were in. Because it is difficult to get HTML layouts correct, especially with the many .NET components that could be included on an ASP.NET page, the Document Outline view provides a handy way to find the correct position for a specific component.
Figure 4-19 shows a typical HTML page. Without the Document Outline window, selecting an element in the designer can be rather tricky if it's small or not visible in the designer. The Document Outline pane (View
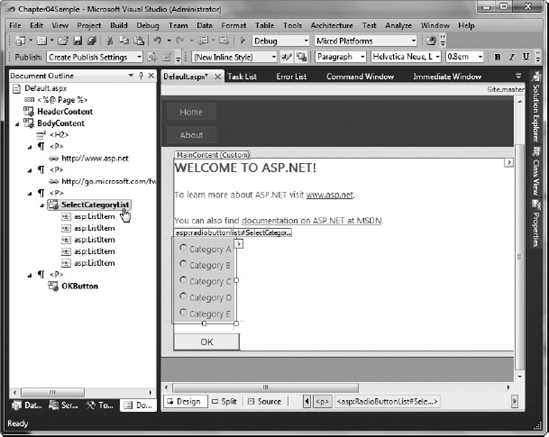
Visual Studio analyzes the content of the currently active file and populates it with a tree view containing every element in the page hierarchy. The Name or ID value of each element will be displayed in the tree (if they are assigned one), while unnamed elements are simply listed with their HTML tags.
As you select each entry in the Document Outline window, the Design view is updated to select the component and its children. In Figure 4-19, the SelectCategoryList RadioButtonList control's tag is selected in the Document Outline window, highlighting the control in the Design view, and enabling you to see where it is located on the page. Correspondingly, selecting a control or element in the Design view will select the corresponding tag in the page hierarchy in the Document Outline window (although you will need to set the focus back to the Document Outline window for it to update accordingly).
The Document Outline window has been available in Visual Studio since the first .NET version for HTML files but has been of little use for other file views. When Visual Studio 2003 was released, an add-in called the Control view was developed that allowed a similar kind of access to Windows Forms.
The tool was so popular that Microsoft incorporated its functionality into the Document Outline tool window, so now you can browse Windows Forms in the same way.
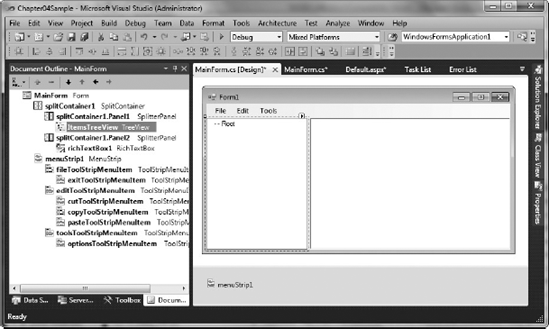
Figure 4-20 shows a typical complex form, with many panels to provide structure and controls to provide the visual elements. Each component is represented in the Document Outline by its name and component type. As each item is selected in the Document Outline window, the corresponding visual element is selected and displayed in the Design view.
This means that when the item is in a menu (as is the case in Figure 4-20) Visual Studio automatically opens the menu and selects the menu item ready for editing. As you can imagine, this is an incredibly useful way of navigating your form layouts, and it can often provide a shortcut for locating wayward items.
The Document Outline window has more functionality when used in Control Outline mode than just a simple navigation tool. Right-clicking an entry gives you a small context menu of actions that can be performed against the selected item. The most obvious is to access the Properties window.
One tedious chore is renaming components after you've added them to the form. You can select each one in turn and set its Name property in the Properties window, but using the Document Outline window you can simply choose the Rename option in the context menu and Visual Studio will automatically rename the component in the design code, thus updating the Name property for you without your needing to scroll through the Properties list.
Complex form design can sometimes produce unexpected results. This often happens when a component is placed in an incorrect or inappropriate container control. In such a case you'll need to move the component to the correct container. Of course, you have to locate the issue before you even know that there is a problem.
The Document Outline window can help with both of these activities. First, using the hierarchical view, you can easily locate each component and check its parent container elements. The example shown in Figure 4-20 indicates that the TreeView control is in Panel1, which in turn is in SplitContainer, which is itself contained in a ContentPanel object. In this way you can easily determine when a control is incorrectly placed on the form's design layout.
When you need to move a component it can be quite tricky to get the layout right. In the Document Outline window it's easy. Simply drag and drop the control to the correct position in the hierarchy. For example, dragging the TreeView control to Panel2 results in its sharing the Panel2 area with the ListView control.
You also have the option to cut, copy, and paste individual elements or whole sets of containers and their contents by using the right-click context menu. The copy-and-paste function is particularly useful, because you can duplicate whole chunks of your form design in other locations on the form without having to use trial and error to select the correct elements in the Design view, or resort to duplicating them in the code-behind in the Designer.vb file.
Note
When you cut an item, remember to paste it immediately into the destination location.
The Visual Studio IDE has been designed to be very customizable to enable you to position tool windows such that you can be the most productive and can make full use of your available screen real estate. You can dock tool windows, have them floating, or minimize them to the edge of the IDE displaying only their tab using auto hide.
When dragging a tool window around, a series of guides are displayed to help you move the tool window to a docked position. Drag the tool window onto a guide to dock the window. Dragging over a part of a guide highlights the part of the IDE that the tool window would be docked to if you were to drop it there (as shown in Figure 4-21).
To float a docked tool window simply click and drag it to a new position (making sure not to drop it on top of one of the guides that appears). Pressing the Ctrl key while moving the window will prevent the guides from appearing and the window from snapping to them. When a tool window is docked and part of a tab group (that is, windows that occupy the same space and can be switched between by clicking their tabs), clicking and dragging the tab for the tool window moves just that window, whereas clicking and dragging the title bar for the tool window moves the entire tab group.
To access a tool window that is set to auto hide, put your mouse over its tab to make it slide out. To put a tool window into auto hide mode, click the pushpin button in the title bar for the window, and click it again while in the auto hide mode to return it to its docked position.
Note
After dragging a tool window out of its docked position and moving it elsewhere (such as onto another monitor), simply double-click its title bar while holding the Ctrl key to return it to its previously docked position.
In this chapter you have seen a number of tool windows that can help you not only write code but also prototype and try it out. Making effective use of these windows will dramatically reduce the number of times you have to run your application in order to test the code you are writing. This, in turn, will improve your overall productivity and eliminate idle time spent waiting for your application to run.