 Interacting with Dashboards Within SharePoint Sites
by Bill English, Ben Curry
Microsoft® Office SharePoint® Server 2007 Best Practices
Interacting with Dashboards Within SharePoint Sites
by Bill English, Ben Curry
Microsoft® Office SharePoint® Server 2007 Best Practices
- Microsoft® Office SharePoint® Server 2007 Best Practices
- SPECIAL OFFER: Upgrade this ebook with O’Reilly
- A Note Regarding Supplemental Files
- Acknowledgments
- Introduction
- I. Planning and Designing
- 1. Introducing Microsoft Office SharePoint Server 2007
- 2. Change, Power, and Conflict
- 3. SharePoint Server 2007 Design Life Cycle
- 4. Defining Business Requirements
- Requirements
- Bridging the Gap Between Business Need and Technology Solution
- Characteristics of Good Requirements
- Implementing Requirements Traceability and a Requirements Matrix
- How Many Requirements per Project?
- Using Requirements to Solve Problems
- Negotiating Service Level Agreements
- Summary
- Additional Resources
- 5. SharePoint Server 2007 and Governance
- Governance Best Practices
- Fit the Organization’s Existing Workflow and Culture
- Keep Technology Aligned with Business Objectives
- Define and Manage the Organization’s High-Level Information Taxonomy
- Simple Is Beautiful in the World of Taxonomies
- Keep the Organization Aware of the Financial and Performance Impacts of Its Technology Decisions
- Balance Long-Term and Short-Term Views When Making Technology Decisions
- Encourage Excellence and Innovation
- Guide Through Merit and Service
- Handle Questions and Issues Quickly, Concisely, and Effectively
- Maintain a Technology-Agnostic Viewpoint
- Start Small and Grow Over Time, Intentionally
- Standardize Enterprise-Wide Information with Minimal Intrusion
- Getting a Technology Governance Team Started
- Create an Effective Governance Team Site
- Summary
- Additional Resources
- Governance Best Practices
- 6. Project Plans for a SharePoint Server 2007 Deployment
- Understanding Microsoft’s SharePoint Server 2007 Deployment Plan
- The Envisioning Stage
- The Planning Stage
- Assemble Project Teams and Define Roles
- Review Technical Requirements
- Review Preliminary End-User and Business Requirements
- Determine Preliminary Design Objectives
- Identify Coexistence Strategies
- Establish Test Lab Environment
- Perform Risk Analysis
- Define Communication Strategy
- Define Education Strategy
- Review Client Hardware and Software
- Create Governance Plan with Mission, Vision, and Strategy
- Plan Server Configuration
- Plan Security
- Plan for Performance
- Plan Failover and Disaster Recovery
- Plan for Localization
- Plan Integration
- Plan Maintenance
- Plan Content and Navigation Structure
- Deployment, Implementation, and Configuration Management
- Post-Implementation Operations, Optimization, and Business Review
- Summary
- Additional Resources
- 7. Developing an Information Architecture
- II. Building
- 8. Document Management
- What Is a Document?
- What Is Document Management?
- The Document Life Cycle
- Should SharePoint Replace File Servers?
- Other Best Practices Concerning Documents and Document Libraries
- Working with the SharePoint Server 2007 DoD 5015.2 Add-On Pack
- Summary
- Additional Resources
- 9. Enterprise Content Management
- 10. Business Processes and Workflows
- Identifying Workflow Candidates
- Overview of Out-of-the-box Workflows
- Publishing Workflows
- Workflow Deployment Considerations
- The Other Side of the Coin: Code-free Custom Workflows
- Custom Workflow Considerations
- Workflow Deployment Options
- Workflows and Client Applications
- Security Considerations
- Summary
- Additional Resources
- 11. Branding and Customization
- 12. Web Parts, Features, and Solutions Management
- Content and Infrastructure
- Developer’s Role in SharePoint
- Environments
- Web Parts
- Web Part Infrastructure
- Web Part Manager
- Web Part Zone
- Editor Zone and Tool Parts
- Web Parts
- ASP.NET and Windows SharePoint Services 3.0 Web Parts
- Legacy and ASP.NET Web Parts
- Web Part Connections
- Web Parts with User Controls
- Web Part Verbs
- Customization and Personalization with Web Parts
- Web Part Execution Environments
- Resource Locations
- Features
- Solutions
- Sample Web Part (Available Online)
- Summary
- Additional Resources
- 13. Creating and Managing Publishing Sites
- 14. Understanding and Implementing Microsoft Search Server 2008
- Search Server 2008 Features and Benefits
- Understanding OpenSearch Standards
- OpenSearch Description Documents
- OpenSearchDescription Element
- ShortName Element
- LongName Element
- Description Element
- URL Element
- Contact Element
- Tags Element
- Image Element
- Query Element
- Developer Element
- Attribution Element
- SyndicationRight Element
- AdultContent Element
- Language Element
- InputEncoding Element
- OutputEncoding Element
- AutoDiscovery of RSS/Atom
- OpenSearch Response Elements
- totalResults Element
- startIndex Element
- itemsPerPage Element
- OpenSearch Description Documents
- Installing Search Server 2008
- Building Federated Location Definition Files and Integrating Search Server 2008 with Live Search
- Best Practices for Implementing Search Server 2008
- Summary
- Additional Resources
- 8. Document Management
- III. Deploying
- 15. Implementing an Optimal Search and Findability Topology
- Findability: What Is It and Why Is It Important to You?
- Business Requirements and Search
- Designing Crawl and Query Topologies
- Scaling Out Your Index and Query Servers
- When to Use the Federated Query Features
- Scenario: You need to conserve bandwidth
- Scenario: You need to display the content in the results set, but the remote index’s robots.txt file blocks SharePoint’s crawler
- Scenario: You need to see results from a content source only when certain keywords and/or keyword patterns are entered by the user
- Scenario: Content at the content source changes very often, and those changes must immediately be reflected in the result set. You can crawl and index the content source
- Scenario: Content at the content source changes frequently, but those changes need not be reflected quickly in the result set. You can crawl and index the content source
- Scenario: You need to tightly define which URLs from the remote index will appear in the result set
- Scenario: You need to have queries executed under different security contexts to different remote indexes to receive security-trimmed results within the FLD’s result Web part
- Scenario: You need to have content in the result set that is not indexed locally at the remote site or server
- Scenario: The remote index is intermittently available when users execute queries. You are able to crawl and index the content source’s content
- Scenario: The remote index does not return results in RSS or Atom or the presentation of the results is not usable within the FLD Web part
- Scenario: The content needs to be available in the result set, but the query frequency of the content is not sufficient to justify the resources needed to crawl and index that content
- Scenario: You have more than 250,000 start addresses and/or 500 content sources that you need to include in the result set, and you do not want to or cannot build a second Shared Services Provider in
- Scenario: You have too many FLDs in your result set, and the usability of the result set interface has diminished significantly
- Scenario: Best Bet–type results have several content items and are easily displayed within either the Best Bet Web part or the FLD Web part
- Scenario: Scoping effects are needed on a remote content source that you are not crawling and indexing
- Scenario: You have created FLD files to federate queries in your SharePoint Server 2007 implementation, but the results are returned too slowly from the remote index and users are complaining
- Findability Tools in SharePoint Server 2007
- Summary
- Additional Resources
- 16. Leveraging Shared Services Providers
- 17. Optimizing Information Security
- 18. Business Intelligence and Reporting
- 19. Extending Business Intelligence
- Reporting Services
- Integrating Reporting Services with SharePoint
- Other Reporting Services Features Within SharePoint
- Security Considerations
- Creating, Publishing, and Deploying Reports to SharePoint Sites
- Distributed Server Environment Consideration
- PerformancePoint Server 2007
- Working with Dashboard Designer
- Security and Dashboard Designer
- Deploying Dashboards to SharePoint Sites
- Interacting with Dashboards Within SharePoint Sites
- Saving a Dashboard Designer Workspace
- Business Intelligence Use Case Scenarios
- Summary
- Additional Resources
- 20. Intranet, Extranet, and Internet Scenarios
- 15. Implementing an Optimal Search and Findability Topology
- IV. Operating
- 21. Data Protection, Recovery, and Availability
- 22. Upgrading from SharePoint Portal Server 2003 to SharePoint Server 2007
- Overview of the Four Migration Methods
- Pre-upgrade Tasks
- Upgrading SQL and Office Platforms
- SharePoint Tasks
- Deprecated Features
- Perform a Full Exam of Your SharePoint Portal Server 2003 Environment
- Decide Which Hardware You Will Use for Your SharePoint Server 2007 Implementation
- Upgrading from 32-Bit SharePoint Portal Server 2003 to 64-Bit SharePoint Server 2007
- Do You Need to Redo Your URL Topology in SharePoint Server 2007?
- Develop a Communication Plan to Inform Users and Management About Migration Activities
- Understand When and How to Use Prescan.exe
- Ensure Your SharePoint Portal Server 2003 and SQL Backups Are Working
- If You Choose to Perform a Gradual Upgrade, Ensure You Have Enough SQL Disk Space
- Be Sure that You Have Removed All Orphaned Objects from the SQL Database
- Increase the Web Site and ASP.NET Timeout Settings
- Plan for Broken Links
- Increase the SQL Transaction Log File Size
- Upgrading Customizations
- Post-upgrade Tasks
- Upgrading Shared Services
- Combining Migration Methods
- Upgrading Between Active Directory Forests
- When to Use the Different Upgrade Methods
- Summary
- Additional Resources
- 23. Capacity Planning and Performance Monitoring
- Glossary
- About the Authors
- Additional Resources for IT Professionals from Microsoft Press
- More Great Resources for IT Professionals from Microsoft Press
- Index
- SPECIAL OFFER: Upgrade this ebook with O’Reilly
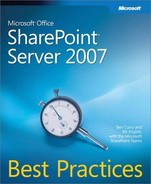
Depending on how you’ve configured a dashboard within Dashboard Designer, end-users will be able to drill down into data sets, filter, add comments to items within published dashboards, and export dashboard data to Excel and Microsoft Office PowerPoint.
Figure 19-51 shows a dashboard that includes a Sales Scorecard, an analysis chart report (Trailing 8 Quarter Sales By Product), a Top 20 Products Chart Report, and a Sales By Country report.
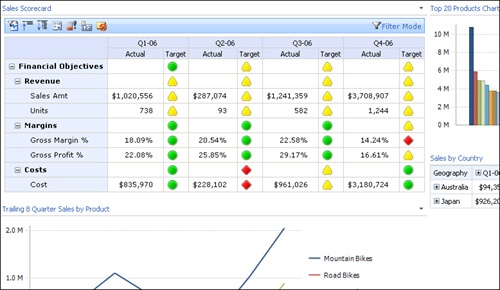
Items within dashboards can be filtered and connected. In other words, when you choose to filter by North America, all items included in the dashboard will update to reflect data specifically relating to North America. Figure 19-52 shows the available filtering options for both the All Product and All Geography filters.
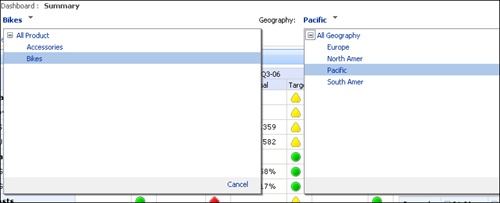
A major strength of published dashboards is the ability to drill down into data sets. Figure 19-53 shows the available drill options available in one of the report items within a dashboard. In this case, the data is being pulled from an Analysis Services cube that includes the dimensions Geography, Product, SalesRep, and Time. In the current selection, Geography, each quarter can also be expanded to reveal quarter-specific data.
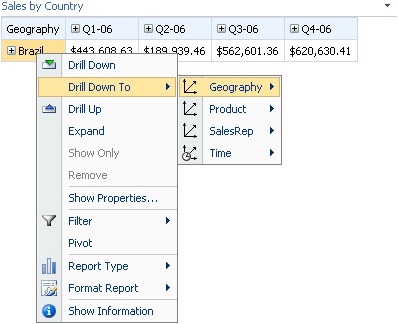
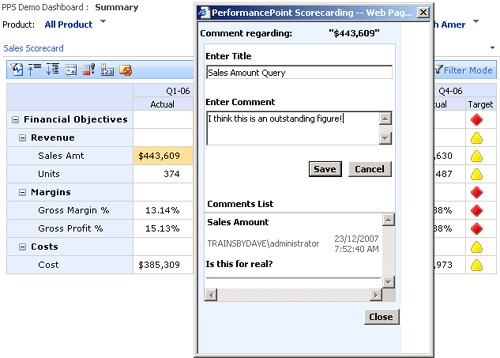
Another valuable feature of dashboard items is the ability to add comments to individual cells within scorecards (for example, querying a specific sales figure). Figure 19-54 shows the Comments dialog box.
-
No Comment