3 Risk Management Map
An effective goal focuses primarily on results rather than activity. It identifies where you want to be, and, in the process, helps you determine where you are. It gives you important information on how to get there, and it tells you when you have arrived.
—Stephen R. Covey
The Capability Maturity Model for Software (CMM) is a de facto model of the software development process, developed by the SEI at Carnegie Mellon University, under the leadership of Watts Humphrey [Humphrey87]. The CMM is a framework that describes the key elements of an effective software process. The CMM describes an evolutionary improvement path from an ad hoc, immature process to a mature, disciplined process [Paulk93b]. The inspiration for the CMM’s five levels of software process maturity was Phil Crosby’s Quality Management Maturity Grid, a five-stage framework for adopting quality practices [Crosby80]. The software community uses the CMM as a software process–maturity framework to evolve toward software engineering and management excellence. The United States government uses the CMM as the basis for an evaluation method for selecting contractors that will develop software with the lowest overall risk [SCE94]. The foundation of the CMM is continuous process improvement for productivity and quality gains. The CMM is not a silver bullet and does not address all the issues important for successful projects [Paulk93a].
A basic assumption of the CMM is that quality increases and risk decreases as maturity levels increase [Humphrey89]. The CMM has helped in the area of process risk, but that is only a fraction of the risks involved with software development. It does not address software technology or human resources issues, for example, which are known sources of software risk [Paulk93c]. It is neither a complete maturity model for risk management, nor does it provide the necessary focus for risk management. CMM v1.1 does identify risk management key practices in several key process areas (KPA). Under the existing CMM architecture, a focus for risk management would require a KPA to be defined at a single maturity level. Working groups at the SEI have discussed the pros and cons of a risk management KPA at Levels 2, 3, and 4. The following quotation is from the CMM v2.0 risk management working group meeting in February 1995:
The CMM itself is a risk management plan. Its stated purpose is to reduce the risk to a project that a project fails to build the correct software, on schedule and budget. It is highly appropriate that risk management be incorporated as a fundamental aspect of good overall software management. Level 2 organizations would stand to benefit greatly from basic risk management practices. The group did acknowledge that risk management at Level 2 has potentially the greatest impact to the community. The risk management working group concluded that risk management needed the additional emphasis that only a KPA would provide.
As a member of the Risk in the CMM working group, I helped write the Risk Management KPA that was reviewed for inclusion in CMM v2.0. A hotly debated topic at the review meetings, risk management was determined to be orthogonal to the software process and thus would not be incorporated as a separate KPA. The controversy regarding how to address risk management in the CMM continued over two years. In May 1997, a final resolution was made to add a goal in Integrated Software Management and strengthen risk management in other KPAs.
Currently, there are two maturity models that do provide focus for risk management practices—the System Engineering Capability Maturity Model (SE-CMM) [Bate94] and the Software Acquisition Capability Maturity Model (SA-CMM) [Ferguson96]—but neither allows for the maturity of risk management itself. In the software industry, we know that incremental development works, and “big bang” does not work. Similarly, the evolution of risk management practice must be understood because, practically, it requires a gradual cultural change. To provide the practical focus needed for risk management, I developed the Risk Management Map, based on evolving the major factors that cause risk management capability. In this chapter, I provide an overview of the map, which is designed to develop your ability to manage risk.
This chapter answers the following questions:
![]() What are the components of the Risk Management Map?
What are the components of the Risk Management Map?
![]() How does the Risk Management Map offer direction?
How does the Risk Management Map offer direction?
![]() How can you progress in your ability to manage risk?
How can you progress in your ability to manage risk?
3.1 The Road to Risk Management Capability
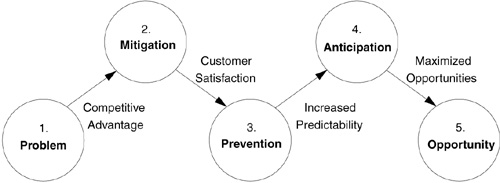
The Risk Management Map charts the course for increasing the capability to manage software risk. As shown in Figure 3.1, the map contains five evolutionary stages: Problem, Mitigation, Prevention, Anticipation, and Opportunity.1 By following the map and using it at a pace geared to the people’s level of commitment and available time, you are assured of a reasonable path for progress. The map provides a detailed plan that can survive in spite of obstacles such as staff turnover and project cancellation. It helps you to do the following.
1 The inspiration for the evolutionary stages is Robert Charette’s Evolution of the Management of Risk [Charette91], which became known in 1992 as Charette’s Management of Risk Helix. Charette’s innovative diagram illustrates seven levels of increasing capability, from Crisis Management to Management of Change.
1. Lay the foundation. Each stage builds a capability that is necessary for the next stage. If you have already begun risk management improvement, you can use the map as a checklist to determine where you are and if you have forgotten any steps along the way. You should have a firm footing before proceeding to the next step. Do not overlook foundational steps in your haste to develop capability.
2. Ease the transition. The big bang approach is disastrous in software development. Just as an incremental strategy works in software development, it will work in developing the capability to manage risk. The map helps to ease into risk management adoption by answering the question “What is the first step to incorporating risk management concepts given our current ability?” Start at the beginning; the map will guide you where you want to go.
Figure 3.1 Risk management map. The map is a practical guide to understanding the path to increasing your ability to manage risk by transitions through five stages. At each stage, a vision provides the direction for your journey.
3. Stay the course. Over time, there is a natural tendency for things to drift offcourse. To avoid this entropy and stay the course, you need a detailed plan that can survive the effects of time. Your staff should be skilled in risk management as long as your organization is in business. Your risk management skill will be proportional to your level of commitment. If you are concerned about the quality of your results, you must check the quality of your input. The map helps you track your progress as you improve your practice.
3.2 Risk Management Map Directions
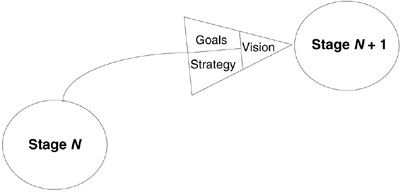
The structure of the map is similar to the arrow of a state-transition diagram that takes you to another node. As shown in Figure 3.2, a “stage” transition takes you to a higher level of risk management capability. To achieve the next stage of development, you need the vision, goals, and strategy provided by the Risk Management Map:
Figure 3.2 Map architecture. The underlying structure of the Risk Management Map supports the transition between stages. Stages provide incremental enhancements in the capability to manage risk. Vision guides the way to the next stage. Goals are accomplished to achieve the vision. Strategy is the activity that supports goal attainment.
![]() Vision. Vision is an ideal state of the practice that guides the journey. It acts as a driving force that provides the motivation required to continue our effort. The Risk Management Map paints a picture of five progressive stages.
Vision. Vision is an ideal state of the practice that guides the journey. It acts as a driving force that provides the motivation required to continue our effort. The Risk Management Map paints a picture of five progressive stages.
![]() Goals. We accomplish goals to achieve our vision. Effective goals clearly define where you should be. Once you understand your current position, your goals will determine the scope of your task. The map provides the goals to bring each vision into reality. Parts II through V of this book group goals by the major factors of the P2I2 Success Formula (people, process, infrastructure, and implementation), and each subsequent chapter describes one goal of the map.
Goals. We accomplish goals to achieve our vision. Effective goals clearly define where you should be. Once you understand your current position, your goals will determine the scope of your task. The map provides the goals to bring each vision into reality. Parts II through V of this book group goals by the major factors of the P2I2 Success Formula (people, process, infrastructure, and implementation), and each subsequent chapter describes one goal of the map.
![]() Strategy. Strategy specifies an approach to accomplish the goals. It contains important information on how to achieve goals and yields activity to check for results. If the results do not support goal attainment, you can make tactical adjustments. The Risk Management Map provides a strategy to realize each goal. Subsections of each remaining chapter outline the strategy the map provides and arrange the required activities in their proper order. You can use the Contents to this book as a checklist to assess the completeness of your practice.
Strategy. Strategy specifies an approach to accomplish the goals. It contains important information on how to achieve goals and yields activity to check for results. If the results do not support goal attainment, you can make tactical adjustments. The Risk Management Map provides a strategy to realize each goal. Subsections of each remaining chapter outline the strategy the map provides and arrange the required activities in their proper order. You can use the Contents to this book as a checklist to assess the completeness of your practice.
The Risk Management Map divides responsibility among the four major factors of risk management capability and provides five goals for each major factor of the P2I2 Success Formula. Risk management capability increases through the accomplishment of each goal, which strengthens the ability to manage risk. The book Contents contains a detailed outline of the map, which can be used as a checklist or quick reference. The following sections briefly describe the map goals for each dimension of the P2I2 Success Formula: process, infrastructure, implementation, and people.
3.2.1 Directions for the Process
The process relates to activities of performing risk management effectively and efficiently. The first step is to define the process of identifying risk and the source of risk. The next step is to define the process of analyzing the probability and consequence of the risk to determine risk ranking. The process of developing and executing a risk action plan is then defined. The process of capturing, reviewing, and reporting risk status is also defined, along with mechanisms for resolving risk and correcting for variations from plans.
Part II of this book addresses the following goals for the process:
![]() Identify risk.
Identify risk.
![]() Analyze risk.
Analyze risk.
![]() Track risk.
Track risk.
![]() Resolve risk.
Resolve risk.
3.2.2 Directions for the Infrastructure
The infrastructure relates to activities of establishing an environment in which the risk management process can be defined, communicated, monitored, and improved. The first step is to develop a policy for performing risk management that is communicated to the entire organization. The next step is to define a standard risk management process that provides a consistent procedure that may be reused within the organization. Training is essential to raise the awareness and understanding of risk management, which provides the motivation and ability to perform the risk management process. An independent audit of the risk management activities, training, and project performance is required to verify risk management compliance. Risk management practice is then systematically improved by assessing the risk management capability and developing and implementing action plans to ensure continuous improvement.
Part III of this book addresses the following goals for the infrastructure:
![]() Develop the policy.
Develop the policy.
![]() Define standard process.
Define standard process.
![]() Train risk technology.
Train risk technology.
![]() Verify compliance.
Verify compliance.
![]() Improve practice.
Improve practice.
3.2.3 Directions for the Implementation
The implementation relates to activities of the execution of the risk management process to control risks cost-effectively. The first step is to establish a risk management initiative by reviewing requirements from the project and organization. Planning for risk management activities requires allocating budget, schedule, and staff. The next step is to develop a risk management plan detailing the approach, structure, process, methods, and tools used to implement risk management on the project. The risk management process may be tailored from the organization’s standard process by addressing the unique aspects of the project, such as size, budget, and structure, to fit a cost-effective process to a particular project. Risks are iteratively assessed and controlled to manage the software risk.
Part IV of this book addresses the following goals for the implementation:
![]() Establish the initiative.
Establish the initiative.
![]() Develop the plan.
Develop the plan.
![]() Tailor the standard process.
Tailor the standard process.
![]() Assess risk.
Assess risk.
![]() Control risk.
Control risk.
3.2.4 Directions for the People
People have different beliefs that affect their behavior toward uncertainty and risk. Their beliefs and behaviors can change, depending on their awareness and understanding of risk management. You can think of risk as what you could lose or what you could fail to gain. The choice is yours. The first step is to recognize that risk management is an option for busy people who are tired of fighting fires. The next step is to learn basic risk concepts and become aware of your critical risks. You can then involve more people in preventing risks from becoming problems. When you learn to quantify the risk exposure, you will be able to focus on the right priorities. When you look at risk in a positive way, you can identify your opportunity cost—the risk of missing an opportunity.
Part V of this book addresses the following goals for the people:
![]() Stage 1: Problem.
Stage 1: Problem.
![]() Stage 2: Mitigation.
Stage 2: Mitigation.
![]() Stage 3: Prevention.
Stage 3: Prevention.
![]() Stage 4: Anticipation.
Stage 4: Anticipation.
![]() Stage 5: Opportunity.
Stage 5: Opportunity.
3.3 Journey from Problem to Opportunity
A paradigm shift is a change in a pattern of thinking. Although changes in thinking can occur in a revolutionary manner, more often, our thinking evolves over time, as a result of knowledge and understanding. The Risk Management Map depicts risk management as evolutionary, with a paradigm shift that occurs in the transition from one stage to the next. The map describes how the major factors of the P2I2 Success Formula evolve from problem to opportunity in five stages.
3.3.1 Five Stages of Risk Management
Increasing levels of knowledge, commitment, communication, efficiency, and effectiveness cause the transformation through each stage of risk management evolution [Hall94].
The problem stage describes the circumstances when risk identification is not seen as positive. It is characterized by a lack of communication, which causes a subsequent lack of coordination. People are too busy solving problems to think about the future. Risks are not addressed until they become problems, because either management was not aware of the risk or inaccurately estimated the risk’s probability of occurrence. Since management reaction to hearing risks is typically to shoot the messenger, most people will not deliver bad news. Crisis management is used to address existing problems. People learn that firefighting can be exciting, but it causes burnout. Chapter 19 describes a project whose lack of risk management practices are typical of the problem stage.
The second stage, the mitigation stage, details the shift from crisis management to risk management. Management now incorporates risk management technology by asking, “What can go wrong?” and “What are the consequences?” This stage is characterized by an introduction to risk concepts. That is, people become aware of risks but do not systematically confront them. Since their knowledge and experience using risk management are limited, they may be unsure of how to communicate risks. In this stage, managers use risk management to reduce the probability and consequence of critical risks by implementing a contingency plan if the original plan fails. Primary emphasis is in the early phases of a software product definition, since major risk reduction leverage occurs in the early phases [Boehm89]. Chapter 20 describes a project whose risk management practices mirror the mitigation stage.
The prevention stage discusses the shift from risk management viewed as a manager’s activity to a team activity. This third stage is a transitional one, where the approach changes from avoidance of risk symptoms to identification and elimination of the root cause of risk. It is characterized by team and occasional customer involvement, as managers understand that risk management is a dynamic process that cannot be performed in isolation. For risk management to succeed, it must occur at each level within an organization [Charette93]. Instead of focusing on cost and schedule risk (a management perspective, usually a symptom of technical risk), a focus on technical risks leads to a discovery of the source of risk. Prevention is a turning point from a reactive to a more proactive approach to risk management. Most people are experienced and comfortable in risk identification but are unsure how to quantify risks. Chapter 21 describes a project team whose risk management practices are representative of the prevention stage.
The fourth stage, the anticipation stage, describes the shift from subjective to quantitative risk management through the use of measures to anticipate predictable risks. It is characterized by the use of metrics to anticipate failures and predict future events. Predictability involves the ability to learn from, adapt to, and anticipate change [Charette92]. The project team and customer use risk management to quantify risks with reasonable accuracy to focus on the right priorities. A proactive approach to attacking risks and assessing alternatives is used. Alternatives are easier to compare using a quantitative approach. Chapter 22 describes a project team whose risk management practices are characteristic of the anticipation stage.
The final stage, the opportunity stage, is a positive vision of risk management that is used to innovate and shape the future. Potentially the most powerful paradigm shift is in perceiving risks as chances to save money and do better than planned. Risk, like quality, is everyone’s responsibility. The risk ethic involves everyone (project team, customer, and end user), and is a continuous process of identifying, communicating, and resolving risks in an open and nonthreatening environment [Kirkpatrick92]. Professional attitudes of engineering excellence allow for open communication and individual contribution. We admit that there are things that we do not know and allow for their existence using a best-case, worst-case scenario. People understand there is an opportunity cost associated with every choice, and knowing these trade-offs improves their decision-making ability. Risk does not have to be negative [VanScoy92]. Wherever there is a risk, there also exists opportunity [Charette91]. Chapter 23 describes a project team whose risk management practices reflect the opportunity stage.
3.3.2 Personal Risk Management Matrix
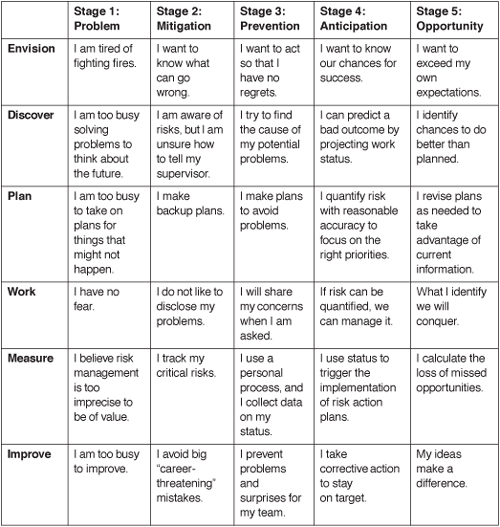
As people progress through the five stages of risk management, their attitude changes. The Personal Risk Management Matrix, shown in Table 3.1 describes an individual’s behavior with respect to risk for each discipline in the 6-D Model. It shows how an individual’s sensibility progresses through five stages of risk management in each of the six disciplines. You can use the matrix to assess your current practice. For each of the six disciplines, select the practice that you perform consistently. Give yourself a point from 1 to 5, depending on the stage you currently perform at, and then total your points.
![]() Score 6 or less. Get the book Thriving on Chaos[Peters87]. You are going to need it!
Score 6 or less. Get the book Thriving on Chaos[Peters87]. You are going to need it!
![]() Score 7 to 12. Awareness makes you uncomfortable, but keep working at it. It gets better.
Score 7 to 12. Awareness makes you uncomfortable, but keep working at it. It gets better.
![]() Score 13 to 18. You are more proactive than most others and are an asset to any team.
Score 13 to 18. You are more proactive than most others and are an asset to any team.
Table 3.1 The Personal Risk Management Matrix
![]() Score 19 to 24. You are more quantitative than most others and are an asset to any team.
Score 19 to 24. You are more quantitative than most others and are an asset to any team.
![]() Score 25 to 30. You are self-motivated and have a great attitude. Would you like a job?
Score 25 to 30. You are self-motivated and have a great attitude. Would you like a job?
To arrive at a team score, average the individual scores. Ask your team members to select the practices they should be performing. The gap between what you do and what you think you should do defines your journey. Begin by improving your weakest practice. Periodic assessment provides evidence of your progress. Once you reach your destination, you may find that you want to set higher goals.
3.4 Journey from Novice to Expert
Managing risk is a lot like playing golf. Known risks on a golf course include sand traps and water hazards. We can recognize a golfer’s skill level by how the person manages these risks—for example:
![]() Novice. In a round of golf, novices have no idea how many balls they will lose in the water.
Novice. In a round of golf, novices have no idea how many balls they will lose in the water.
![]() Beginner. Around the water hazard, beginners play their less expensive balls. They would rather lose old balls than new ones.
Beginner. Around the water hazard, beginners play their less expensive balls. They would rather lose old balls than new ones.
![]() Intermediate. Because they know their capability with each iron, intermediates often switch clubs and lay up before they attempt to cross the water.
Intermediate. Because they know their capability with each iron, intermediates often switch clubs and lay up before they attempt to cross the water.
![]() Advanced. Those who are advanced determine the length of the water hazard and select the appropriate club. They may push the limits of their capability or play it safe, depending on the margin needed to win.
Advanced. Those who are advanced determine the length of the water hazard and select the appropriate club. They may push the limits of their capability or play it safe, depending on the margin needed to win.
![]() Expert. Experts do not see the water as an obstacle. When they take aim, they account for both wind direction and velocity. They visualize the ball landing in the best position for their next shot.
Expert. Experts do not see the water as an obstacle. When they take aim, they account for both wind direction and velocity. They visualize the ball landing in the best position for their next shot.
No two golf courses or software projects are ever the same. For this reason, software engineers, like golfers, must develop general skills for managing risk through practice. To progress from risk management novice to expert, you can use the following Ten-Point Game Plan.
1. Understand where the hole (or pin) is. The “hole” is the goal of a quality software system. The pin provides direction when you cannot see the hole. There are times when you tee off that the pin is nowhere in sight. A map provides guidance like a software life cycle model, to scope the dimensions of the course, or project.
2. Know your capability with each iron. Your personal best will improve as your skill develops. Irons are like the tools that engineers use to get the software to the goal. Remember that a fool with a tool is still a fool.
3. Determine the dimensions of the hazards. Challenging golf courses have water hazards that you must negotiate to keep your score low. The strategy you develop to get past these hazards will depend on your skill level. A high score, like a high project cost, indicates an unsuccessful risk manager.
4. Select the appropriate iron. For each leg of the course, a different iron may be appropriate. Remember that each iron, or tool, has a range. Do not expect your putter to perform like your woods, or you may find yourself lost in the trees.
5. Aim toward the pin. Position yourself correctly before you swing. You will reach your goal only if you are headed in the right direction. Aim that is a little off makes a big difference in where your ball will end up.
6. Focus on the ball. The ball is like a software development or maintenance activity. Focus on the task at hand, not on the risk or the goal. When you take your eye off the ball, you are not in a position to move the ball forward.
7. Take a swing. Regardless of your skill level, the only way to play the game is to take a swing. Some people will slice or hook by accident. The best golfers intentionally slice or hook when the situation calls for it (e.g., the course bends to the left). As you progress in your skill level, you become more proficient at knowing when to take a full swing or a half swing.
8. Follow through. The ball will go much farther and straighter if you follow through with your swing.
9. Assess your shot for improvement. If you can determine why your ball landed where it did, you can find out what to do differently the next time. Remember that name calling or finger pointing will not change the position of your ball on the course.
10. Take corrective action as required. Playing golf, like managing risk or developing software, usually requires corrective action after each shot. After you modify your strategy, you are ready to begin again with Step 1.
3.5 Summary
In this chapter, I provided an overview of the Risk Management Map that is designed to improve your ability to manage risk. The map shows the way to progress in your ability to manage risk. Its components are listed below as the goals for success. Risk management capability increases through the accomplishment of each goal, which provides the enhancement in the ability to manage risk.
![]() Identify risk.
Identify risk.
![]() Analyze risk.
Analyze risk.
![]() Plan risk.
Plan risk.
![]() Track risk.
Track risk.
![]() Resolve risk.
Resolve risk.
Infrastructure Goals
![]() Develop the policy.
Develop the policy.
![]() Define standard process.
Define standard process.
![]() Train risk technology.
Train risk technology.
![]() Verify compliance.
Verify compliance.
![]() Improve practice.
Improve practice.
Implementation Goals
![]() Establish the initiative.
Establish the initiative.
![]() Develop the plan.
Develop the plan.
![]() Tailor the standard process.
Tailor the standard process.
![]() Assess risk.
Assess risk.
![]() Control risk.
Control risk.
Goals for the People
![]() Stage 1: Problem.
Stage 1: Problem.
![]() Stage 2: Mitigation.
Stage 2: Mitigation.
![]() Stage 3: Prevention.
Stage 3: Prevention.
![]() Stage 4: Anticipation.
Stage 4: Anticipation.
![]() Stage 5: Opportunity.
Stage 5: Opportunity.
The Risk Management Map offers direction through its structure. The map architecture contains the following hierarchical constructs:
![]() Stage. Stages describe incremental enhancements in the capability to manage risk.
Stage. Stages describe incremental enhancements in the capability to manage risk.
![]() Vision. For each stage, a vision provides direction and inspiration and guides the way to the next stage.
Vision. For each stage, a vision provides direction and inspiration and guides the way to the next stage.
![]() Goals. To achieve the vision, you must accomplish goals. Each subsequent chapter describes one goal of the map.
Goals. To achieve the vision, you must accomplish goals. Each subsequent chapter describes one goal of the map.
![]() Strategy. Strategy is the activity that supports goal attainment. Subsections of each remaining chapter outline the strategy the map provides.
Strategy. Strategy is the activity that supports goal attainment. Subsections of each remaining chapter outline the strategy the map provides.
Individuals progress in their ability to manage risk in three simple steps (teams, projects, and organizations must repeat these steps for each person employed):
![]() Step 1. Assess the stage of your current risk management practice using the Personal Risk Management Matrix.
Step 1. Assess the stage of your current risk management practice using the Personal Risk Management Matrix.
![]() Step 2. Improve your weakest practice.
Step 2. Improve your weakest practice.
![]() Step 3. Repeat Steps 1 and 2.
Step 3. Repeat Steps 1 and 2.
The ability to manage risk is a “use-it-or-lose-it” proposition. You must apply your ability to manage risk to achieve the control, higher return, or opportunities that you envision. If you develop the ability to manage risk but choose not to use this ability, you will lose your competitive edge. Knowledge without action is insufficient to derive the benefits of risk management.
3.6 Questions for Discussion
1. The Risk Management Map provides the vision, goals, and strategy for progress in the ability to manage risk. Define success criteria for each goal of the map to know when you have arrived at the next consecutive stage.
2. The Risk Management Map builds incremental capability in five stages. What is the result that you expect to achieve at each stage? For each stage, give an example that illustrates your ideal results.
3. Explain the utility of a Risk Management Map. How would you use it if you were responsible for increasing your organization’s risk management capability?
4. Assess your risk management capability using the Personal Risk Management Matrix. Plot a histogram of the six disciplines. What, if anything, can you infer from the data? List strengths, weaknesses, and your recommendations for improvement.
5. Describe the difference between your personal risk management skills: the current “as is” and future “should be.” Define quantitative goals for the “should be.” Estimate how long your effort will take to reach your goals. What is the basis of your estimate?
6. Are you a risk management novice, beginner, intermediate, advanced, or expert? How do you know? What skills will you need to advance to the next level? Why is it important for you to increase your ability to manage risk?
7. What is your risk management philosophy? Do you consider your philosophy to be reactive or proactive? Explain the next step you would take to develop your ability to manage risk.
8. What would you do with the ability to manage risk: control existing risk, take on additional risk for potentially higher return, or maximize long-term opportunities? Explain your choice. What would you do if you knew you could not fail?
9. Effective goals focus on results. Why is it important to divide the goals of risk management capability into categories of people, process, infrastructure, and implementation? What is the relationship among the goals of these four categories?
10. Do you think ahead? Do you calculate based on the worst case? Do you take precautions? Discuss why you do or do not.
3.7 References
[Bate94] Bate R, et al. System Engineering Capability Maturity Model (SE-CMM) Version1.0. Handbook CMU/SEI-94-HB-04. Pittsburgh, PA: Software Engineering Institute, Carnegie Mellon University, December 1994.
[Boehm89] Boehm B. IEEE Tutorial on Software Risk Management. New York: IEEE Computer Society Press, 1989.
[Charette93] Charette R. Essential Risk Management: Notes from the Front. Proc. 2nd SEI Conference on Risk Management, Pittsburgh, PA, March 1993.
[Charette92] Charette R. Building Bridges over Intelligent Rivers. American Programmer, 5(7), September 1992.
[Charette91] Charette R. Risk Management Seminar. Videotape Version 1.0, SPC-91138-MC. Herndon, VA: Software Productivity Consortium, August 1991.
[Covey89] Covey S. The 7 Habits of Highly Effective People. New York: Simon & Schuster, 1989.
[Crosby80] Crosby P. Quality Is Free. New York: McGraw-Hill, 1980.
[Ferguson96] Ferguson J, et al. Software Acquisition Capability Maturity Model (SACMM) Version 1.01. Technical report CMU/SEI-96-TR-020. Pittsburgh, PA: Software Engineering Institute, Carnegie Mellon University, December 1996.
[Hall94] Hall E. Evolution of essential risk management technology. Proc. 3rd SEI Conference on Software Risk, Pittsburgh, PA, April 1994.
[Humphrey89] Humphrey W. Managing the Software Process. Reading, MA: Addison-Wesley, 1989.
[Humphrey87] Humphrey W. Characterizing the software process: A maturity framework. Technical report CMU/SEI-87-TR-11, ADA 182895. Pittsburgh, PA: Software Engineering Institute, Carnegie Mellon University, June 1987.
[Kirkpatrick92] Kirkpatrick R, Walker J, Firth R. Software development risk management: An SEI appraisal. In 1992 SEI Technical Review (R. Van Scoy, ed.). Pittsburgh, PA: Software Engineering Institute, Carnegie Mellon University, 1992.
[Paulk93a] Paulk M, Curtis B, Chrissis M, Weber C. Capability Maturity Model, Version 1.1. IEEE Software, 10(4):18–27, 1993.
[Paulk93b] Paulk M, et.al. Key Practices of the Capability Maturity Model, Version 1.1. Technical report CMU/SEI-93-TR-25. Pittsburgh, PA: Software Engineering Institute, Carnegie Mellon University, February 1993.
[Paulk93c] Paulk M, Curtis B, Chrissis M, Weber C. Capability Maturity Model for Software, Version 1.1. Technical report CMU/SEI-93-TR-24. Pittsburgh, PA: Software Engineering Institute, Carnegie Mellon University, February 1993.
[Peters87] Peters T. Thriving on Chaos. New York: HarperCollins, 1987
[SCE94] Members of the CMM-Based Appraisal Project. Software Capability Evaluation (SCE) Version 2.0 Implementation Guide. Technical report CMU/SEI-94-TR-05, Software Engineering Institute, Carnegie Mellon University, Pittsburgh, PA, February 1993.
[VanScoy92] VanScoy R. Software development risk: Problem or opportunity. Techinical report CMU/SEI-92-TR-30. Pittsburgh, PA: Software Engineering Institute, Carnegie Mellon University, 1992.