
FIVE
Constructing Conceptual Maps for
Innovation Challenges
While working with a client on a complex set of potential innovation challenges, I was asked to provide a rationale for the final list of challenge statements I would present to management. As I evaluated the challenges the client submitted, it occurred to me that I was limited by the processing capacity of my brain. Specifically, I had to deal with my cognitive abilities to juggle—somewhat simultaneously—multiple concepts, the meanings of those concepts, how these “clusters of meaning” might fit together to make sense for client objectives and align with them, the various ways these clusters might fit together, and the order of priority among the clusters. All of that is a pretty tall order!
Even if I could do all that juggling, however, there was no guarantee that the client would understand what I was trying to communicate. This is not necessarily due to any intellectual limitations the client might have. We all have different cognitive maps that we construct to represent our separate realities of cause and effect and conceptual relationships among variables. Because our experiences differ in many ways, we are likely to perceive and understand concepts and their interrelationships differently. I also may communicate in writing or verbally in ways that some may not understand, just because our communication styles may differ.
If the previous assumptions and observations are valid, it probably is even more important that I understand what I am conceptualizing! If I can’t understand or make sense out of a web of concepts, then it will be even more difficult for me to communicate my understanding to others. After struggling quite a while attempting to write a narrative description of my thought processes, I decided it would be easier to create a visual diagram.
I first reviewed all the challenges and organized them into affinity groups, based on commonalities such as challenges involving processes, financials, customers, and branding. I next thought about ways to create a hierarchy among the groups, so that one might be an ultimate or primary objective that would require resolving by first addressing more subordinate objectives. Finally, I took out a sheet of paper and started writing down keywords representing the essence of the concept groups—for example, increase revenue and improve customer service. I then drew circles around each concept and experimented with connecting the concepts by drawing lines with arrows on the ends. Once I was satisfied that my drawing made sense in terms of how the clusters were connected, I transferred my pencil drawing to a computer using the Macintosh-only software program OmniGraffle (a Windows equivalent is Visio).
An example of my final map would be similar to Figure 4-2 in Chapter 4. Once I represented my rough drawing on the computer, I began to elaborate and make it more detailed, including indications of possible interrelationships and depicting how some objectives would have to be achieved before others. After experimenting with different configurations, the nature and priority of the challenges began to emerge more clearly. I now had the degree of basic understanding I sought. I included this drawing with my rationale and the client indicated a better understanding of the complex network of challenges the organization faced and how to go about resolving them. One conclusion to draw from this incident is the old saw that one picture is worth a thousand words.
MIND MAPS, CONCEPT MAPS, AND STRATEGY MAPS
Visual diagrams traditionally have been used as part of project and knowledge management because of their ability to portray complex processes and relationships. They can introduce order and structure to help simplify what often is ambiguous.
If innovation challenge concept maps sound familiar, it may be because you already know about mind maps and strategy maps. The former have been a popular tool for recording information in a nonlinear way; the latter have been used for systemwide planning and evaluation in a variety of organizations. Although there are similarities between them, there are some distinct differences as well.
Mind Maps
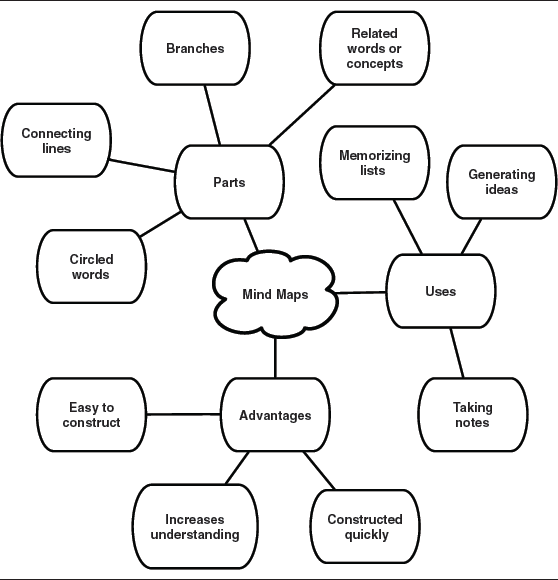
As developed by brain learning author and speaker Tony Buzan, mind maps are used to collect information and organize it by using branches of associations. Visually, they might appear as branches of a tree. Mind maps begin with a central concept or word. You then add lines to other words associated with that central concept and write words or concepts to describe each preceding word. Each of these secondary words or concepts may have lines radiating out from them, which, in turn, may have additional lines and concepts until you have exhausted all categories or space. An example of a mind map with three major nodes is shown in Figure 5-1. In this case, the mind map is used to convey information about mind maps and not to describe relationships that might exist among variables, as would be the case with concept or strategy maps. Software available includes MindJet MindManager, MindMapper, FreeMind, ConceptDraw, MINDMAP, VisualMind, Mind-Genius, BrainMind, MyMind, and Inspiration (for education)—and these are just a few.
Concept Maps
Concept maps generally are believed to have originated with Professor Joseph D. Novak (now emeritus) of Cornell University in the 1960s. He based his work on that of American psychologist David Ausubel, who emphasized the need to draw on previous knowledge when learning something new. This process involves organizing new concepts into current cognitive structures. According to Novak and Canas, now researchers at the Florida Institute for Human and Machine Cognition, concept maps are graphical tools that help to organize and represent knowledge while showing how different concepts are related.
This book views concept maps as being different from mind maps in that concept maps typically help to clarify relationships among hierarchically ordered, interrelated innovation challenge objectives. That is, each node of a concept map represents an objective used to achieve other objectives (subordinate, or secondary) or is the goal of other objectives (superordinate, or primary). For instance, an innovation challenge concept map might illustrate how an objective of improving customer service must be achieved before an objective of improving customer satisfaction.
Another key difference is that there usually is more than one central concept in concept maps. Related concepts might radiate out from these multiple concepts and connect with others so that the resulting diagram represents more of a network than tree branches. Concept maps typically require more thought, reflection, and time than mind maps, which often are characterized by free, associative thinking—one word leads to another, which leads to another, and so on. Concept maps are not necessarily better or more useful than mind maps. It all depends on the context and purposes you want to achieve: If you want a natural way to generate and record ideas quickly without concern about a logical or hierarchical order, then mind maps would be useful; if you want to depict hierarchical relationships among variables, concept maps would be more valuable. Examples of innovation challenge concept maps were presented in previous chapters and will be discussed in more detail later on in this chapter.
Strategy Maps
A special type of a concept map is a strategy map. A variety of such maps have been used over the years, some more formal and complex than others. Perhaps the most notable use of strategy maps in recent years has been based on the work of Robert Kaplan and David Norton, developers of the balanced scorecard (BSC) approach to management strategy. They make the important distinction between strategies and objectives. An objective would be something like, “We want to be the number one pharmaceutical company in North America.” A strategy, in contrast, is how to achieve that objective.
According to Kaplan and Norton, strategy maps are visual representations of how organizations can create value for their shareholders. What is known as the BSC approach to strategy is based on four levels. At the top level is long-term shareholder growth and value, typically expressed in financial terms. Below that level is the customers’ value proposition. The third level involves major organizational processes used to meet customers’ objectives. This might include developing new products to satisfy consumer needs, for example. The lowest level (learning and growth) represents the foundation of an organization’s strategy and includes intangible assets such as organizational climate, skills, ability to learn, and technologies to support processes. An example of this type of a map was described in Figure 1-1 (minus the lowest level) in Chapter 1.
Cam Scholey, president of Advanced Management Initiatives and author of A Practical Guide to the Balanced Scorecard, provides the following steps for constructing BSC strategy maps, most of which parallel those of concept maps:
1.Choose the overriding objective. An organization should select the single objective it wants to achieve. This typically is a financial goal in for-profit enterprises and can be a more general objective in nonprofits. For instance, a consumer-goods manufacturer might have the objective of growing shareholder wealth; a nonprofit, branding itself as the leading health-care service provider in its market.
2.Select the appropriate value proposition. The goal of this step is to consider how your company creates value for your markets. According to Treacy and Wiersema, three primary value propositions are operational excellence, product leadership, and customer intimacy.1 One example of the latter would be the standard of service offered by Ritz-Carlton hotels. When room attendants notice a soft drink can in a room, they might note it so that guests have the same type of drink waiting for them during their next stay, no matter which property.
3.Determine general financial strategies to follow. All organizations must decide on an optimal combination of revenue growth, productivity, and asset use. Deciding on the composition of this blend will depend on the value proposition chosen. If you concentrate on improving internal processes, you probably should stress productivity and asset use. That is, if you can reduce costs by emphasizing these latter two objectives, you can become a price leader with corresponding revenue growth. Wal-Mart is an example of a company with this strategy.
4.Determine customer-focused strategies. Organizations must decide what and how much to offer their customers in terms of value. Two common examples are price and how a product might benefit customers in some way—for example, save them time or effort. Some companies might choose to emphasize price over functionality whereas others choose the opposite. For those deciding to stress price and functionally, they would be pursuing a strategy of optimal customer relationships. The outcome of these decisions will impact an organization’s brand image.
5.Decide how internal processes will support execution of strategies chosen. This stage is geared toward all the processes required to support the value proposition. Companies perceived as being innovative usually excel here due to their innovative internal processes. They might achieve excellence in creative ways to engage customers in improving operational procedures. For example, a bank involved in retail remittance might engage its customers—such as electrical utilities—in devising innovative ways to scan bills.
6.Implement the skills/capabilities and employee programs required to achieve strategy. All of the previous stages will make it evident how well a strategy is being implemented and what objectives still need to be achieved. Organizations must make key, strategic decisions with respect to the priority with which various conceptual gaps should be closed. Thus, organizations with a focus on products might implement strategies with an emphasis on R&D; companies with a focus on creating more emotional connections with customers might concentrate on programs likely to cultivate stronger customer relationships.
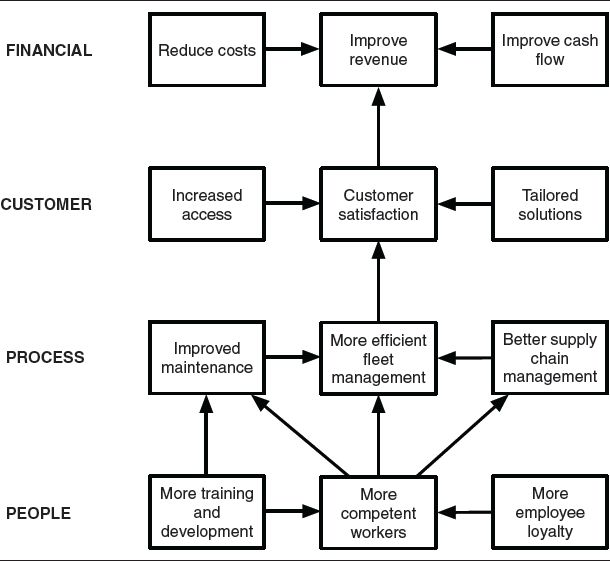
To illustrate how these stages can be used to create a strategy map, Scholey creates objectives for each of the four BSC perspectives. For instance, the financial perspective for a hypothetical transportation company might involve objectives such as cost reduction, increasing revenue per transportation unit, and improving cash flow. Customer objectives could include increasing customer satisfaction, solutions tailored to customer needs, and around-the-clock customer service access. For the third level of internal processes, objectives might be improved technology maintenance, better supply chain management, and more efficient fleet management. Finally, objectives at the lowest level, which is people, could involve attracting more competent workers, providing more professional training and development, and encouraging more employee loyalty.
A strategy map showing some possible relationships among these objectives is shown in Figure 5-2. In this example, customer satisfaction is depicted as the primary input to financial objectives. (Remember, this is not intended to be a complete portrayal of a strategy map.) Next, customer satisfaction is presented as being driven by efficient fleet management, which, in turn, is influenced by competent employees. One conclusion to be drawn from such a relatively simple schematic is that a fair amount of attention should be given to people and internal processes. This is because of the numerous hypothetical relationships assumed to exist within and between these two perspectives. For instance, employee training and development is seen as directly impacting improved maintenance within the process perspective and indirectly affecting more efficient fleet management in the same perspective because it affects more competent workers directly within the people perspective. (Note that if you read this paragraph as is without referring to the strategy map, it is much more difficult to understand the relationships among the objectives.)
FIGURE 5-2. Sample BSC strategy map for a transportation company.
The following sections will discuss concept maps created in different areas based on varying amounts and types of background information. This reflects how such maps typically are created in real life. We don’t always have access to all the information needed or there isn’t the time necessary to collect and analyze the information.
The first example is based on rather extensive information provided from the community services branch of a health-care organization. As described, the challenges are rather broad and more difficult to visualize. The context of a nonprofit organization also provides a perspective different from what is normally found in for-profit organizations.
The second example involves a for-profit organization (Sony) and was drawn from third-party perspectives solely for the purpose of illustrating how to create concept maps from a limited amount of information. Thus, it represents an alternate way to create a concept map without direct client input. It is not recommended that client input be excluded, of course, but external input can create unique perspectives that can be useful as supplemental data.
Example number three involves a map created with a client’s list of potential challenges from the client’s perspective. These are true presented challenges that require some editing using the criteria discussed in Chapter 4 on writing challenges. What distinguishes these challenges from some others is that they were created from more of a tactical than a strategic perspective.
Example #1: A Concept Map in the Nonprofit Sector
The emphasis of the preceding section was on constructing BSC-influenced strategy maps that are viewed in this book as similar to—but not the same as—innovation challenge concept maps. One difference between the two is that strategy maps are more intensive and encompassing than innovation challenge maps. By definition, strategy maps are oriented toward broad organizational strategies involving all major elements involved in achieving missions and visions; innovation challenge concept maps are designed with a specific focus on creating value through innovation with a more targeted, narrow focus.
Innovation challenge processes, whether competitive or not, always occur in the context of systemwide challenges; however, they may not be driven exclusively by formal or informal strategic plans. Thus, they might focus on internal processes, for example, and only indirectly pertain to customer or financial perspectives. This is not to say that those perspectives are unimportant. They are, of course, very important; they just may not be the focus for one specific innovation challenge conducted as single-event innovation. Over a period of time, multiple concept maps might be linked together in a more encompassing way (and probably should be).
To illustrate how a concept map might be created, consider the case of nonprofit hospitals and their impact on local communities. In this instance, the client’s presented challenge was how to persuade others that it deserved a tax-exempt status. Nonprofit hospitals are affected by the perceptions of various stakeholders beyond the local community, including legislators, regulators, consumer groups, and government enforcement agencies. The client was concerned that there was not enough awareness as to the role it played in contributing to the health-care system. For instance, many people may not be aware that nonprofit hospitals contribute a disproportionate share to the uninsured and underinsured, and frequently have trouble with reimbursement from payers. So, the client believes that major stakeholders must be educated on the issues involved.
To create an innovation challenge concept map from this document, I used the following steps:
1.Ask about the client’s perception of the primary, overall challenge. In this case, it was as previously described—convincing others of the need for the community service health-care facility to retain its tax-exempt status.
3.Read the document again, but note possible challenge objectives. If in doubt as to whether or not something is an objective, always err on the side of caution and include it.
4.Starting from the beginning, write challenges beginning with the words, “How might we . . . ?”
5.List all the challenges and organize them into affinity groups. To do this, note which challenges seem similar in some way. There is bound to be some overlap, so just do the best you can. (Consultants should seek input from their clients in the event of uncertainty.) An example is shown in Figure 5-3 on page 98.
6.Read each group and look for internal consistency. In other words, do the groups seem to hang together based on their commonalities? Do all the challenge objectives seem related in some logical way? If not, reorganize the challenges as needed.
7.Compare the groups to assess whether each group is relatively independent and does not overlap excessively with another. In the example, two of the groups are organized with an emphasis on community benefit. One has a focus on increasing understanding about the community benefit of nonprofit health services and the other on persuading others as to the degree of community benefit provided. This suggests the need to determine any type of priority or causality involved. That is, does persuading others about community benefit help to achieve understanding, does achieving understanding persuade others, or are both required? Finally, because of the overlap across groups, I decided to create a list of the three core challenges. It is at this point that a visual concept might help sort out relationships among the challenge objectives.
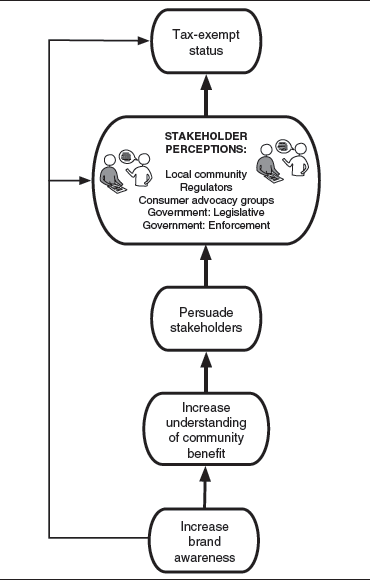
8.Review all of the groups again, and draw a preliminary concept map. To do this, I selected achieving tax-exempt status as the primary, ultimate objective. I decided to place it at the top of a concept map and work backward, first to the stakeholders who hold direct or indirect ability to influence those who could determine tax status, then to the challenge of persuasion, then to improving understanding of the community benefit, followed by branding and building awareness. A concept map for these challenges is also shown in Figure 5-3.
Here is a list of sample challenges for Community Healthcare Services, organized by the following categories:
Increase Understanding of Our Community Benefit
1.How might we increase public understanding of our community benefit role?
2.How might we increase regulator understanding of our community benefit role?
3.How might we increase understanding among consumer advocacy groups of our community benefit role?
4.How might we increase understanding of government agencies of our community benefit role?
5.How might we increase understanding of the IRS of our community benefit role?
Better Persuade Others of Our Need for Tax-Exempt Status
6.How might we better persuade the public of our need for tax-exempt status?
7.How might we better persuade regulators of our need for tax-exempt status?
8.How might we better persuade consumer advocacy groups of our need for tax-exempt status?
9.How might we better persuade government agencies of our need for a tax exemption?
10.How might we better persuade the IRS of our need for a tax exemption?
Better Persuade Others of the Community Benefit Role We Play
11.How might we better persuade the public of our community benefit role?
FIGURE 5-3. Nonprofit health-care organization challenges.
12.How might we better persuade regulators of our community benefit role?
13.How might we better persuade consumer advocacy groups of our community benefit role?
14.How might we better persuade government agencies of our community benefit role?
15.How might we better persuade the IRS of our community benefit role?
Communicate Better with Stakeholders and the Public
16.How might we communicate our mission better to the public?
17.How might we communicate our mission better to legislative bodies?
18.How might we communicate better our community health offerings?
Processes
19.How might we improve community needs assessments?
20.How might we improve our existing health-care services?
21.How might we increase program effectiveness?
22.How might we increase program effectiveness?
23.How might we better evaluate our programs?
24.How might we increase team effectiveness?
Access
25.How might we increase access to preventive care?
26.How might we increase access to remedial care?
27.How might we collaborate more with community groups?
Administrative/Financial
28.How might we reduce administrative costs?
29.How might we increase the reimbursement rate of health-care services?
30.How might we reduce the complexity of health-care delivery?
Consolidated Primary Core Challenges
31.How might we increase stakeholder understanding about our community benefit role?
32.How might we better persuade stakeholders about the need for our tax-exempt status?
33.How might we better persuade stakeholders about the need of our community benefit role?
As shown in Figure 5-3, achieving tax-exempt status might originate with a plan to build brand awareness of the facility’s services and the impact it has on people’s lives. One way to do this would be to create a strategic communications plan for increasing awareness regarding community benefit. This even could be the only challenge needed to achieve tax-exempt status. The logic then would follow that once understanding about community benefit is established (in terms of a “brand” known for its positive outcomes), key stakeholders can be persuaded as to the validity and importance of the benefit. With the stakeholders persuaded, tax-exempt status then should be attainable. The map also shows that tax-exempt status, once created with strong brand equity, will reinforce stakeholder perceptions and brand awareness.
In spite of this analysis of these challenges, there is nothing to “prove” that it correctly describes how the challenges are or should be related. This is a relatively subjective process. As with any other concept map, it is intended to help stakeholders better understand the challenges they face and how to act on them. To illustrate further how to construct concept maps, next is another business example with a less-strategic but more-limited focus that can be seen as more evident by using a diagram.
Example #2: A Concept Map from External Sources
In fall 2005, the CEO of Sony Corporation, Howard Stringer, faced a challenge of how to appease shareholders in the face of news that Microsoft and Intel had decided to support Toshiba’s next-generation DVD technology known as HD DVD. Sony’s competing product, Blu-ray, was seen as technologically superior. Although business analysts applauded Stringer’s decision to eliminate several thousand employees and reorganize management to engender more internal collaboration, they still were disappointed by the company’s ability to generate innovative consumer products.
According to an October 10, 2005, article in Business Week,2 Sony might do well to emulate Samsung Electronics, in spite of its differing technical capabilities. Business Week’s depiction of Sony’s situation provides fertile ground for generating a concept map to understand better what Sony is facing. Here is a summary of how Business Week views Sony’s challenges:
First, Samsung seems to have improved its ability to collaborate better with its partners and listen to its consumers’ needs. Sony, in contrast, tends to emphasize innovations it can brainstorm internally and then sell at sometimes inflated prices. Business Week cites the company’s decision to cling to its Trinitron television platform, well after flat-panel televisions were dominating the market. In addition, some of its products tend to favor the tastes of Japanese customers who desire more bells and whistles than the West may want.
One reason for this mind-set may be the factionalism that rules at Sony. Different business divisions such as music, movies, and electronics all may have conflicting visions and resist cooperating with one another. A noted example is when Sony’s music division prevented the consumer electronics area from making digital music players because of a concern about piracy. As Business Week stated, “Hello iPod; goodbye Walkman.”3
Another reason for some of Sony’s troubles may be the company’s inability to link up with strategic partners. For instance, it took some prodding, but Samsung eventually was able to persuade Apple to use Samsung’s flash memory chips in its music players. The result was the iPod Nano. Sony could do the same by licensing some of its technology. To accomplish such objectives, major cultural changes may need to occur inside Sony. New CEO Stringer now is taking steps to shake things up and may be able to overcome many of these challenges.
Based on this description, a concept map of Sony’s challenges can be developed as shown in Figure 5-4. As with all such maps, it is based on a set of assumptions about objectives to achieve, their relationship to one another, and their priority. The ultimate objective is to increase shareholder value. Since this, technically, is not a strategic map, it is not required to include any financials, but at least one end state in this area helps to provide some closure. The bottom of the figure shows two key objectives discussed in the article: increasing external collaboration and improving internal collaboration to overcome nonproductive factionalism. (It can be argued that minimal factionalism sometimes can be positive in spurring healthy competition.)
FIGURE 5-4. Hypothetical Sony Corporation concept map.
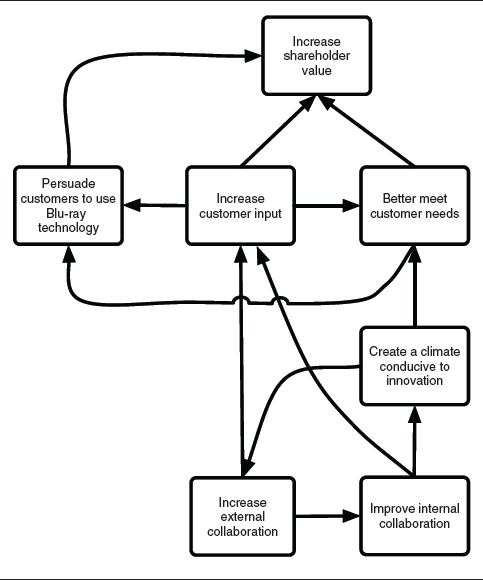
If internal collaboration is improved, then the organizational culture conducive to creativity—shown in Figure 5-4—also might be attained. A more conducive internal climate then could help increase the company’s ability to collaborate with externals such as partners and customers. If external collaboration is increased, it might help drive improved internal collaboration that would cycle through the process as indicated—that is, internal collaboration improving a conducive climate, which increases external collaboration and helps better meet customer needs while also reinforcing external collaboration, which, in turn, increases internal collaboration, et cetera.
One thing a little different about this concept map is that not all of the objectives have the same level of abstraction. Improving collaboration in two areas is relatively the same in terms of abstraction and specificity, and so are increasing customer input and better meeting customer needs. They both focus on customers in general. Persuading customers to use Blu-ray technology, in contrast, is a more focused objective with a very specific and measurable outcome. So, it could be argued that it shouldn’t be included in the map. However, if that is a priority objective, then it should be included, even if it varies in focus or abstraction.
In this instance, it is estimated that increasing input from customers is one potential way to persuade customers to use the technology. If research indicates that significant market share can be gained from successful sales of Blu-ray technology, shareholder value would increase, thus justifying its inclusion. Figure 5-4 also shows that increasing input from customers would better meet customer needs and possibly persuade them to use Blu-ray technology as would better meeting customer needs in general. That is, if Sony brands itself in terms of meeting customer needs in general, then it increases its ability to persuade first adopters to use new technology. (The addition of first adopters as a market target suggests using them as a positioning criterion to better frame customer challenges.)
Example #3: Constructing Tactical Concept Maps
Sometimes organizations conceive of challenges from more tactical perspectives, rather than strategic ones. Tactical approaches, of course, should be presented in the context of clearly articulated strategies, but it is not always feasible or possible to do so. It often is more expedient to address a challenge less abstractly to extinguish a crisis situation, even though it may be short term in its effect. Certain forces may dictate that these challenges be addressed first and then reengineered to fit into what is often an ever-changing strategic direction.
The next case is used to illustrate the conversion of presented challenges into reframed ones, accompanied by conceptual maps. The following is an edited, shortened list of the challenges the client, an automotive manufacturer, originally presented:
Original Presented Challenges
1.How do our brands become relevant to millennials?
2.What should our role be on community Internet sites (e.g., MySpace) and how should we market through those communities?
3.How do we market the use of alternative fuels?
4.When does it make sense to market a brand versus a vehicle nameplate?
5.What kind of pricing strategies should be pursued?
6.How will aging affect the baby boomer generation’s auto-buying behavior?
7.How to build a brand from scratch?
8.What is the market potential of increasing the appeal of small pickup trucks for women?
Then the client was asked to divide the challenges into high- and medium-priority groups:
High-Priority List of Original Presented Challenges
1.How do we market the use of alternative fuels?
2.When does it make sense to market a brand versus a vehicle nameplate?
3.What is the market potential of increasing the appeal of small pickup trucks for women?
4.How to build a brand from scratch?
Medium-Priority List of Original Presented Challenges
1.What kind of pricing strategies should be pursued?
2.How will aging affect the baby boomer generation’s auto-buying behavior?
3.How do our brands become relevant to millennials?
4.What should our role be in community Internet sites (e.g., MySpace) and how should we market through those communities?
Only the high-priority challenges will be addressed next, with an evaluation of the quality of the statements, suggested reframes, and then some potential conceptual maps.
Before attempting to construct a concept map of these challenges, it first is necessary to review the presented challenges and determine if they should be reframed. For this task, I will assume you already are familiar with the challenge criteria presented in Chapter 4, so they will not be repeated here.
1.How do we market the use of alternative fuels? The first high-priority challenge is stated a little too broadly, so its abstraction level probably is a little too high for effective ideation. It might be answered by listing different marketing media and selecting the most appropriate ones with the highest likelihood of reaching the target market. So, the answer might be to advertise in certain urban newspapers and magazines such as Fast Company, Wired, and Business 2.0. Or, an answer could be to conduct focus groups. Neither of these is especially innovative, so some reframes might be considered. For instance, a simple change in wording might be more beneficial, such as:
•How might we better market alternative fuels?
•How might we increase the brand equity of alternative fuels?
2.When does it make sense to market a brand versus a vehicle nameplate? One obvious concern with this challenge is the phrase, “When does it make sense.” This is a little ambiguous. However, it might have been stated in the context of some tacit knowledge possessed by the stakeholders. In the past, they may have used similar wording with explicit situations involving explicit criteria. For instance, previously they might have dealt with decision-making situations regarding when to introduce a new brand or line extension. The answer may have been something like, “The best time to introduce our new brand is when the marketing environment is characterized by factors such as disposable income and high unemployment.” By default, those factors then would make sense to those individuals in that situation. However, that is conjecture and should not be used as an excuse to avoid reframing the challenge.
Perhaps more important is that the presented challenge is offered as a decision choice situation rather than a problem-solving challenge created for open-ended ideation. To do this requires making some assumptions about the intentions of the client when the challenge was written. So, one option is to just ask the client. However, that doesn’t always yield positive results if the client has trouble articulating intentions, isn’t aware of them, or when you are the client. An alternative is simply to ask, “Why do we want to market a brand versus a nameplate?” In this case, responses might include, “Because our brand equity is so strong,” “Because we want to differentiate ourselves from our competitors?” and “We are uncertain about the reliability of our aided or unaided brand awareness.”
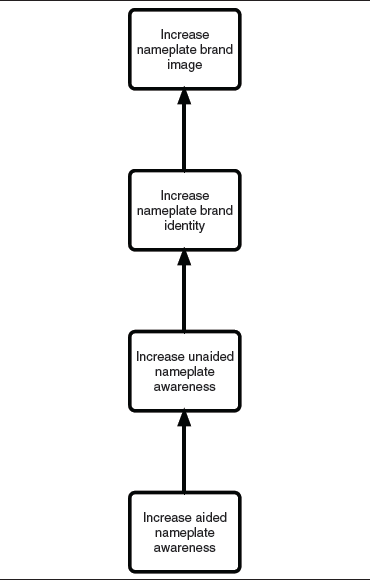
What may be most important here, however, is to recognize the difference between brand image and brand identity. Brand image consists of all those attributes with which consumers associate a particular brand; it is a current perception that implies an expected promise to be delivered on a number of variables—for example, value, performance, or reliability. Brand identity, in contrast, can be viewed as a desired state of consumer perceptions about a product and thus is more strategic. (In the context of this book, this distinction between image and identity represents the perceived gap denoting a problem, which was discussed previously.)
Brand image is established when consumers perceive specific, intended associations. One way to achieve those associations is by concentrating on brand. The first step to that would be increasing aided brand awareness that should result in unaided awareness. Once the later state of perceptions is reached (brand identity), the desired brand image should exist. Of course, this assumes that the process should start with a focus on aided brand awareness. It may be that unaided awareness should be addressed first, if aided awareness is deemed adequate.
With respect to the issue of marketing a brand versus a vehicle nameplate, the previous discussion suggests a focus on branding the nameplate and generating brand-positioning statements to enhance brand identity to the point where the desired brand image is created. With this strategy, reframed challenges, such as the following, can be created that provide the basis for a conceptual map:
•How might we increase aided brand awareness of our vehicle nameplates?
•How might we increase unaided brand awareness of our vehicle nameplates?
•How might we increase the brand identity of our vehicle nameplates?
Figure 5-5 shows a simple, linear, sequential, tactical concept map that starts with increasing aided nameplate awareness that should develop into unaided awareness that then creates the desired amount of brand identity and eventually leads to the nameplate image wanted for that particular vehicle. Again, this process is based on assumptions as to the amount of awareness that currently exists.
3.What is the market potential of increasing the appeal of small pickup trucks for women? This challenge has the appearance of being a task for conventional market research. And that just may be because it appears to be exactly that! So, one response might be to segment the female market for trucks, conduct focus groups, and use the results to determine if the market has the potential to explore further. The results then could be used to generate challenges because, as stated, the challenge seems to imply that the client wants to converge on a single result, rather than to diverge, as typically is the process for innovation challenges.
FIGURE 5-5. Concept map for marketing a brand vs. a nameplate.
Another reading on this challenge, however, would be that the primary objective is to increase the appeal of the company’s trucks for women. It then becomes a conventional marketing innovation challenge in which divergent ideas can be created. As with the previous priority challenge, it probably would be a good idea to seek clarification. Without clarification, you possibly could increase your understanding by again asking, “Why . . . ?” So, in this case, “Why do you want to learn the market potential?” and “Why do you want to increase the appeal of these cars to women?” Answers to these and similar questions might help to create such reframes as:
•How might we better market medium-size pickup trucks to women?
•How might we increase the appeal of medium-size pickup trucks to women?
•How might we persuade more women to purchase medium-size pickup trucks?
•How might we increase sales of medium-size pickup trucks to women?
•How might we increase market share of medium-size pickup trucks to women?
Although several of these challenges might be similar, minor wording changes sometimes help to spark the best reframes and, especially, the best ideas.
4.How to build a brand from scratch? This obviously is an incomplete sentence. In this case, the client wanted to brand a new product. The process here is similar to that suggested for priority challenge #2 discussed previously: Increase aided brand awareness, then aided awareness that should lead to brand identity. In addition to this rather staid approach, some other challenge reframes might be used to create some of the “attitude” often needed for creative thinking. For instance:
•How might we create aided brand awareness of our new product?
•How might we create unaided brand awareness of our new product?
•How might we increase the brand identity of our new product?
•How might we make potential customers “lust” after our new product?
A concept map for these challenges would be virtually identical to Figure 5-5 with the exception of adding one for the “lusting” challenge. This particular outcome logically would be an outgrowth of increasing brand identity and/or image.
NOTES
1.Michael Treacy and Fred Wiersema, The Discipline of Market Leaders: Choose Your Customers (Cambridge, Mass.: Perseus Books, 1995).
2.“The Lessons for Sony at Samsung” from “News Analysis & Commentary,” Business Week, October 10, 2005.
3.Ibid.