CHAPTER 5
Defining and Sequencing Activities
IN CHAPTER 4, YOU LEARNED to create a work breakdown structure. This chapter explains how to take the work packages from the WBS and build a logic network diagram that faithfully captures the relationships among the work packages discovered in the WBS.
Defining Activities
Begin with a solid understanding of the work breakdown structure. The lowest level of detail in the work breakdown structure is the work package or activity. Activities are small pieces of work that have clear accountability (can be assigned to a person or team) and consume time, resources, and money. If constructed correctly, the lowest level of the work breakdown structure contains all the activities needed to complete all project work. If, during the course of sequencing and scheduling the activities, you determine that additional activities need to be defined, be sure to add them into the WBS.
Sequencing Activities Using Network Diagrams
A network diagram is a graphical display of the sequence in which activities will be performed. The basis of a network diagram is the project’s work breakdown structure. Clearly, not all activities can be performed at the same time. The technique used to determine the logical sequence of work identifies and documents the dependency relationships between activities or work packages. To construct a network diagram, you need to answer the following question for each activity in the WBS: “What other activities must be completed before I can start this activity?”
Figure 5-1 Sample Network Diagram.
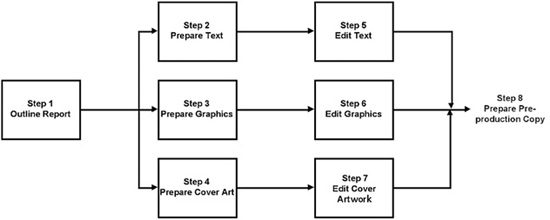
In a network diagram, the nodes (usually squares) represent the activities in the project, and the arrows imply the milestones or deliverables from each activity. Figure 5-1 illustrates part of a project that produces a report for management. Project managers typically create a network diagram using the precedence diagramming method (PDM), also illustrated in Figure 5-1. This is alternatively, sometimes referred to as activity-on-node because it shows the activities in a node—box—with arrows showing dependencies between activities and, therefore, the sequence in which they will be performed.
Project managers may also use a method called conditional diagramming method in specialized situations, such as research and development projects, where some activities might be performed more than once, only partially, or not at all. This method would be helpful in an investigational drug study where you would not know up front the number of trial test periods needed to gather sufficient data to complete the study.
Ideally, network diagrams are constructed twice in the planning process. The first time a network diagram is built assumes the availability of all essential people, tools, equipment, supplies, and money. The resulting diagram illustrates the most natural and efficient sequence of work that accomplishes the project’s objectives.
After this sequence appears, the project planning team then estimates the time needed for each activity in the network as well as the resources needed. This creates a demand function, or a requirement for each resource by activity and time period. The demand function is then contrasted with supply or capacity for each resource. All too often, what results is a situation in which demand exceeds supply or requirements exceed capacity. The planning process then has several options. The most frequent solution—a form of resource leveling—adjusts the schedule so that it accommodates resource availability. A second option is to change the dependency relationships in the network diagram. This may lead to activity overlaps, activity splitting, or other less-than-optimal scheduling solutions.
One final point is that the act of examining network logic and dependency relationships can validate the project’s work breakdown structure. Conversely, when your planning team begins to define predecessors for particular activities, you may discover that activities or work packages need to be added to the work breakdown structure or that current activities need to be modified to make the logic work.
Identifying Dependencies Between Activities
To identify which work activities may be completed at the same time and which must be completed in sequence, you need to determine the relationships or dependencies among the activities. There are four basic types of dependencies:
1. Mandatory (Hard) Dependencies. These are activities that must happen before another activity can start, usually because it is physically impossible to do otherwise. For example, in a construction project, the foundation must be completed before the walls can be framed. In a training project, you must develop the training before you can deliver it.
2. Resource Constraints. Each piece of equipment, each person, each facility, and every dollar is subject to availability as to time, place, quantity, and quality.
3. Administrative or Operational Dependencies. Sometimes work products must be approved before subsequent work begins. Frequently, such dependencies bring related requirements for exceptions, exemptions, appeals, permits, procedures, and regulations.
4. Dependencies of Convention. Sometimes the order of work is merely traditional, doctrinal, or simply a matter of preference.
Defining Activity Relationships
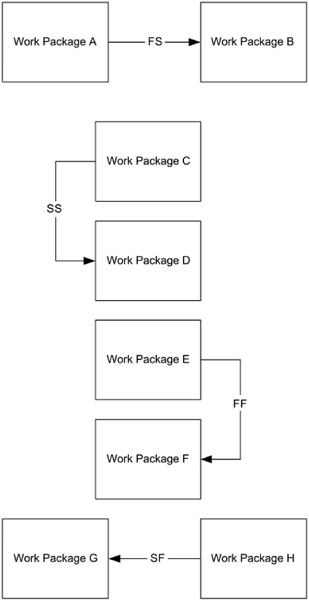
All activities in the network diagram must be linked using one of the following four logical relationships:
1. Finish-to-Start (FS). Activity A must finish before activity B can begin.
2. Start-to-Start (SS). Activity A must begin before activity B can begin.
3. Finish-to-Finish (FF). Activity A must finish before activity B can finish.
4. Start-to-Finish (SF). Activity A must begin before activity B can finish.
Of these four relationships, finish-to-start (FS) is the most common and start-to-finish (SF) is the least common. All four are illustrated in Figure 5-2.
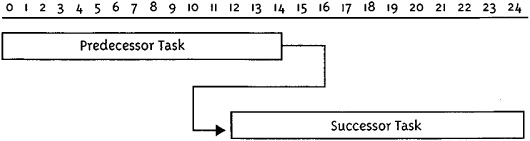
After determining the ideal sequence of activities, project managers may find that the project schedule doesn’t meet the needs of the customer. One way to accelerate (compress) the schedule is to overlap activities that, ideally, should wait for a finish-to-start relationship. This creates a lead relationship. For example, in a finish-to-start dependency with a ten-day lead, the successor activity can start ten days before the predecessor is finished. Figure 5-3 shows a lead relationship (with generic units of time).
Figure 5-2 Sample Network Diagram.
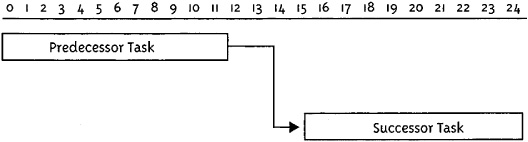
Conversely, a lag relationship defers the start of a successor activity. For example, in a finish-to-start relationship with a ten-day lag, a successor activity cannot start until ten days after the predecessor is complete. Lag can be helpful to schedule a waiting time needed (for example, the curing time needed after pouring concrete). Figure 5-4 illustrates a lag relationship (with generic units of time).
Depending on project conditions, it may become necessary for activities to be further defined using indirect constraints such as the following:
Must start on … (Activity must start on a given date.)
Must start before … (Activity must start before a given date.)
Must start after … (Activity must start after a given date.)
Must finish on … (Activity must finish on a given date.)
Must finish before … (Activity must finish before a given date.)
Must finish after … (Activity must finish after a given date.)
Sample Network Diagram
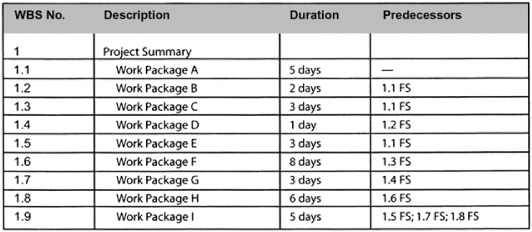
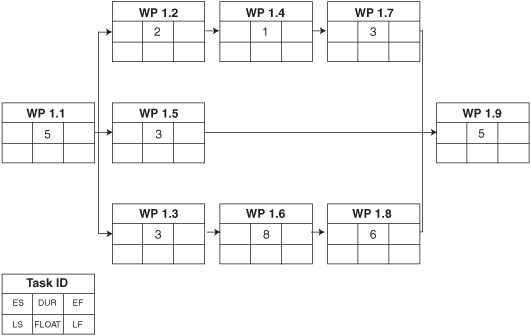
Let us put all this good information to use in a practical example. Imagine a project with nine work packages. The relevant information for each work package is found in Figure 5-5. Using this information, you could draw the network diagram shown in Figure 5-6.
Figure 5-5 Data Entry Requirements for a Network Diagram.