
Soil materials for earth construction: properties, classification and suitability testing
Abstract:
Each soil has a different particle size and/or mineral structure, based on the process of formation. This leads to different properties, which distinguish the constructional abilities of a soil. A brief discussion of soil types and classification is provided. Chief mineral constituents of clays along with their structures are explained. Different soil properties which make soil a suitable construction material are also discussed. Some soil property tests to identify soil properties, such as consistency and compaction are briefly explained. Different compaction procedures suitable for different soils are discussed. Water content in a soil plays an important role in providing strength to a soil during compaction.
6.1 Introduction
The term soil has different meanings, carrying different senses to different groups. Soil for use as a building material, is considered to include all naturally occurring loose or soft deposit overlying the solid bedrock crust, which is produced by the physical and chemical disintegration of rocks (weathering), and which may or may not contain organic matter. The use of soil as a building material is old as mankind itself. Since, the time the very first dwelling was built, humankind has been confronted with soil problems – most important being its highly varied nature. Depending on the methods of soil formation, a soil has distinct properties, which leads to its different uses.
6.2 Soil formation
The variation in soil properties can be explained by variations in the type of weathering, transportation, deposition and upheaval, again followed by weathering, and so on. Weathering is accomplished through physical and chemical agencies. The physical agencies causing weathering of rocks are periodical temperature changes, impact and abrasive actions of flowing water, ice and wind, and splitting actions of ice, plants and animals. Cohesionless soils are formed due to the physical disintegration of rocks. The chemical weathering of rocks, or decomposition as it is called, is caused mainly by the following principal reactions: oxidation, hydration, carbonation and leaching by organic acids and water. Clay minerals are produced by chemical weathering.
The products of rock weathering up to the size of gravel are termed soil, and beyond that size are considered rock fragments. Soils so obtained may be residual or transported. Residual soils are those which remain in place directly over the rocks from which they were formed. If they have been removed from the original bedrock and re-deposited somewhere else, they are known as transported soils. These deposits may be considerable in depth and their homogeneity or heterogeneity depends upon the manner of their transportation and deposition.
The various agencies of transporting and re-depositing soils from their original place of formation to other locations are water, ice, wind and gravity. Alluvium soils, marine deposits and lacustrine soils result from water being the agency of transport. These are usually stratified because of fluctuations in the stream velocity, and the average particle size decreases with increasing distance from the source of the stream. Glaciers cause the formation of drift, till, moraine or varve. These are a heterogeneous mixture of rock fragments and soils of varying sizes and proportions and, except the stratified drift deposited by glacial streams, are without any normal stratification. Dune sand and loess are the wind-blown (aeolin) deposits. Sand dunes consist of wind-drifted uniformly sized sand. Loess is wind-blown silt or silty clay with little or no stratification. Soils transported by gravitational forces are termed colluvial soils, such as talus, which consist of soil fragments and soil material collected at the foot of cliffs or steep slopes. The accumulation of decaying and chemically decomposed vegetable matter under conditions of excessive moisture results in the formation of cumulose soils such as peat and muck. Peat is a fibrous spongy mass of organic matter under various stages of decomposition in which plant forms can still be identified. Muck is essentially a thoroughly decomposed peat in which plant forms cannot be recognized.
Tremendous earth upheavals have taken place in the geological past, resulting in an enormous lifting, tilting and folding of soil deposits and rock formations. As soon as upland is formed, the cycle of weathering, transportation and deposition begins again, resulting in the further formation of soil.
6.3 Soil types
A soil is normally classified by the size of its particles. The various modes of weathering determine particle size, and then the form transportation causes a mixture of different soils. A group of particle sizes may have different behaviors and are classified accordingly. The individual soil particles can range from gravel size to clay size. The size of the soil particles is determined using sieve analysis and a particular size group refers to a particular soil. A number of classification systems exist to identify the general characteristics of soils (Das, 2006). All of the systems take into consideration the particle size and consistency of soils. AASHTO (American Association of State Highway and Transportation Officials) classification system, Unified Soil Classification System, Massachusetts Institute of Technology (MIT) Classification System, British Standards Classification System, Canadian System of Soil Classification, Indian Standards of Soil Classification, etc. are among many of the prevalent classifications that are followed in different regions. A typical soil classification by MIT (Scott and Schoustra, 1968) classifies various soil groups according to the individual soil grain size (mm):
Sands and gravels are termed as coarse-grained soils and the silts and clays as fine-grained soils. A known weight of soil is made to pass through a stack of sieves, with the sieve sizes decreasing towards the bottom and based on the sizes of the classified soil groups. The coarse-grained soils are cohesionless soils exhibiting zero plasticity. It is the fine-grained soils, especially the clays, which are plastic, that contribute more to building materials for earthen construction. For the fine-grained soils, further classification is carried out using a hydrometer or sedimentation analysis, which uses Stokes’s law for the fall of suspended individual small-sized soil particles (silts and clays).
Figure 6.1 shows some shapes of particle size distribution curves. A steep slope (curve a) indicates a uniform soil. Humps in the curve indicate a soil to be a mixture of two or more uniform soils (curve b). A steep curve in the sand sizes that gradually flattens into a long, flat curve in the fine sizes would characterize a soil that was formed by weathering (curve c). A flat curve shows a wide range in particle sizes, which indicates a well-graded soil (curve d). A flat portion in the curve indicates a deficiency of particle sizes at the flat interval, d1 – d2, of curve e. Soils in the early stages of their development are mainly the results of physical weathering, characterized by the presence of large amounts of coarse material (curve f). Soil g varies widely in its coarser range, with the finer fractions being more uniform (Jumikis, 1967).
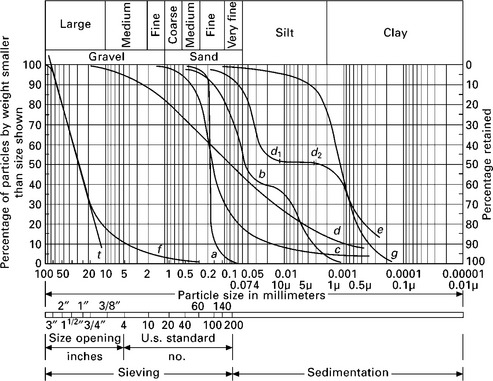
6.1 Gradation curves for different soils (Jumikis, 1967).
Laser diffraction analysis is also a widely used technique for particle size analysis. Instruments employing this technique are considered easy to use and particularly attractive for their capability analyzing particle sizes in the range 0.02 to 2000 m. Rapid data acquisition and ease of verification are two important factors that make it a better technique than conventional sedimentation analysis.
6.3.1 Clays
Acids dissolved in pore water and soil solids combine to form a solution of grains. These minerals combine and crystallize under differing conditions of temperature and pressure, giving rise to new minerals, which may have entirely different arrangements of molecules to the original minerals. Thenew arrangement gives rise to smaller sized mineral particles, which may be needle-or plate shaped, with lengths or diameters tens to hundreds of times their thickness. The new minerals thus formed are known as the clay minerals, which vary in size from hundredths of a micron to tens of a micron in diameter. The surface area of these particles is very large leading to high intermolecular forces on the surface and edges, which attracts bipolar water molecules. This property that binds water to the soil grain is greatly exploited in its use as a construction material. The amount of water present in clayey soils plays an important role in defining the clay characteristics, but equally important is the role of type of mineral(s) present in the clay.
Structure of clay minerals and their surface activity
As mentioned earlier, the characteristic properties of clay minerals are high specific surface and high specific activity. The behavior of conglomerations of such minerals is governed largely by surface phenomena. It is therefore necessary to study the atomic structure of these minerals. X-ray diffraction analysis of the clays (Mitchell, 1993) has shown the clay minerals to have a crystalline structure. There are two fundamental building blocks for the clay minerals, which are complex silicates of aluminum, magnesium and iron. One is silica tetrahedral unit (Fig. 6.3a), in which four oxygen atoms or hydroxyl molecules with the configuration of a tetrahedron enclose a silicon atom. The tetrahedra are combined in a sheet structure so that the oxygen of the bases of all the tetrahedra are in a common plane, and each is shared by two tetrahedra (Fig. 6.3b). The silica tetrahedral sheet alone may be reviewed as a layer of silicon atom between a layer of oxygen atoms and a layer of hydroxyl molecules (tips of the tetrahedra). The silicon sheet is represented by the symbol shown in Fig. 6.2, representing the oxygen basal layer and the hydroxyl apex layer.
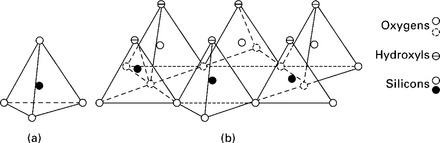
6.3 Structural units in the silica sheet (Grim, 1968).
The second building block is an octahedral unit in which an aluminum, iron or magnesium atom is enclosed by six hydroxyls with the configuration of an octahedron (Fig. 6.5a). The octahedral units are put together into a sheet structure (Fig. 6.5b), which may be viewed as two layers of densely packed hydroxyls with a cation between the sheets in octahedral co-ordination (Grim, 1968). When the cation is aluminum, this unit is known as gibbsite; when it is magnesium this unit is called brucite. This unit is shown in Fig. 6.4.

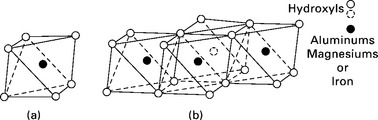
6.5 Structural units in the octahedral sheet (Grim, 1968).
About 15 minerals are ordinarily classified as clay minerals, and these belong to four main groups: kaolin, illite, montmorillonite and palygorskite (Punmia et al, 2005). The structure of the first three minerals, which are the most common, is discussed here.
Kaolinite is the most common mineral of the kaolin group. Its structural unit consists of gibbsite sheets (with aluminum atoms at their centers) joined to silica sheets through the unbalanced oxygen atoms at the apexes of the silicas (i.e. the apexes of the silica layer and one of the gibbsite molecules form a combined layer). This structural unit (Fig. 6.6) is about 7 Å thick. The kaolinite mineral or crystal is a stack of 7-Å-thick sheets, which can be symbolized as shown in Fig. 6.7a. The structure is like a book with each leaf of the book 7-Å-thick. Such successive layers are held together with hydrogen bonds (Fig. 6.7b). The kaolinite crystal occurs in clay as platelets from 1000–20,000 Å wide by 100–1000 Å thick. The hydrogen bond is fairly strong and crucially the intra-lamellar spacing is very small, hence it is extremely difficult to separate the layers, and, as a result, kaolinite is relatively stable and water is less able to penetrate between the layers, thus it exhibits relatively little swell on wetting. The platelets carry negative electromagnetic charges on their flat surface, which attract thick layers of adsorbed water thereby producing plasticity when kaolinite is mixed with water.
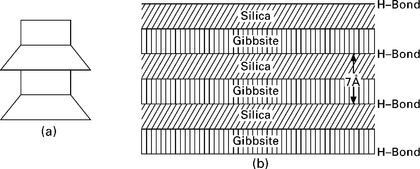
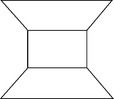
Montmorillonite is the most common of all the clay minerals in expansive clay soils. It is made up of sheet-like units. Each unit is made up of a gibbsite sheet sandwiched between two silica sheets, shown in Fig. 6.8. The thickness of each unit or sheet is about 10 Å and the dimensions in the other two directions are indefinite. The gibbsite layer may include atoms of aluminum, iron, magnesium or a combination of these. In addition, the silicon atoms of the tetrahedrals may interchange with aluminum atoms. These structural changes are called amorphous changes and result in a net negative charge on the clay mineral. Cations which are in soil water (i.e. Na +, Ca++, K+, etc.) are attracted to the negatively charged clay plates, and exist in a continuous state of interchange. The base 10 Å thick units are stacked one above the other in layers and are symbolized as shown in Fig. 6.9a. There is a very weak bonding between the successive sheets and water may enter between the sheets causing the minerals to swell (Fig. 6.9b). The spacing between the elemental silica–gibbsite–silica sheets depends on the amount of available water to occupy the space. For this reason, montmorillonite has an expanding lattice. Each thin platelet has the power to attract to each flat surface a layer of adsorbed water approximately 200 Å thick. Soils containing these minerals exhibit high shrinking and swelling characteristics, depending on the nature of exchangeable cations present.
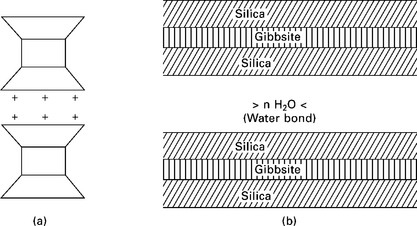
Illite has a structure similar to montmorillonite except that there is substantial (± 20%) replacement of silicon atoms by aluminum in the tetrahedral layers and potassium atoms are between the layers serving to balance the charge resulting from the replacement and to tie the sheets together. The basic unit is represented as shown in Fig. 6.10a. The cation bond of illite is weaker than the hydrogen bond of kaolinite, but stronger than the water bond of montmorillonite. Due to this, the illite crystal (Fig. 6.10b) has a greater tendency to split into ultimate platelets consisting of a gibbsite layer between two silica layers, than that in kaolinite. However, the illite structure is less expansive because of movement of water between the sheets, as in the case of montmorillonite. Illite particles may be 50–500 Å thick and 1000–5000 Å in lateral dimensions.
Clay minerals have the distinctive property of adsorbing certain ions at the surface. This suggests that the mineral surfaces are polar, like water. The surface thus attracts ions, polar molecules or polar radicals, which in turn attracts ions and polar molecules from the environment. The electrostatic attraction between the opposite charges thus leads the process of adsorption. When the distribution of charges is equaled, i.e. negative and positive, a similar distribution of positive and negative charges is seen in the adsorbed layer. If the distribution of the charges on the surface of minerals is not uniform, the adsorption of ions will be of a different degree. As a result, an electric double layer will be formed at the surface, where a remarkable difference is seen in the electric potential of the mineral surface and of the surrounding solution.
Moisture entering an adobe brick causes clays to swell and release their bonds so that it disintegrates. To prevent disintegration, soil stabilizers are added to the basic soil mix to waterproof or increase the weathering resistance of the adobe brick. The most commonly used stabilizers are sand, straw, Portland cement, lime and bituminous and asphalt emulsions (Clifton, 1977), although as many as 20 different materials have been found in use (Wolfskill et al., 1970). Further details of soil stabilization are given in Chapter 9.
6.4 Soil consistency
The term consistency states the relative ease with which a soil can be deformed. It denotes the degree of plasticity of a soil and is indicated by terms: soft, firm, stiff or hard. In practice, only the fine-grained soils, particularly clayey soils, for which the consistency is related to a large extent to water content, are described using these terms. Depending on the water content the following four states of consistency are used for the behavior of a soil: (i) the liquid state, (ii) the plastic state, (iii) the semi-solid state and (iv) the solid state. The water contents at which the soil passes from one state to the next are known as consistency limits. The significance of these limits was first demonstrated by Atterberg, a Swedish soil scientist, and they are also known as Atterberg limits (Das, 2006).
In a very wet state, a fine-grained soil acts as a viscous liquid and is said to be in the liquid state. As the soil dries, it starts acquiring plastic properties and is said to be in the plastic state. The soil no longer flows like a liquid, but continues to be deformable, or plastic, without cracking. With further reduction in water content the soil ceases to be plastic and becomes brittle. It is then said to be in the semi-solid state. Up to the semi-solid state, reduction in the volume of soil is nearly equal to the volume of water lost. When the volume of the soil stops reducing, even with further reduction of the water content, the soil is said to be in the solid state. The limiting water contents expressed as a percentage of the dry mass, when the soil passes from liquid to plastic, plastic to semi-solid and semi-solid to solid states of consistency are respectively termed liquid limit, plastic limit and shrinkage limit. The transition between each state is gradual and there is no abrupt change in the physical properties of a soil. Arbitrary tests are adopted to precisely define the limits.
The liquid limit can be defined using the Casagrande technique, as the minimum water content at which a pat of soil cut by a groove of standard dimensions will flow together for a distance of 13 mm under the impact of 25 blows in a standard liquid limit apparatus. It is the water content at which the soil shows a definite shearing resistance, though small, as the water content reduces. In the cone penetrometer test, the liquid limit of the soil is the water content at which an 80 g, 30° cone sinks exactly 20 mm into a cup of remolded soil in a 5 s period.
The plastic limit is the minimum water content at which the soil can be rolled into a thread of approximately 3 mm in diameter without breaking.
The shrinkage limit is the minimum water content at which the reduction in water content will not cause a decrease in volume of the soil. It is the minimum water content at which a soil just becomes completely saturated.
The range of consistency within which a soil exhibits plastic properties is called the plastic range and it is indicated by the term plasticity index. The plasticity index is defined as the numerical difference between the liquid limit and the plastic limit:
Cohesionless coarse-grained soils have no plastic state of consistency, and the liquid and plastic limits may be said to coincide, i.e., IP is zero. When the liquid limit or the plastic limit cannot be determined (in the case of sandy soils, the plastic limit should be determined first), the plasticity index is reported as NP (non-plastic). When the plastic limit is equal to or greater than the liquid limit, IP is reported as ‘zero’.
The behavior of saturated fine-grained soils with their natural water contents may be predicted by their consistency index. The importance of the consistency index for cohesive soils is comparative to that of the density index for cohesionless soils. The consistency index is defined as the ratio of liquid limit minus the natural water content to the plasticity index:
A soil with IC as zero is at its liquid limit and with IC as unity is at its plastic limit. If IC < 0, the natural water content of the soil is greater than the liquid limit and the soil behaves like a liquid. If IC > 0, the soil is in a semi-solid state and is stiff.
The liquidity index is defined as the ratio of the difference between the natural water content and the plastic limit to the plasticity index:
The liquidity index determines in what part of its plastic range a given soil mass lies.
Until the soil reaches its shrinkage limit by reduction in the water content, the total volume change is equal to the water removed. The ratio of a given volume change, expressed as a percentage of the dry volume, to the corresponding change in water content above the shrinkage limit is called the shrinkage ratio:
where V1 = volume of soil mass at water content w1
V2 = volume of soil mass at water content w2
It can be shown that shrinkage ratio is equal to the mass specific gravity of the soil in its dry state, i.e.
Based on knowledge of shrinkage ratio, we have two important terms, which are frequently used in the construction of building with earthen materials. The volumetric shrinkage is defined as the decrease in the volume of soil mass, expressed as a percentage of the dry volume of soil mass, when the water content is reduced from a given percentage w1 to the shrinkage limit:
Linear shrinkage is defined as the decrease in one dimension of a soil mass expressed as a percentage of the original dimension, when the water content is reduced from a given percentage to the shrinkage limit:
The above mentioned plasticity characteristics vary depending on the mineral present in the soil, which is responsible for the swelling or shrinkage characteristics. The plasticity index is typically 5–10 for low plasticity and 20–40 for high plasticity soils. For montmorillonite clays, it may be greater than 200. The shrinkage limit varies typically from 8.5–30 (Mitchell, 1993), with a lower value indicating expansive clays. Linear shrinkage values are typically one-half of the plasticity index value (Bell, 2000).
The proportions of expandable/non-expandable clay minerals and the amount of the clay-size fraction in adobe soils help to control the quality of adobe bricks, pressed-earth blocks and rammed-earth walls. Clay-size fractions high in expandable clay minerals relative to non-expandable clay minerals increase the compressive strengths of adobe materials. That is, a soil with a small clay-size fraction high in expandable clay minerals will make an adobe product high in compressive strength. Generally, inclusion of expandable clay minerals in an adobe soil results in greater compressive strength than inclusion of non-expandable minerals; however, too much of expansive clay in the soil may make a poor adobe product. In such soils, depending on the presence or absence of water, expansion and contraction of the clay may cause excessive cracks in the adobe product. More silt, sand or straw can be added to the soil to dilute the effect of the expandable clay minerals (Smith and Austin, 1989).
6.4.1 Loam
Earth used as a building material is often given different names. Referred to as loam, it is a mixture of clay, silt, sand and sometimes larger aggregates like gravel or stones (Minke, 2000). Loam does not stand for a standard building material, as the percentage amounts of its different constituents may differ according to the site. Binding strength and workability is achieved by adding water to the mixture, i.e. loam. The evaporation of water causes shrinkage cracks. This disadvantage of loams can be reduced by decreasing the clay content, desired for a particular mode of construction such as mortar and mud bricks, rammed earth or compressed soil blocks.
Loam has been found to have many advantages compared to common building materials. Its composition may make it weak, swelling with water contact; however, under the influence of vapor, it remains solid by absorbing the humidity and retaining rigidity, and hence it balances the air humidity to a higher extent. It has been found in many such houses built in Germany to have a relative humidity of about 50% throughout the year, fluctuating less than 10%, with lower levels in summer than in winter. Loam stores solar heat, balancing the indoor climate. Further, loam is energy efficient; on-site production accounts for only about 1% of energy required for production and transportation of reinforced concrete or burnt bricks. The most impressive aspect is that it is reusable, thus saving material and transportation costs. Not all types of soils can be used for earth construction, especially soils with high organic content and with shrinking/swelling properties. The US National Bureau of Standards even has a formula: 17% clay, 25% silt, 19% coarse angular sand and 42% fine sand. More than 30% clay should be avoided to prevent shrinkage cracks.
6.5 Compaction of soil
Compaction of soil is defined as the process of packing soil particles closely together by mechanical manipulation, thus increasing the dry density or dry unit weight of the soil. Practically speaking, this process refers to a reduction mainly in the air voids under a loading of short duration, such as the blow of a hammer or passing of a roller, or due to vibration. Study of soil compaction is important as it enables us to have earthen materials for building construction of the desired strength, especially in stabilized rammed earth and cob constructions.
Compaction is measured quantitatively in terms of the dry density to which the soil sample can be compacted. A number of laboratory tests have been developed for studying the compaction of soil. These methods are based on any one of the following methods or types of compaction: dynamic or impact, kneading, static and vibratory. In dynamic or impact compaction, soil is compacted under the blows of a rammer dropped from a specified height. In kneading compaction, a tamping foot, relatively small in cross-sectional area, is used to compact the soil. During compaction the penetration of the tamping foot has a kneading action on soil, which induces a relatively greater degree of remolding or change in structure. The compaction of soil in a mold is termed static compaction. In the vibratory method of compaction, employed for sandy soils, soil is compacted by vibrations. The main aim of these tests is to arrive at a standard that may serve as a guide and a basis of comparison for field compaction. A typical compaction curve for four types of soils is shown in Fig. 6.11. The impact compaction method has been used. The curves show that the grain size distribution, shape of soil grains, specific gravity of soil grains, and the amount and type of clay minerals greatly influences the maximum dry unit weight and optimum moisture content.
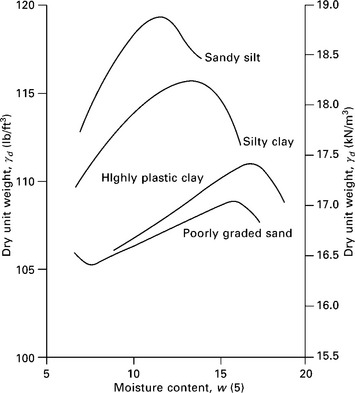
6.11 A typical compaction curve for four different soils (Das, 2006).
The moisture (water) content principally affects the resistance to relative movement of soil particles, particularly the fines of a soil. The resistance to particle movement is provided by the friction between soil particles and the attractive and repulsive forces of the adsorbed water layers. When only a relatively small amount of water is present in soil, it is firmly held by electrical forces at the surface of the soil particles, which leads to a low interparticle repulsion and the particles do not move over one another easily. Thus at a low water content, less compaction or low dry density with high percentage of air voids is obtained. The increase in water content results in reduction in the net attractive forces between the soil particles, which permits the particles to slide past each other more easily into a more oriented and denser state of packing together. The increase in dry density with reduction in air voids continues till the optimum moisture content is reached. Each soil type has its own optimum moisture content for a given compactive effort.
After the optimum moisture content is reached, the air voids approach approximately a constant value as further increase in water content does not cause any appreciable decrease in them, even though a more orderly arrangement of particles may exist at higher moisture contents. The total voids due to water and air in combination continue to increase with increase of moisture content beyond optimum, and hence, the dry density of the soil fails.
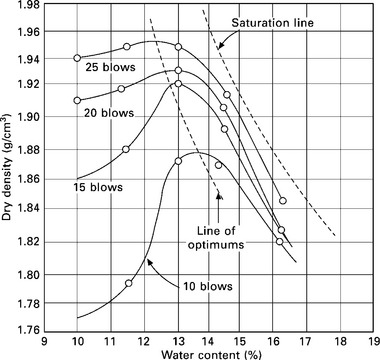
For all types of soil and with all methods of compaction, the effect of increasing the compactive energy is to increase the maximum dry density and to decrease the optimum moisture content. A typical pattern of moisture-density curves that results in increasing compactive effort is shown in Fig. 6.12. In general, increasing compactive effort shifts the position of the entire moisture-density curve upwards and to the left. The line joining the peaks of the curves, termed the line of optimums, follows the general shape of the zero air voids line or the saturation line.
The maximum dry density that can be obtained by compaction depends upon the type of soil. Well graded coarse-grained soils attain a much higher density than the fine-grained soils. Heavy clays attain relatively low densities. Because of the greater surface area of fine particles, fine-grained soils require more water for their lubrication and thus have higher optimum moisture contents.
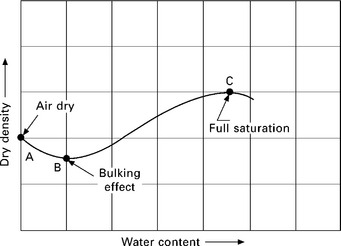
In the case of cohesionless soils, which are devoid of fines, the dry density decreases with an increase in moisture content, in the initial stage of the curve, as shown in Fig. 6.13. This is due to the ‘bulking of sands’ wherein the capillary tension resists the soil particles to achieve a denser state. On further addition of water, the meniscus is destroyed, letting the soil particles pack closer together, resulting in an increase in dry density.
Theoretically, there exists a particular gradation that, for a given maximum aggregate size, will produce the maximum density. This gradation would involve a particle arrangement where successively smaller particles are packed within the voids between larger particles, resulting in a minimum void space between particles and producing a maximum density. In 1907, Fuller and Thompson developed a widely used equation to describe a maximum density gradation for a given maximum aggregate size:
6.6 Conclusion
There are many varieties of soil because of the different processes through which they were formed. Each soil has a different structure and composition, and hence the same kind of treatment for each is not appropriate. For clays, consistency is an important property and contributes to the binding power of the soil when combined with cohesionless soils. Compactive effort, along with optimum water content is an effective tool to strengthen the soil used in building construction.
Our current expertise in soil sciences gives us an opportunity to dig deeper in this age-old mud technology and make it up-to-date, by augmenting it with different materials and adopting superior methodologies while keeping the primitive base concept, which was energy efficient.
6.7 References
Bell, F.G. Engineering Properties of Soils and Rocks. Wiley-Blackwell; 2000.
Clifton, J.R. Preservation of historic adobe structures—a status report. In: Institute for Applied Technology. Washington, DC: National Bureau of Standards; 1977. [NBS Technical Note 934, 30 pp].
Das, Braja M. Principles of Geotechnical Engineering, 6th. Cengage Learning; 2006.
Grim, Ralph E. Clay Mineralogy. McGraw Hill; 1968.
Jumikis, A.R. Introduction to Soil Mechanics. D Van Nostrand Company, Inc.; 1967.
Minke, Gernot. Earth Construction Handbook. WIT Press; 2000.
Mitchell, James K. Fundamentals of Soil Behavior, 2nd. John Wiley & Sons, Inc; 1993.
Punmia, B.C., Jain, Ashok Kumar, Jain, Arun K. Soil Mechanics and Foundations. Laxmi Publications; 2005.
Scott, Ronald F., Schoustra, Jack J. Soil Mechanics and Engineering. McGraw Hill; 1968.
Smith, Edward W., Austin, George S., Adobe, pressed-earth, and rammed-earth industries in New Mexico. Bulletin 127, New Mexico Bureau of Mines & Mineral Resources, 1989.
Wolfskill, L.A., Dunlap, W.A., Gallaway, B.M. Hand-book for building homes of earth. Washington, DC: Department of Housing and Urban Development, Office of International Affairs; 1970. [[160 pp] ].
6.8 Appendix
w1, w2 water content, expressed as percentage
V1 volume of soil mass at water content w1
V2 volume of soil mass at water content w2
P percent finer than an aggregate size
d aggregate size being considered
n parameter which adjusts curve for fineness or coarseness (for maximum particle density n ≈ 0.5 according to Fuller and Thompson).