
Natural disasters and earth buildings: resistant design and construction
Abstract:
Earth buildings are particularly vulnerable to earthquakes, tropical storms, major wind storms and floods; the risks, causal mechanisms and failure modes for these natural hazards are described. Thousands die each year due to unreinforced earth building collapses in earthquakes; designers must assess the hazard, ground conditions and seismic lateral loads and use suitable structural forms and reinforcement. Unstabilised earth materials are highly susceptible to flood inundation requiring site consideration; in severe winds the low tensile strength requires special attention especially to the roof tie-down anchorage. The risks from other natural hazards are overviewed and the design principles are discussed.
19.1 Introduction
19.1.1 Chapter overview
Natural hazards to which earth buildings are particularly vulnerable are earthquakes, tropical storms, major wind storms and floods. The risk profile of each of these natural hazards varies around the world.
Conventional earth construction has very heavy mass so buildings with earth walls attract large loads during seismic events. The low tensile strength and brittleness of earthen materials makes them susceptible to damage and life-threatening collapse. In low-seismic-risk areas it is essential that buildings are well tied together and great care is taken with connection details. In moderate and higher risk areas the earthquake hazard must be quantified, seismic lateral loads determined, and the design must include suitable reinforcement to prevent sudden collapse and take best advantage of the earth material strength. A regular structural form should be selected to respond well dynamically.
Severe winds and torrential rain are generated by tropical storms that originate over warm seas. They intensify as they move away from the equator then reduce in temperate latitudes. They attenuate as they pass over land so the winds and storm surges are at their most devastating in coastal areas and on islands. The most frequent wind damage to buildings is the peeling away of roof claddings or removal of whole roofs. Special attention must be paid to the tie-down anchorage into low-tensile-strength earth materials. Tall buildings, long or high unsupported lengths of wall, and lightweight earth construction are more vulnerable to wind loads and require specific design detail. Flooding can be from rainfall, meltwater or sea level rise. Most earth materials are highly susceptible to inundation so the most significant mitigation is to identify the possible flood risks and to ensure that earth walls are well above possible rising flood waters. When there are slopes nearby, it is necessary to identify if there is any catchment or drainage channel that could flow towards the building. This may require a diversion or that the building is moved to a better position.
Preparation for earth construction requires that designers identify the natural hazards for the site, establish the level of risk and building vulnerability from each hazard and select the appropriate design response to achieve a safe earth building.
19.1.2 Types of hazards and their distribution
Natural hazards such as typhoons, tornados, storm surges, blizzards, earthquakes, tsunamis, floods, landslides, land subsidence, droughts, wildfires and volcanoes pose dangers to most types of buildings. This section briefly overviews the overall context of natural hazards with a focus on hazards to which earth buildings are most vulnerable. As illustrated in Fig. 19.1, zones of high hazard cover large parts of the world. Tropical storms move from the outer tropics away from the equator into vulnerable coastal areas particularly in south east Asia, the Caribbean and southern USA, and Oceania. Extra-tropical gales bring major winds across northern Europe and tornadoes occur where warm and cold air masses meet and are most severe in areas with open plains. Floods are most frequent in low-lying areas or mountainous areas, whereas earthquakes and volcanoes are most prevalent on tectonic plate boundaries.
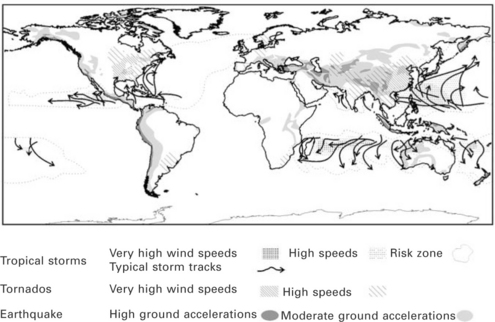
19.1 Distribution of natural hazards of significance to earth buildings (Munich Reinsurance Company, 2011; UNEP UNSDR, 2011).
Figure 19.2 graphically illustrates the relative numbers of significant disasters, which includes biological, extreme temperature and drought events over a 25-year period. Table 19.1 provides disaster data that are relevant to structures listed by decade from last century. Earthquakes, tsunami and volcanoes – events with geological origins – make up approximately 14% of physical events from 1950 to 1999 when compared with hydrological windstorms and floods. The table also shows that the numbers of disasters are statistically very variable. Increasing numbers of events can additionally be attributed to recording becoming more comprehensive with time.

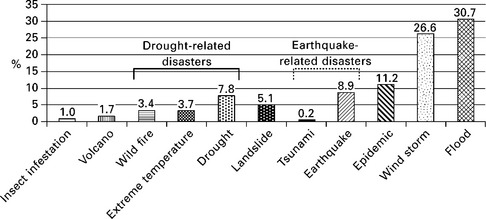
19.2 Proportions of types of natural disasters 1970–2005. redrawn from UNSDR, 2006
19.1.3 Hazard, vulnerability and risk
The expected damage to life and property, or risk, can be determined from a combination of hazard, vulnerability and value. Hazard can be defined as the potential threat from any particular phenomenon that will impact on human activity. Vulnerability is the level of exposure and susceptibility as a proportion of the value of an item. This can be reduced by community preparedness and response during and after an event. Risk is the quantifiable probability that social or economic consequences will exceed a specified value at a particular site. In terms of property, equation 19.1 evaluates risk for a given hazard.
Engineers, architects, designers and builders minimise vulnerability by designing and constructing structures prior to an event to resist that hazard, and incorporating design features to mitigate the damage and social impact during and after the event.
19.2 Earthquakes and earth buildings
19.2.1 Vulnerability of earth buildings to earthquakes
Low-quality traditional earth buildings are very vulnerable to earthquakes and have been responsible for thousands of fatalities per year. This is due to a combination of ignorance of good structural practice, as these houses are frequently built in low socio-economic societies where people lack education and resources; and the inherent properties of earth construction. Conventional earth building materials are heavy, brittle and have low tensile strength while the best materials for good seismic performance are lightweight and ductile (not brittle). The sobering fatality statistics in Table 19.2 are dominated by poor countries and highlight the need for good engineering and detailing.
Table 19.2
Twentieth-century earthquake fatalities

1900–1999 Dowrick (Dowrick, 2009) *2000–2009 from USGS (USGS, 2010a) includes 228,000 from 2009 tsunami
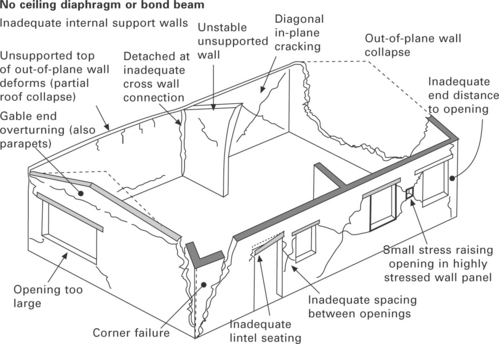
In February 2010 a great earthquake of moment magnitude (Mw) 8.8 offshore from Maule in Chile combined with a tsunami for which there was minimal warning and resulted in 577 deaths. There were a large number of older adobe and unreinforced masonry structures in the Talca area with perimeter walls as the primary load resisting system that were damaged (EERI, 2010a). The absence of reinforcement or bond beams, and weak connections between adjoining walls led to the collapse of walls and roofs in many buildings, and resulted in some fatalities. Many unreinforced buildings collapsed and an out-of-plane failure example is shown in Fig. 19.3 about 80 km from the epicentre. Conventional reinforced masonry suffered less, with damage reported as predominantly diagonal cracks and cracks around openings (EERI, 2010a).
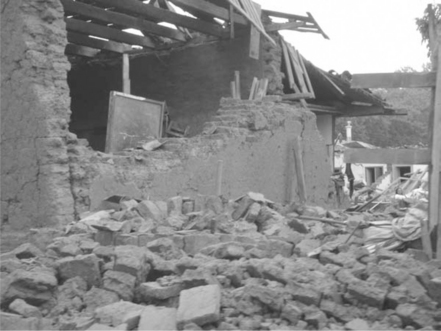
19.3 Out-of-plane wall failure of a house in Parral, Chile with no ceiling diaphragm, poor connection to the cross wall and lack of connection at the near corner. (photo: Exequiei Araos)
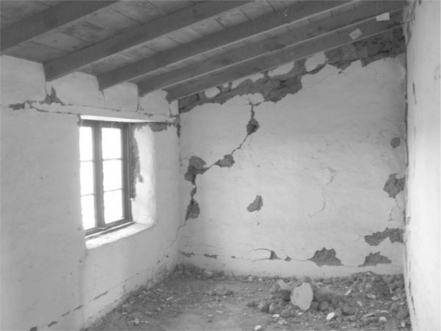
In september 2010, a Mw 7.1 earthquake occurred near Darfield, 40 km from Christchurch, New Zealand (population 362,000). A combination of fortunate timing at 4:38 AM, and resilient house construction meant there were no casualties. A replica historic building of unreinforced earth in the area of maximum earthquake shaking suffered typical wall damage (Fig. 19.4). The end wall shows a diagonal in-plane tension crack, sliding near the base, and out-of-plane flexure cracks near the edges. A longer panel in the same wall line in the adjacent room collapsed during the aftershocks. A Mw 6.3 aftershock in the middle of the day in February 2011 that had much higher ground accelerations in the populated areas resulted in some building collapses and 185 fatalities. Damage surveys are discussed in section 19.4.5 including earth buildings that performed poorly and those that performed well. Observation of earthquake damage is very useful in identifying failure modes, and demonstrates the importance of understanding earthquakes.
19.2.2 The origin and location of seismic events
Plate tectonics
Errors are often made in interpreting earthquake damage in relation to earthquake magnitude. An introduction to the fundamentals of earthquakes assists in understanding factors that influence a local site response.
Seismic activity occurs because the thin crust of the earth is made up of a number of rigid tectonic plates that move relative to each other. Infrequent and difficult-to-predict ‘intraplate earthquakes’ occur within the tectonic plate away from the boundaries, they account for about 10% of the total seismic energy. The vast majority of earthquakes are generated at the boundaries of tectonic plates when the build-up of strain is suddenly released. Other geological features of volcanism and mountain building occur on plate boundaries, which is well demonstrated in the Pacific ‘ring of fire’ shown in Fig. 19.5.
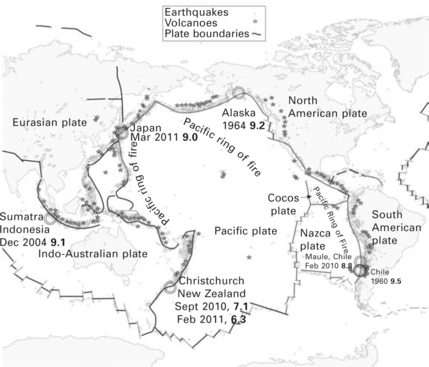
19.5 Tectonic plate boundaries showing major seismic events and volcanoes with the Pacific ring of fire clearly evident (based on USGS, 2008a). Some major or relevant earthquakes are noted with their magnitude.
The plate movement is due to the convection-type behaviour of the semi-molten interior of the earth and the sinking of the subducting crust. The main forms of plate movement and boundary interaction are shown in Fig. 19.6. The lithosphere moves differentially on the less viscous asthenosphere, which is in the upper mantle from a depth of about 50 km.
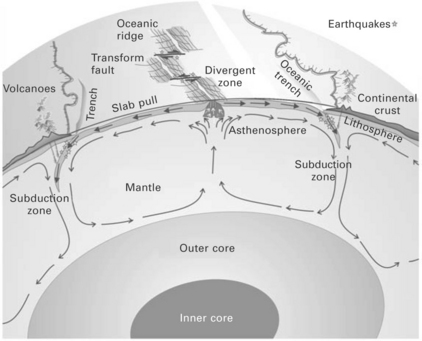
The major types of plate boundary interactions are:
• Divergent zones, such as the mid Atlantic ocean ridge, where new plate material is added from the interior of the earth
• Ssubduction zones are where plates converge and the dense underthrusting plate pushes beneath the continental plate and is reabsorbed as it sinks into the mantle. The vast majority and the strongest of all earthquakes occur in regions where tectonic plates meet and occur after a period of strain build-up. subduction causes the largest earthquakes, often near populated coasts such as on the Pacific rim (Fig. 19.5). This was the mechanism of the earthquakes, Mw 9.2, in Alaska 1964, and the great earthquake (Mw 9.1) that caused tsunamis in indonesia in December 2004 (off the coast of sumatra), Mw 9.0 of the earthquake in Tohoku, Japan in March 2011, the largest earthquake ever recorded in Chile in 1960 (Mw 9.5) and the Mw 8.8 earthquake in February 2010 near Maule, Chile mentioned earlier
• Transform plate boundaries are where plates move past each other horizontally; for example, the 1906 San Francisco earthquake on the San Andreas fault in California. Transform boundaries have the next most severe earthquakes when compared to subduction boundaries.
Earthquake faults
The focus of an earthquake is deep beneath the earth where the rocks under stress rupture at a specific point and the rupture rapidly propagates over a whole surface. This rupture surface forms a fault that is at a particular orientation to the surface of the earth. The types of faults are classified as strike slip faults, normal faults and reverse faults as shown in Fig. 19.7.
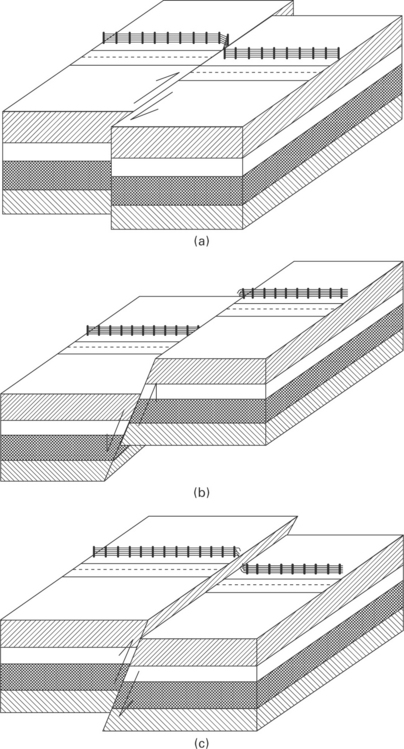
19.7 (a) Strike slip fault – horizontal movement along the fault direction; (b) normal fault – due to extension; (c) reverse fault, or thrust fault due to compression.
Depending on the depth of the rupture, its size and the overlying soils, faults may reach the surface and be expressed as a surface trace as illustrated in Figs 19.8 and 19.9 in Sept 2010 in Darfield, New Zealand.
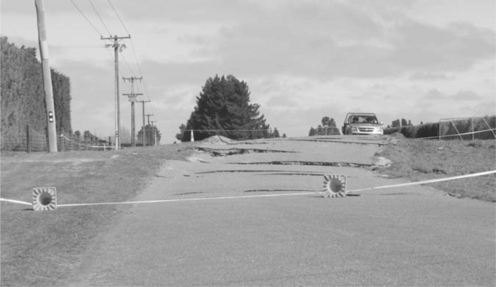
19.8 Earthquake fault trace displacements of about 1.5 m vertically and 4 m horizontally. Road previously straight and level, New Zealand 2010. (photo: M. Pender)
19.9 Horizontal strike slip trace with 4 m offset evident in fenceline in New Zealand 2010. (photo: M. Pender)
Known active faultlines are localised but are seldom a concern for houses. For large structures, design consideration is needed to avoid or span these significant movement zones.
19.2.3 Energy release, wave propagation and measurement
Deep and shallow earthquakes
Earthquakes occur when rock ruptures at the ‘focus’ or ‘hypocentre’, usually at a depth of 5 to 50 km depth but sometimes as deep as 600 km. The ‘epicentre’ is the surface location above the focus or hypocentre as shown in Fig. 19.10.
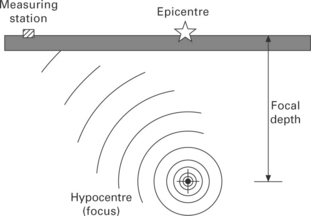
19.10 The epicentre is a point on the ground surface directly above the hypocentre. Seismic waves radiate in all directions, at a measuring station the arrival times for different seismic waves are used to establish the epicentre and focal depth.
In Fig. 19.6 earthquakes are shown occurring near the interface of the subducting plate at varying depths. Most damaging earthquakes occur at depths of less than 70 km where the travel path distance is moderate. Intermediate depth earthquakes at 70–300 km are less common but can be moderately damaging and are felt over a wide area. One such event was the earthquake in Bucharest in March 1997 (Mw 7.2) with a focal depth of 90 km (Dowrick, 2009). Deep earthquakes greater than 300 km are more uncommon.
Seismic waves
When the rock ruptures at depth the displacements propagate through the mantle and rock in all directions as a series of waves, similar to ripples from a stone dropped into a pond. These are primary waves (P-waves), which propagate the fastest in the same direction as the compression and dilation as shown in Fig. 19.11a, and secondary (shear) waves (S-waves), which move particles perpendicular to the direction of propagation (Fig. 19.11b).
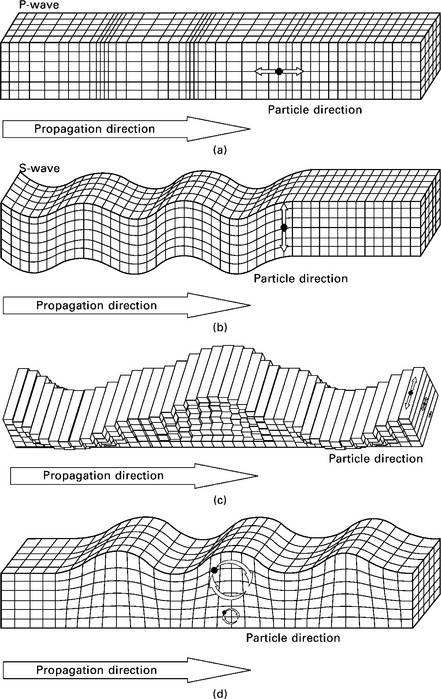
19.11 (a) P-waves – primary body waves that compress and dilate in the direction they propagate. A soil particle moves back and forth parallel to the direction of propagation. (b) S-waves – secondary shear body waves that move perpendicular to the direction of propagation. (c) Love waves – surface waves that have a similar motion to shear waves but travel along the surface and reduce with depth. (d) Rayleigh waves – surface waves that have a rolling motion that reduces with depth. A soil particle has an elliptical motion.
S-waves are shear waves that cannot propagate through fluids and travel at a slower speed (around 60% of P-waves). It is the difference in arrival time of these two types of body waves that is used to determine the distance from a measuring station to the epicentre. S-waves are usually the most damaging to structures.
Love waves, Fig. 19.11c, are surface waves that are similar in surface motion to shear waves but reduce in amplitude with depth. Surface waves follow the surface of the earth and therefore travel a larger distance and usually travel more slowly than shear waves and arrive after S-waves. Rayleigh waves as illustrated in Fig. 19.11d are also surface waves that are slightly slower than Love waves with a smaller amplitude motion that reduces with depth. Like ocean water waves, a particle below the surface will move in an elliptical motion, these waves can sometimes be seen on flat open ground or felt as a rolling motion. Surface waves attenuate more rapidly than body waves and are more significant close to the epicentre.
Earthquake magnitude
Magnitude is best known from the historic Richter Scale which gives local magnitude, M or ML, and is widely reported after earthquakes. It correlates with the amount of energy released at the hypocentre for medium-sized local events. (It is important to note that this scientific measure of magnitude may not relate to damage or felt intensity due to distance, depth and other factors.) The moment magnitude scale (Mw) is more recent than the Richter Scale and is directly related to the size of the rupture surface and length, and is a much more accurate measure of energy release for events greater than Mw 6.5. These scales of magnitude are logarithmic; the energy content increases by a factor of 32 with each complete integer on the scale as shown in Fig. 19.12.
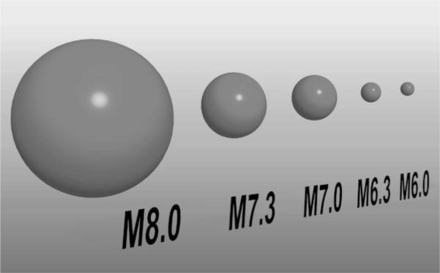
19.12 The relative size of earthquakes at the focus, a magnitude 7 event releases 32 times the energy of a magnitude 6 on the Richter scale or the moment magnitude scale.
One magnitude 8 earthquake releases around one million times the energy of a frequently felt magnitude 4 earthquake. In the last 20 years there has been an annual average worldwide of about 140 earthquakes of magnitude 6–6.9, 14 of magnitude 7–7.9 and one of magnitude 8 or greater.
Macroseismic intensity
Intensity is an expression of the extent and distribution of felt shaking intensity and damage reported as caused by an earthquake. It is related to ground velocities and accelerations and is of significant social and economic interest. The surface effects of an earthquake vary depending on the type of rupture, the distance to the epicentre, the focal depth and the geology. The scale most commonly used worldwide is the Modified Mercalli Intensity scale (MM), which has a comprehensive list of damage states but is given in a commonly abbreviated form in Table 19.3. In Europe the very similar European Macroseismic Scale (EMS-98) is used.
Table 19.3
The Modified Mercalli scale – short version (USGS, 2009)
| Intensity | Description |
| I | Not felt except by a very few under especially favourable conditions |
| II | Felt only by a few persons at rest, especially on upper floors of buildings. |
| III | Felt quite noticeably by persons indoors, especially on upper floors of buildings. Many people do not recognise it as an earthquake. Standing motor cars may rock slightly. Vibrations similar to the passing of a truck. Duration estimated. |
| IV | Felt indoors by many, outdoors by few during the day. At night, some awakened. Dishes, windows, doors disturbed; walls make cracking sound. Sensation like heavy truck striking building. Standing motor cars rocked noticeably |
| V | Felt by nearly everyone; many awakened. Some dishes, windows broken. Unstable objects overturned. Pendulum clocks may stop. |
| VI | Felt by all, many frightened. Some heavy furniture moved; a few instances of fallen plaster. Damage slight. |
| VII | Damage negligible in buildings of good design and construction; slight to moderate in well-built ordinary structures; considerable damage in poorly built or badly designed structures; some chimneys broken. |
| VIII | Damage slight in specially designed structures; considerable damage in ordinary substantial buildings with partial collapse. Damage great in poorly built structures. Fall of chimneys, factory stacks, columns, monuments, walls. Heavy furniture overturned. |
| IX | Damage considerable in specially designed structures; well-designed frame structures thrown out of plumb. Damage great in substantial buildings, with partial collapse. Buildings shifted off foundations. |
| X | Some well-built wooden structures destroyed; most masonry and frame structures destroyed with foundations. Rails bent. |
| XI | Few, if any (masonry) structures remain standing. Bridges destroyed. Rails bent greatly. |
| XII | Damage total. Lines of sight and level are distorted. Objects thrown into the air. |
Both the Modified Mercalli and European Macroseismic Scales use building damage as a measure of intensity. The EMS 98 Damage States are well illustrated for masonry (Fig. 19.13) (European Seismological Commission, 1998).
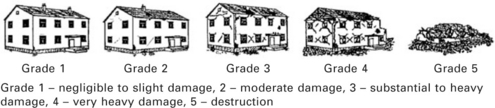
19.13 Damage states illustrated for two-storey masonry used in EMS-98 (European Seismological Commission, 1998).
19.2.4 Ground accelerations, velocities and displacements
Ground accelerations measure earth motions at a specific site and are fundamental in determining design load levels. Any point of the ground surface will follow a complex three-dimensional path with rapidly changing accelerations and displacements. In some locations the direction of the most severe shaking will be strongly in one direction, but no two events are the same and another earthquake is likely to be strongest in another direction. Strong motion seismographs record full acceleration records on accelerograms. From these the velocity and displacement are determined and response spectra are derived.
Seismic wave attenuation characteristics of the intervening mantle and rock are developed with attenuation equations that relate to distance from the source. In seismic regions these equations are used for a range of probable seismic events at locations along known active faults to predict maximum ground accelerations.
The overall statistical data of past events can be compared with the expected likelihood of possible events in order to generate hazard maps similar to that shown for mainland USA in Fig. 19.14. These maps are used as the basis for seismic zones in loading standards.
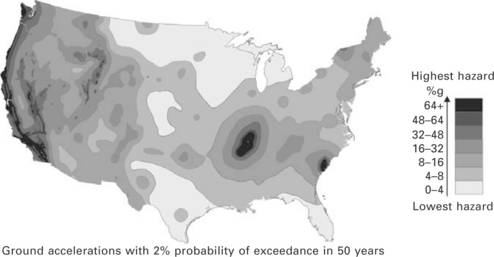
19.14 Hazard map showing probabilities of lateral ground accelerations for mainland USA (extracted from USGS, 2008a).
Local site effects
The way the rupture propagates within the fracture itself and the form of the fault will influence the earthquake characteristics including the seismic waves and their directional components. Exaggerated near-fault directional effects can occur at specific locations in relation to a large earthquake propagating for some distance along a fault. When a fault rupture progresses towards the site of interest there can be a cumulative effect as the seismic wavefronts superimpose or arrive in a compressed timeframe. Specific geological features may focus or disperse earthquake energy, and for very large or high-risk structures a site-specific hazard analysis should be undertaken by seismologists. A specific response prediction would take account of the range of possible earthquake sources and include a detailed site soil profile.
Near fault effects
The way the rupture propagates can result in significantly increased accelerations and deformations due to earthquake ‘fling’, and standards will have additional factors for sites very close to known faults.
The influence of soils
Ground accelerations are strongly modified by the soil conditions. Rock sites will have high frequency shaking, while on soft soil sites high frequencies (short period) will be reduced or filtered out, but low frequencies will be amplified. In the Mexico City earthquake of 1985, the deep soft soils of an old lake bed meant that tall buildings with long period motions were more severely damaged than many of the less engineered low-rise masonry structures.
Figure 19.15 shows the different site responses depending on soil type and depth.
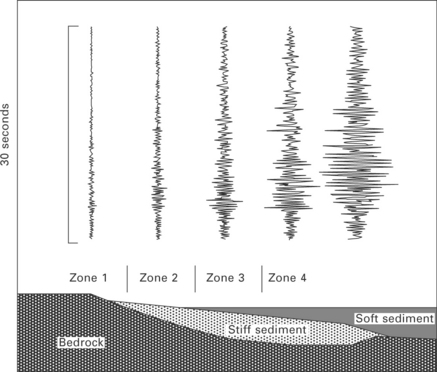
19.15 Earthquake response on sites with different soil depths (John Taber, Ansell and Taber, 1996).
19.3 Earthquake engineering
‘Earthquakes don’t kill people – buildings do’ – this decades-old adage is important to remember. Some people are killed by rockfalls and earthquake-initiated landslides, many are killed by tsunamis, but the bulk of casualties are due to failures of poorly designed and/or poorly constructed buildings. Over the last 50 years an average of over 15,000 people per year have died in earthquakes and the majority are in unreinforced stone, rubble, burnt brick or earth masonry dwellings.
Engineers, designers and builders of modern earth buildings in seismic zones need to design and construct high-quality structures that are well-engineered and set the benchmark for what needs to achieved worldwide.
19.3.1 Seismic response of buildings
Engineers are interested in the dynamic response of a structure to the strong ground motions at a particular site. This is usually dominated by lateral motion but vertical accelerations can occur and may significantly exceed 1 g. Vertical accelerations should be considered for structures that are vulnerable to increased vertical load and for unreinforced masonry that relies on gravity load to maintain lateral shear resistance. As a minimum a lateral strength reduction of 30% should be incorporated to account for the vertical accelerations in masonry walls that rely on gravity for shear and do not have full height vertical reinforcement.
Building response and resonant frequency
Structures have the largest dynamic response at their natural resonant frequency, or fundamental period. Like a pendulum gently moved backwards and forwards, buildings will respond with varying amplitude to changing input frequencies. The maximum displacement will be at its first mode fundamental period. For very tall and flexible buildings the fundamental period may be several seconds, for short stiff earth masonry buildings the period is likely to be 0.05 to 0.2 s.
Design earthquakes and design loading
Buildings standards use hazard maps to determine a zone factor (Z or similar) based on probabilistic hazard as illustrated earlier in Fig. 19.14. Earthquake characteristics are compiled into simplified design spectra that define equivalent accelerations related to building period as shown in Fig. 19.16. Soil characteristics are grouped into categories and define the amplification factors for rock through to deep soft soils and, in combination with the design spectra, determine a C factor. Acceptable levels of community risk for different types of building use are given a factor, R for example, based on the return period. The acceptable risk is much higher for a single family dwelling than for a hospital, which must be fully functional after a severe earthquake. The equivalent static design approach for low-rise and regular single-storey building uses simple lateral load coefficients, which will represent the inertial earthquake loads as a proportion of the equivalent gravity force acting sideways. This can be represented by a simple equation often of the form:
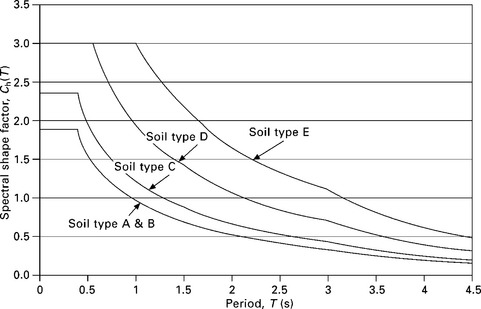
19.16 Typical design spectrum based on fundamental period for the building. (Standards New Zealand, 2004).
The lateral load that a building is designed to resist is strongly modified by the ductility of the structure. Buildings that can reach their maximum strength and then deform well beyond that level of deformation possess ductility, and that reduces the lateral demand. If a structure is able to move four times the equivalent yield deformation without losing strength, it has ductility of four. Earth buildings that are unreinforced, or have nominal reinforcement, will lose strength after first cracking, so should be designed for elastic response, a ductility of one. Walls reinforced within the fabric of the wall should maintain strength for modest deformations and have a limited ductility of around 1.25.
19.3.2 Load resisting systems for earth buildings
Inertial loading
Earthquakes rapidly move the structure by moving the ground under the foundations in all directions. These accelerations produce inertial loads within the structure that are directly related to the mass of each component of the structure.
Assuming structures are developed from a plan with straight walls, the loads may be conceptualised based on their orientation to the walls in two principal ways: ‘in-plane’ and ’out-of-plane’as shown in Fig. 19.17. If the accelerations are in-plane (parallel to the wall) then the structure tends to be stiff and diagonal tension cracks occur in wall panels, which then lose stiffness and strength. If the accelerations are out-of-plane (perpendicular to the wall) then the wall is more flexible and prone to collapse but is supported at the edges. The wall is supported at the sides (by the stiffer in-plane walls), at the base (by the foundations) and at the top (by a stiff bond-beam or heavy top plate with a ceiling or roof diaphragm).
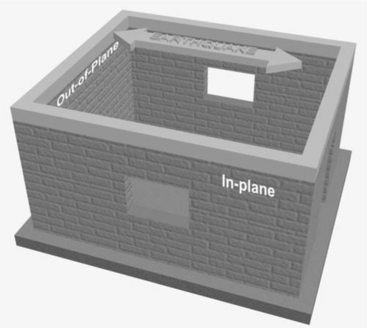
19.17 Earthquake loading nominally along one axis of a building showing in-plane loads and out-of-plane wall orientations.
After one direction of load has been evaluated the load direction perpendicular to that needs to be considered. The walls that were initially analysed as loaded out-of-plane are then loaded in-plane and vice versa.
Out-of-plane wall actions and an analytical approach
Adobe and other discrete block masonry walls are prone to fail when seismic loads act out-of-plane (perpendicular to the wall). This is the more flexible direction as illustrated in Fig. 19.17. Adobe bricks or blocks of bricks can be shaken out of the wall, and due to their size and weight can be life threatening. For these walls to perform well it is very important that single-storey walls are:
• restrained at the top by a diaphragm or bond beam
• well connected to the in-plane walls
• well tied together as a wall matrix using some form of reinforcement.
Adobe walls and cob walls benefit from being very thick and from the inherent dynamic stability of a good height to width ratio.
Out-of-plane performance of unreinforced earth and conventional masonry under seismic loads can be calculated based on empirical approaches and simplified models, although research is still ongoing into understanding and analytically modelling the failure mechanisms. This type of wall behaviour at high seismic loads is sensitive to the dynamic response of the system. Given the limits of analytical understanding, laboratory shake table tests are very useful in verifying conceptual understanding and observing failure modes.
A simple approach is to assume that the top support is inadequate and the face-loaded walls act as an elastic bending cantilever from the foundation as shown in Fig. 19.18a; or as a vertical span from foundation to a fully effective bond beam (or top plate restrained by a diaphragm with minor flexibility) as shown in Fig. 19.18b. This behaviour assumes only a vertical span, which applies to long walls and is a reasonable approximation for typical building configurations with large widths relative to height. The stress must also be in the elastic range with bond between layers fully effective. The elastic analysis is therefore only applicable at moderate lateral loads and the flexural tensile strength would indicate the initial crack strength and likely crack location.
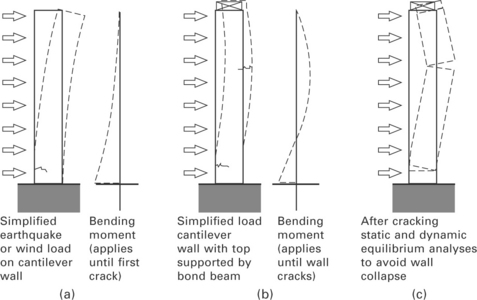
Once cracks extend into the wall matrix the wall behaves as discrete elements and the next simple check is to assume cracks are full depth and perform a simple force stability check for the load at which these elements collapse as shown in Fig. 19.18c. If the force was constant such as for strong wind then the wall collapse load can be determined.
Seismic loading is dynamic with many load reversals so the load will not continue in the same direction as equivalent, static loading would suggest. Elastic analysis is useful to avoid cracking of the wall at serviceability levels of earthquake, but for collapse of the wall panel elastic stress analysis no longer applies.
The collapse of a wall, considering only the vertical span direction, can be considered only to occur when the cracked sections of a wall move far enough that they become unstable. This mechanism was proposed for conventional unreinforced masonry by Priestley (1985), using an energy method of analysis, and was included in a draft document by the New Zealand Society for Earthquake Engineering (NZSEE, 1996) before being implemented in the New Zealand Earth Building Standards, as shown in Fig. 19.19 (Standards New Zealand, 1998a).
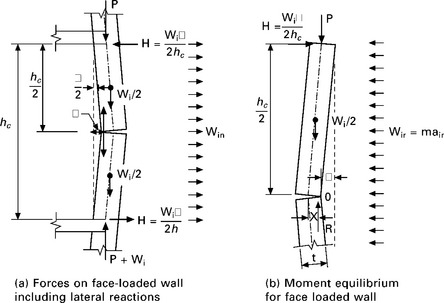
19.19 Out-of-plane analysis lateral reactions and moment equilibrium diagrams for unreinforced walls as outlined in NZS 4297 (Standards New Zealand, 1998a). P = load per unit length, W = self weight of wall section, h = height between restraints, R is the vertical reaction at the crack.
The vertical span assumption is conservative because the actual span is in two directions, as is evident from the out-of-plane crack patterns of failed walls. This assumption is even more conservative for short walls unless the supporting return wall connections have low stiffness or have failed
In Australia the static calculation methods incorporate both horizontal and vertical span considerations in the masonry standards (Standards Australia, 2001). This is nearer to the reality of how walls perform, but would need development to account for dynamic effects.
Out-of-plane failure modes
some typical out-of-plane failure modes for unreinforced adobe walls are shown in Fig. 19.20. In these cases cracks initiated in the horizontal span direction lead to major wall collapse, which highlights the need for top support along the wall and reinforcement at return wall connections.

In-plane loaded walls and load transfer
In-plane walls in unreinforced systems are stiff relative to out-of-plane walls so they carry the inertial load of their own mass plus the inertial load of any directly connected out-of-plane walls. It is strongly recommended that all buildings have bond beams or diaphragms to transfer roof and out-of-plane wall loads to the in-plane walls. Cantilever walls have higher vulnerability and require a low height-to-width (h/w) ratio and special reinforcement and foundation consideration.
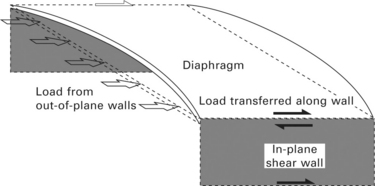
Top horizontal support can be provided to out-of-plane walls by a floor or ceiling diaphragm (see Fig. 19.21). A diaphragm is usually made from plywood or engineered timber sheeting in a single horizontal plane, or in a plane with a very low pitch slope. It must be well fastened to timber members that are substantially anchored into the fabric of each wall. The diaphragm needs to be designed with adequate strength to fully support the out-of-plane walls and with sufficient stiffness to avoid major mid-span deflections. Sheet joints in ply diaphragms need to be nailed at very close centres around the edge of each sheet (less than 150 mm) with specific design to transfer adequate load from sheet to sheet, and provide adequate stiffness.
Bond beams may be reinforced concrete or timber, and again need to be well anchored into the earth walls with plugs or dowels at close centres. Bond beams need to have adequate reinforcement and stiffness to restrain the out-of-plane walls as shown in Figure 19.22.
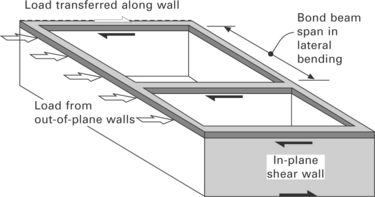
Where bond beams or diaphragms are present they transfer the load to the in-plane walls. As shown in Fig. 19.23, in-plane walls need to resist (i) the inertia force of the in-plane wall itself, (ii) the loads from any low strength or in-plane panels with openings, (iii) around 50% of the out-of-plane wall loads and (iv) the roof or upper floor inertia forces.
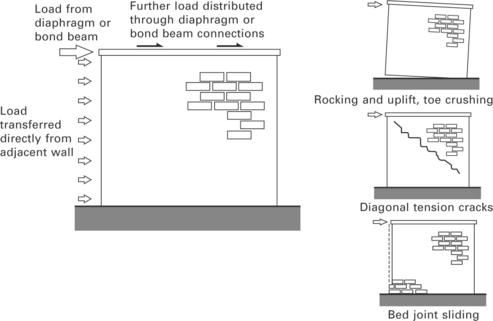
Three common failure modes for in-plane walls are: firstly overall wall panel rocking, which causes uplift at the heel and crushing at the toe if the compressive load exceeds the wall material compressive strength; secondly, the most frequently observed seismic damage of diagonal tension cracks (where compression along the diagonal induces perpendicular tensile stress); thirdly, for adobe or pressed earth brick type masonry, slipping can occur along the bed joint or near the bottom course.
Wall configuration for lateral load resistance
Regular form and well distributed walls are important for seismic performance of earth buildings (see Section 19.3.3). In the New Zealand Earth Building Standards (Standards New Zealand, 1998c) the approach for buildings not specifically designed by an engineer is to divide the building into nominal bracing lines in the two orthogonal directions. In Fig. 19.24 the effective mass and lateral load in each direction is determined and then the available resistance of the shear walls is totalled. There are limits to the spacing between bracing lines, and the offset of walls cannot exceed more than 1 m from the nominal bracing line.
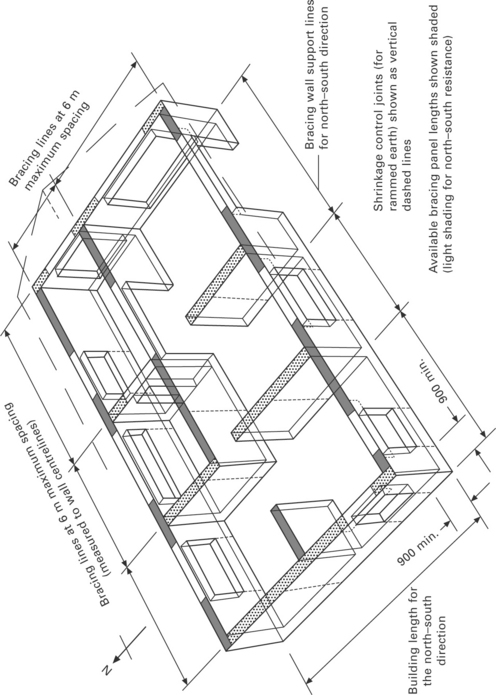
19.24 Bracing lines where both directions of loading are considered. Resisting walls are well distributed (Standards New Zealand, 1998c).
Reinforcement and detailing
In-plane walls need to be well anchored to transfer loads into the foundation and to prevent uplift. For adobe and block type construction vertical load due to self weight will keep the lower part of the wall compressed to maintain shear performance, particularly at the mortar joint interfaces. Full height vertical reinforcement will also maintain this axial load at elastic load levels and for modest further deformations. Horizontal reinforcing is needed in discrete masonry construction to prevent diagonal tension cracks at low loads, to provide stiffness and wall continuity once cracking starts, and to provide ductility, which will prevent sudden failure (see Fig. 19.25).
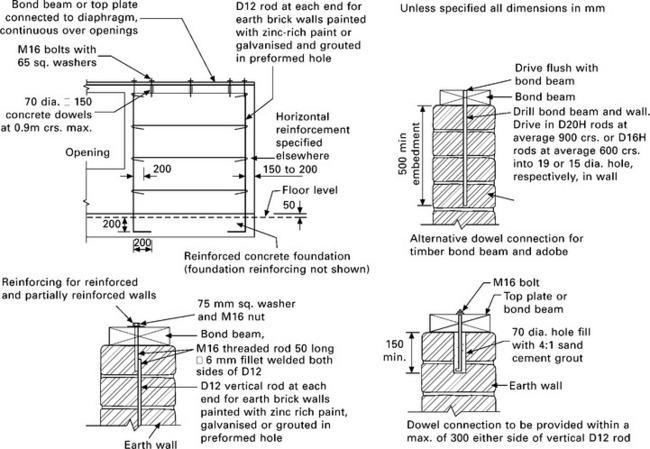
19.25 Details of wall reinforcing for seismic resistance from New Zealand standard NZS 4299 (Standards New Zealand, 1998c).
In the colder areas of North America, a proprietary cantilever wall system is in use. This system has two skins of rammed earth with the major benefit of an intermediate layer of insulation. This system increases the effective h/w ratio of the wall by providing full physical shear transfer across the insulation, and the top is well integrated with a beam and cross ties. Cantilever walls require large foundations to provide lateral stability and stiffness with reinforcement to provide lateral moment rotation strength.
Because adobe has a low bond strength to steel it has been New Zealand practice to use clipped steel reinforcing mesh for horizontal reinforcing. The steel longitudinals are used with the cross mesh at 150 mm centres cut midway to the adjacent longitudinal rod, the clipped cross pieces provide direct physical embedment in addition to bond. Polysynthetic geogrid horizontal reinforcement is now regularly used in the mortar bed as an alternative to steel. It has high tensile strength and is easily cut to width and has flexibility that allows it to mould well into the mortar.
19.3.3 Essentials for seismic survival
If earth buildings are constructed in earthquake regions, even if the risk is low to moderate, then seismic design principles must be applied with special attention to structural detailing.
Summary guidelines, explained in more detail below, are:
• Build single storey only or, if two storeys high, use a lightweight timber upper level
• Use a bond beam that is well reinforced to resist moment at intersections and has 135° hooks in shear ties, or use a roof or upper floor diaphragm with adequate strength and stiffness
• Use regular forms in plan that have a good aspect ratio
• Use walls with a low h/w (height to thickness) ratio
• Provide adequate wall lengths in each direction to provide adequate in-plane strength
• Limit the lengths of window and door openings
• Provide high-quality materials and maintain high-quality workmanship
• Use reinforcing to tie all the components of the building together
• Do not use thin single skin infill panels or thin cavity wall construction
Earth houses in seismic regions experience high inertial loading, because the walls are very heavy they pose a major risk at an upper level. If a second storey is needed, it should be constructed of lightweight materials that impose only a minor increase in capacity on the lower level.
Bond beams and diaphragms, described earlier, are essential in tying the walls together. The connections must be adequate to transfer the loads. The bond beam in Fig. 19.26 only had a friction connection to the walls. Dowel connections along its length would have made a far better connection and prevented major damage to this building.
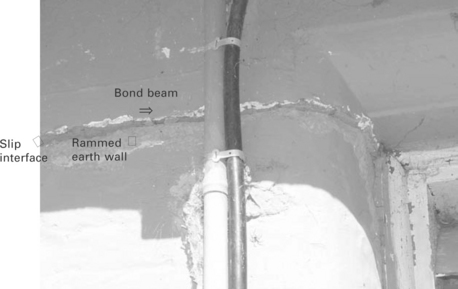
19.26 A reinforced concrete bond beam that has been poured onto the rough surface of a rammed earth wall but without positive connection. The earthquake has displaced the bond beam relative to the wall, near Darfield, New Zealand, 2010.
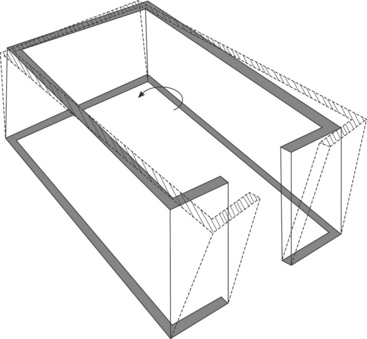
Buildings that are regular in shape perform most reliably during an earthquake. The simplest starting point for good seismic performance is a regular plan form without re-entrant corners (Dowrick, 2009). If the plan is eccentric, with the centre of mass offset from the centre of stiffness, then torsional vibrations will occur as shown in Fig. 19.27.
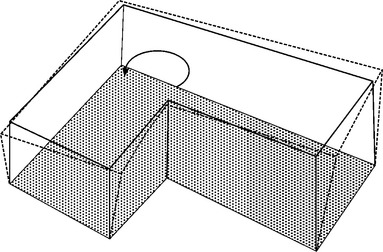
19.27 A building with an asymmetric plan, the centre of stiffness is not aligned with the centre of mass causing a torsional response. The re-entrant corner has to resist loads due to different performance in the two directions.
Buildings can be regular in plan but have asymmetric wall layout. This creates high demand on the more flexible walls (see Fig. 19.28). A series of good and poor plan forms are given in Fig. 19.29. Very long buildings can experience differential movement along their length and also lack cross walls. It is recommended to have seismic separation gaps that have specific allowance for differential movement between two buildings. In very low seismic risk areas if two-storey earth wall construction (not recommended) is used then structure regularity in elevation must also be used. A regular profile would have walls and openings in the lower storey predominantly aligned with openings in the upper storey. A lower storey with significantly larger and additional openings reduces the stiffness but must be avoided, even though it is likely to be architecturally desired.
19.28 A building with a symmetric plan form, but very different wall stiffnesses at opposite ends create eccentricity and place high demand on the near-end wall panels.

19.29 Plan forms of structures illustrating long unrestrained walls, building eccentricity and re-entrant wall effects. For low-rise buildings the eccentricity and re-entrant effects are best avoided but can be mitigated by high-quality reinforcement detailing.
Wall stability in low strength materials is significantly improved with wall thickness. Recommended maximum h/w ratios are 6 for cantilever walls and 10 for walls with top restraint. Where material tests have demonstrated a reliable tensile strength, this ratio could be reduced.
In elevation, regularity and good spacing between openings is another simple rule of thumb.
Materials and workmanship are described in other chapters. Seismic loading provides the greatest test for low strength masonry and will find the weakest link in a structural system.
Reinforcing needs to tie all the components together so the structure works as an integral whole. In New Zealand it is common to use vertical reinforcing within the wall that is continuous from the foundation to the top plate. This is very effective in giving integrity to wall panels. It prevents uplift and maintains the shear capacity of the wall. Horizontal reinforcing prevents the opening of diagonal tension cracks and provides corner continuity. Figure 19.30 illustrates vertical reinforcement that is full height in an adobe wall; horizontal geogrid reinforcement is laid into the mortar and anchored to avoid slip and to supplement reinforcing bond to prevent diagonal tension cracks. It provides a high-quality corner connection at every third course.
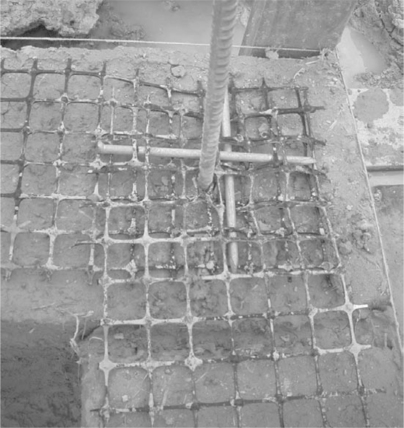
19.30 Horizontal geogrid reinforcement between courses in adobe. For effectiveness the ends of the reinforcement needs to be well anchored. (photo: Richard Walker)
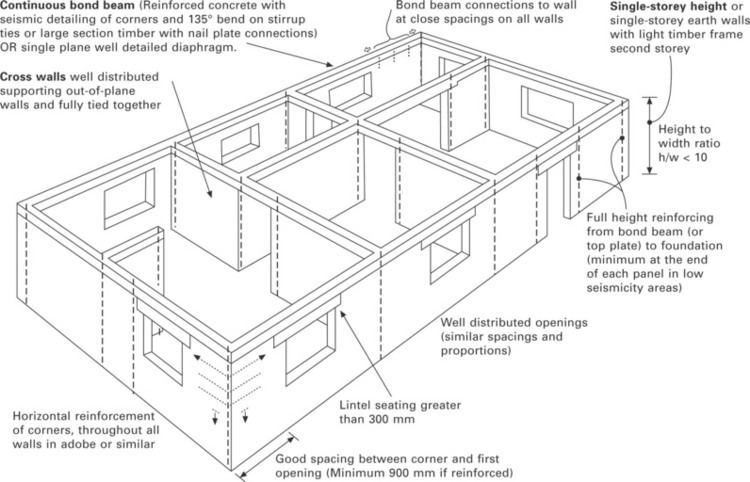
Figure 19.31 illustrates the behaviour of a poorly constructed unreinforced house. Figure 19.32 illustrates a number of the key features in a reinforced and well-constructed seismic resistant earth building in a moderate seismic area.
19.3.4 Secondary earthquake effects
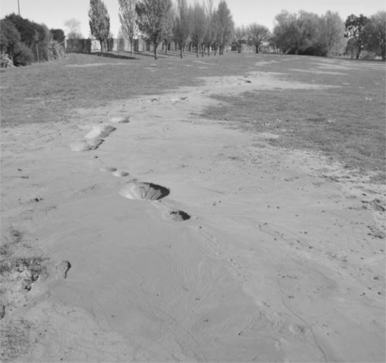
Earthquakes induce other secondary effects and one is ground deformation such as lateral spreading and liquefaction. Liquefaction occurs in course silts or sandy soils when the water table is high and the soils are not compact. As the soil is vibrated the particles move to a more compact arrangement and release the void water that builds pore pressure severely reducing bearing capacity and, as shown in Fig. 19.33, sometimes ejecting sand at the surface. Liquefaction can occur in lenses and caused major ground disruption when it occurred under inhabited slopes in Alaska in 1964 (Bolt, 2004; Booth and Key, 2006). on near-level sites, differential movement and lateral spreading can occur under a building (see Fig. 19.34).
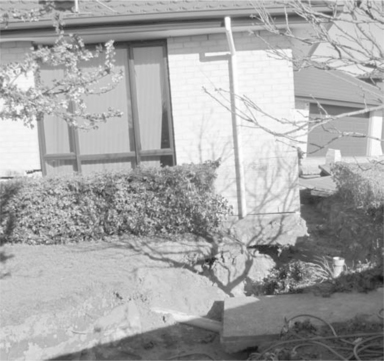
19.34 Major ground disruption around a house due to lateral spreading initiated by liquefaction. Not an earth house – timber frame with fired brick masonry veneer. (photo: M. Pender)
Earthquakes can also cause landslides and rockfall as covered in section 19.8.2, and can also cause tsunamis. The great Mw 9.3 earthquake of 2004 caused a devastating tsunami in sumatra and around the Indian ocean, and was followed by the deadly and economically devastating Mw 9.0 earthquake in Japan in 2011. Tsunami damage is caused by several mechanisms: firstly the surge impact, which could be three to six times the simple hydrostatic pressure for the depth of water. After the impact there is flow around the structure causing hydrodynamic drag and scour of the foundations, and there is the potential for major debris impact loads. Earth buildings, like most others, are unlikely to survive a direct wave impact so should be sited away from potential inundation and impact.
19.3.5 Earthquake reconnaissance surveys of building damage
Over many decades earthquake engineers have visited sites around the world immediately following major earthquakes. These studies make a major contribution to understanding of structural performance, and many are well documented (EERI, 2010b). Reconnaissance reports usually have excellent technical reviews of commercial structures, but seldom have detailed analysis of earth houses. The Earthquake Engineering research institute (EERI) methodology was modified by Tolles et al., when they surveyed historic adobe buildings damaged by the 1994 Northridge earthquake in California (Tolles et al.,1996), and was used for a survey in New Zealand (Morris et al., 2010) with the key categories listed in Table 19.4. When future earthquakes occur, modern earth buildings should be evaluated using a similar methodology.
Table 19.4
Standardised damage states used for the earth building reconnaissance surveys
| Damage state | EERI Description | Commentary on damage to historic and earth buildings |
| A None | No damage, but contents could be shifted. Only incidental hazard. | No damage or evidence of new cracking. |
| B Slight | Minor damage to non-structural elements. Building may be temporarily closed but could probably be reopened after minor clean up in less than 1 week. Only incidental hazard. | Pre-existing cracks have opened slightly. New hairline cracks may have begun to develop at the corners of doors and windows or at the intersection of perpendicular walls. |
| C Moderate | Primarily non-structural damage; there also could be minor but non-threatening structural damage. Building probably closed 2 to 12 weeks. | Cracking damage throughout the building. Cracks at the expected locations, and slippage between framing and walls. Offsets at cracks are small. None of the wall sections are unstable. |
| D Extensive | Extensive structural and non-structural damage. Long-term closure could be expected due either to amount of repair work or uncertainty on feasibility of repair. Localised, life threatening situations would be common. | Extensive crack damage throughout the building. Crack offsets are large in many areas. Cracked wall sections are unstable; vertical support for the floor and roof framing is hazardous. |
| E Complete | Complete collapse or damage that is not economically repairable. Life-threatening situations in every building of this category. | Very extensive damage. Collapse or partial collapse of much of the structure. Repair of the building requires reconstruction of many of the walls. |
(modified from Tolles ef al., 1996)
An example of a modern adobe house that performed well in the Mw 7.1 2010 Darfield earthquake in New Zealand is shown in Figure 19.35a, reinforced with continuous vertical reinforcing at each end of every wall panel and with a structural ceiling diaphragm. It was built in 1997 and was within 800 m of the fault trace shown in Figs 19.8 and 19.9. The house had a 0.5-mm crack through the reinforced concrete foundation and a 3-mm crack in the concrete floor due to differential ground movement. Damage in the area was consistent with Modified Mercalli intensity (MM) VIII, and an accelerometer 1 km away registered a vertical peak ground acceleration of 1.26 g and horizontal peak ground acceleration of 0.82 g. The damage to the adobe was minimal with several cracks and opened joints similar to that shown in Fig. 19.35b, and illustrates that the reinforcing and integrity of the structure was effective.
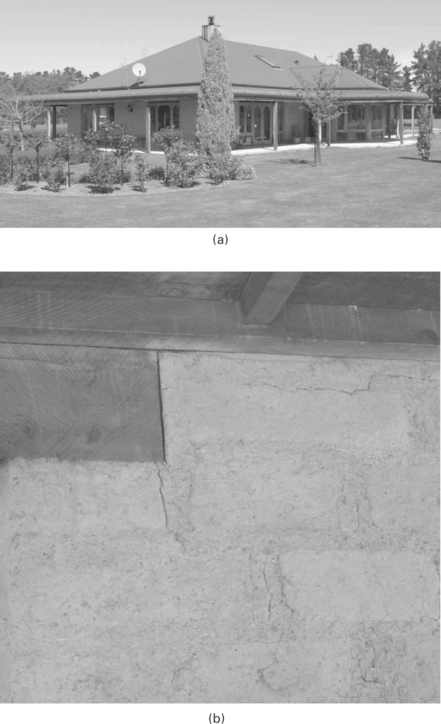
19.35 (a) Modern well reinforced adobe house, built 1997, very close to the fault trace of the Mw 7.1 Sept 2010 Darfield Earthquake in New Zealand. (b) Damage to a reinforced adobe house near Darfield New Zealand – opening of gap at the end of doorway lintel with minor cracks propagating along line of diagonal tension.
Another modern adobe house that performed well was at a site that experienced lower accelerations but was on liquefied soils (Figs 19.36a and 19.36b). Further earth buildings are discussed in the December 2010 NZSEE Bulletin, issue 34 for the Darfield earthquake (Morris et al., 2010). Preliminary assessment of the more severe February earthquake is outlined in another publication. (Morris et al., 2011) and highlighted the fact that untied double skin walls of stabilised earth were most unsatisfactory (Fig. 19.36c).
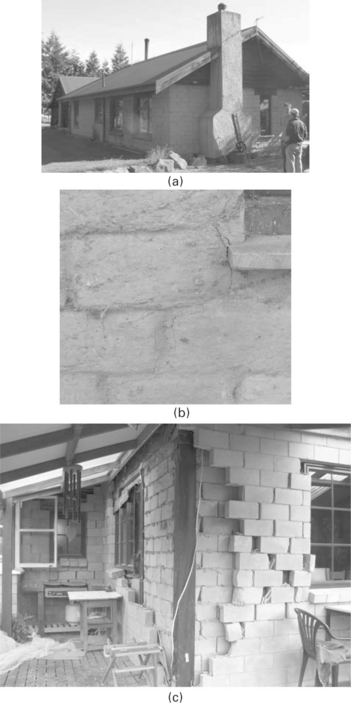
19.36 (a) Modern adobe house that suffered modest damage, including outward movement of the chimney, minor damaging ground movement due to ground liquefaction, during the Darfield earthquake in New Zealand. (b) Damage to reinforced adobe house – typical modest cracking observed around windows and openings. (c) Earthquake damage to both leaves of pressed stabilised earth infill walls of a post and beam house. Typical steel links between leaves were ineffective.
19.4 Wind and storms
Wind is a major source of damage to buildings in all areas except within 5° of the equator. Gales and tropical storms are major widespread climatic effects, and strong localised winds occur on mountain downslopes, with thunderstorm squalls, downbursts and tornadoes. Wind is particularly damaging for poorly constructed lightweight buildings, but needs to be considered for earth buildings. Wind loads on low roof pitches will create uplift, and roof tie-downs need to resist significant forces in areas that have high winds. Wind loading is the dominant design concern for lateral loads in non-seismic areas. In low to moderate seismic zones earthquake lateral loading will dominate unless ultimate limit state winds exceed 50 m/s for single-storey heavy masonry earth construction.
19.4.1 Global circulation
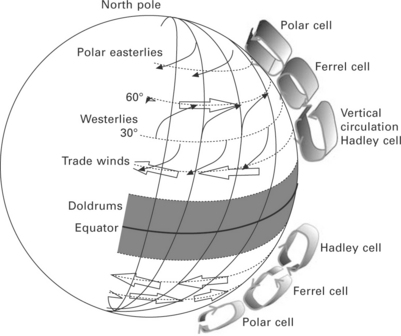
All wind is generated as part of a global pattern of circulation that moves air relative to the surface of the earth driven by the energy of the sun. Solar heating differs depending on the latitude, and the thermal differences between the equator and the poles create pressure differences, which drive convective circulation as illustrated in Fig. 19.37. The air movement is then subject to ‘coriolis accelerations’ due to the Earth’s rotation; these accelerations also vary with latitude and deviate the air movement in opposite directions in the two hemispheres. In the northern hemisphere a wind directed north along a meridian diverts to the right of the velocity vector (towards east) and becomes a westerly.
19.4.2 Pressure system winds
In the mid-latitudes between 40 and 60° the largest winds are gales generated by large deep depressions. These are generated by very large weather systems, which can extend over 1000 km or more. In Europe these can last for days, while peak wind gusts occur over a period of several hours.
19.4.3 Thunderstorms
Thunderstorms occur due to warm moist air rising into cumulus cloud towers as updraughts, moving from the storm flank into the storm core as shown in Fig. 19.38. These storms are initiated by cold fronts, troughs or regions of low pressure further enhanced by hills. Within the core the moist air condenses into rain or hail and falls within a downdraft that spreads as it approaches the ground. The cool wind surges outward along the gust front (Australian Government Weather Bureau, 2010).
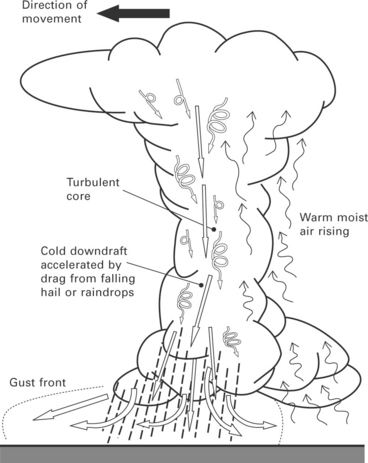
19.38 Mature thunderstorm with warm air rising primarily at the rear flank with cold downdrafts spreading as they interact with the ground to create strong gusty wind.
The most severe winds occur in spring and summer and are caused by the downward rush of air accelerated by rain and hail that spreads at the ground. In Australia a severe storm is defined as one that causes hailstones with a diameter of 2 cm or more, wind gusts of 90 km/h or greater, intense rainfall resulting in flash flooding or that generates tornadoes.
In temperate regions thunderstorms can be the cause of the maximum design level winds.
19.4.4 Tornadoes
Tornadoes develop out of severe thunderstorms when a rapidly rotating column of air extends from the updraft base of a cloud to the ground. Fully developed tornadoes have an interaction with the downdraft that focuses the updraft into a very tight rotating motion. Tornadoes are categorised on the Fujita scale: an F3 tornado has wind speeds in excess of 250 km/h, an F4 is in excess of 334 km/h and F5 in excess of 420 km/h. Tornadoes are localised and cause damage along a narrow path.
Major tornadoes occur in central USA where the cold Canadian air meets the warm Mexican flows. Wind loads increase proportionally to the square of the velocity so these are highly destructive extreme events. it is not cost-effective to design houses and medium importance structures to resist tornadoes, but in high-risk areas a place of refuge should be considered in the design.
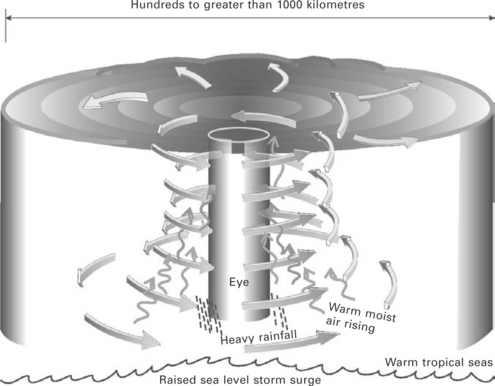
19.4.5 Tropical cyclones, typhoons and hurricanes
Tropical cyclones cause very severe winds driven by latent heat of the oceans, and develop in some parts of the tropics. Water temperatures must exceed 26 °C for the tropical storms to originate, and they follow tracks away from the equator between 10° and 30° latitude both north and south. The strongest tropical storms occur in the Caribbean and southern USA, where they are called hurricanes, in the south China sea around south east Asia, where they are called typhoons, and off the north west of Australia, where, because of clockwise rotation in the southern hemisphere, they are called tropical cyclones.
As shown in Fig. 19.39 these are the most severe large storm systems and are frequently hundreds of kilometres. They cause very high winds, high rainfall in diameter, and the very low pressures within the storm raise the sea level, which causes storm surges. Tropical cyclones, hurricanes and typhoons cause major damage when they make landfall, but the intensity attenuates once they are over land without the warm ocean providing the energy. The storm categories, wind speeds and typical damage are listed in Table 19.5.
Table 19.5
Classification of tropical cyclones (Australian Government Bureau of Meteorology, 2010)
| Category | Strongest gust (km/h) | Typical effects |
| 1 Tropical cyclone | Less than 125 km/h Gales | Minimal house damage. Damage to some crops, trees and caravans. Boats may drag moorings. |
| 2 Tropical cyclone | 125–164 km/h Destructive winds | Minor house damage. Significant damage to signs, trees and caravans. Heavy damage to some crops. Risk of power failure. Small boats may break moorings. |
| 3 Severe tropical cyclone. | 165–224 km/h Very destructive winds | Some roof and structural damage. Some caravans destroyed. Power failure likely. |
| 4 Severe tropical cyclone | 225–279 km/h Very destructive winds | Significant roofing and structural damage. Many caravans destroyed and blown away. Dangerous airborne debris. Widespread power failures. |
| 5 Severe tropical cyclone | More than 280 km/h Extremely destructive winds | Extremely dangerous with widespread destruction |
19.5 Earth building design for wind resistance
In each region maximum wind speeds for each particular direction are determined from meteorological data from each applicable type of wind event as outlined above. Design wind speeds are statistically determined and published in loadings standards with wind speed increasing as a function of height depending on the approach ground roughness. Factors are then applied to account for local topography such as ridges and valleys, shielding from other buildings, and the proportions and shape of the building.
For simple wind design the wind loading is treated as internal and external pressures, taking account of the wind direction and direction of any openings in the building. As shown in Fig. 19.40, wind along a building, parallel to the ridgeline, will cause pressure on the windward wall, negative pressure (suction) on the downwind end wall and negative pressure on the side walls. On the upwind roof there will be suction, and in long buildings with a d/h ratio greater than three a positive pressure can apply to the downwind part of the roof.
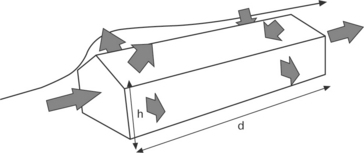
19.40 External wind pressures for wind along the ridgeline of a building. The windward end wall has positive pressure and all other exterior surfaces have suction. In long buildings the downwind roof can also have positive pressure.
As shown in Fig. 19.41a wind across the building, perpendicular to the ridge, will cause uplift on a low pitch building. Like an aerofoil the wind velocity increases as it crosses the building roof creating uplift. If there is a significant opening or broken window on the windward side of the building, a positive internal pressure will create upward force on the inside surface. Roof sheeting uplift or the uplift of large sections of a roof are the most common structural failures in wind storms.
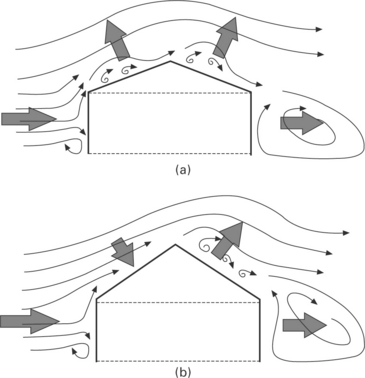
19.41 (a) Flow lines for wind across the building (perpendicular to the ridge line) and external pressure direction on a building with a low pitch roof. (b) Flow lines for wind across the building and external pressure direction on a building with a steep roof.
On roofs steeper than 20° there can be a negative or positive pressure on the upwind surface. For roof slopes of 45° or greater there will be a positive inward roof pressure on the upwind surface as shown in Fig. 19.41b.
19.5.1 Fastening of roof cladding
Roofs for all buildings need to be well fastened to avoid uplift. In tropical storm zones the fixings must cope with many cycles of loading without metal fatigue. Lightweight roofs with a timber roof structure cannot rely on direct nail pullout of standard nails. In high-risk areas, tiles are unsuitable and special load spreading connectors are nailed into the side of purlins or screwed to hold the steel sheet cladding.
19.5.2 Anchorage of roofs to walls
For earth wall buildings the tensile strength of the wall materials cannot be relied on for roof tie-down. The depth of anchorage into the wall must allow for the full wind uplift by anchoring deep enough into the wall that the self weight of the wall materials will resist the uplift. In high-strength stabilised earth with adequate tensile strength the bond anchorage strength will govern. Under the most severe New Zealand conditions this requires 1200 mm rods to be embedded at maximum 900 m centres as shown in Fig. 19.42. In tropical storm zones, anchoring rods should be full height from the roof to the foundation.
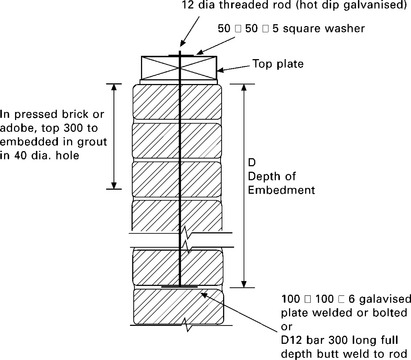
19.42 Wall anchorage to avoid roof uplift (Standards New Zealand, 1998c).
19.5.3 Out-of-plane wall strength
The important strength considerations are resisting wind for tall earth buildings, free-standing earth walls and buildings with walls made of lightweight earth materials. For low-rise heavy earth walls failure of the wall itself is unlikely unless there are long unrestrained spans. A similar methodology used for out-of-plane earthquakes can be applied for wind as well, after first cracking then stability criteria will determine whether the wall collapses in an extreme event. Ytrrup proposed a set of equations for wind based on this approach (Yttrup, 1985).
19.6 Flood hazards and earth buildings
some stabilised earth wall materials will survive inundation for days, but unstabilised walls are vulnerable to severe material degradation during flood inundation, erosion in flood waves, and extended periods of rain strike. These failures can be catastrophic and cause full wall collapses. This has serious economic and social impacts, but the structural failures have gradual onset and are not normally life threatening.
19.6.1 Causes of flooding
Temperate zone rainstorms, monsoon rains, extreme tides, tropical storm rainfalls and tropical storm surges can causes significant water level rises near rivers, streams, estuaries or along the coastal fringe. The history of these events needs to be considered in looking at potential construction sites while taking into account the changes in river catchments and any silting up or backwater effects due to downstream narrowing or obstructions. In marginal zones, consider if flood events may be worsened by climate change.
The most vulnerable areas for flooding due to rising water are flood plains, which traditionally form fertile areas and are often built on. Frequently urban development also spreads adjacent to rivers, streams and harbours. In rural areas past flood levels should be identified, in urban areas the hydrological records and flood risk assessments of local authorities should be checked to determine flood levels as illustrated in Fig. 19.43a.
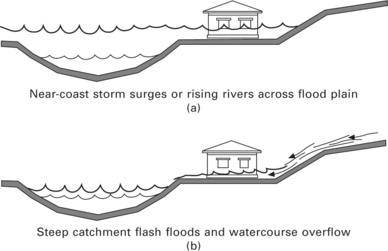
19.43 (a) Flooding due to rising rivers, and tidal surge. Mostly near streams, in the flood plains of rivers and near to the coast. (b) Flooding due to flash floods or overland flows due to high intensity rainfall.
Flash floods occur in steep catchments during intense short-duration rain storms and can reach a peak within minutes (see Fig. 19.43 b). These floods are more localised than typical large river flooding and occur very rapidly in creeks, drains and natural watercourses. Some topographical features focus thunderstorm activity into areas that are more prone to flash flooding.
The worst cases of overland flow are due to major rainfall into catchments above the building site and can be caused by overtopped drainage systems. Minor flooding due to inadequate watercourse size and poorly maintained drainage can also have very localised severe effects: all feasible drainage paths and overland flow paths need to be considered when investigating a potential construction site.
19.6.2 Design for flooding
The design for floods and earth buildings is to select and prepare a site to avoid being inundated by water. The site needs to be well above flood levels or, if it is marginal, then construct a building platform faced with resilient hardfill, rock or concrete well above the potential flood level as shown in Fig. 19.44.
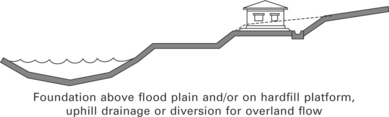
19.44 Good site selection and preparation to be above highest water levels and well drained to divert or retain likely overland flow.
Permanent drainage channels need to be well constructed for sites where there are small possible overland flows. When considering the environmental impact, a more sustainable source-control stormwater management option is to capture or slow such flows with stormwater retention ponds to reduce downstream flood peaks.
19.7 Volcanoes and landslides
19.7.1 Volcanoes
Volcanic eruptions can devastate wide areas suddenly with great intensity. The upward movement of magma prior to an eruption is often detected by seismic instrumentation, so warnings can be given prior to a volcanic event and minimise casualties. Around 500 million people live near volcanoes. Over 500 volcanoes are classed as being active, and between 50 and 65 of them erupt each year. Nagoya, Kyoto, Yokohama and Tokyo are all at risk in Japan. Vesuvius near Naples has tended to erupt every 30 years and is being constantly monitored. Eruptions also have major indirect effects on air traffic, crop failures and climate change (Munich Reinsurance, 2007).
The underlying mechanisms of volcano formation are related to the movement at the tectonic boundaries as described in Section 19.3.2. Buildings are vulnerable to a range of hazards as shown in Fig. 19.45. Lahars are liquid volcanic mud flows that concentrate in valleys and like pyroclastic flows can travel many kilometres with devastating force. Ash falls can apply significant roof loading on structures downwind of the plume tens to hundreds of kilometres away. The Etna eruption in 2002 caused over €800 million of ash damage.
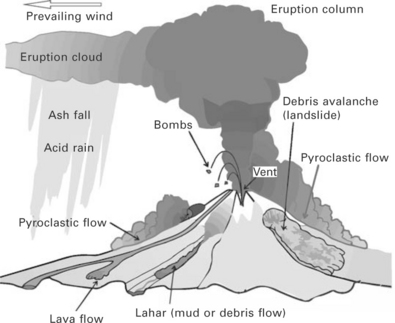
19.45 Various volcanic eruption effects (USGS 2008b).
For earth houses, rare volcanic events would not be a structural design consideration but, similar to flood hazard, the hazard should be considered and the site selected to minimise risk if it is near to a volcano that is defined as geologically active. In urban areas with high risk of volcanic activity there will be local authority maps of major volcanic hazards.
19.7.2 Landslides
Landslides and rockfalls mainly occur after heavy rain and also after earthquakes. Severe damage can be caused due to land sliding onto a structure. Earth houses are usually very heavy so special care is needed to avoid land subsiding or laterally spreading, especially after earthquakes. Sites at the base of slopes of soil or poor rock are most prone to landslide or pre-existing landslide sites (Fig. 19.46a). Other vulnerable sites are: in a drainage hollow; at the base or top of a fill slope, near a steep cut slope; or near a slope where there is a septic tank leach field.
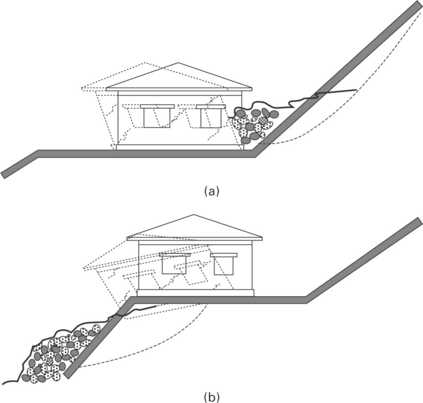
19.46 Landslide dropping or slumping earth or rock onto a house; (b) land slumping away beneath the foundations of a building.
Investigation should be carried out around the general area to detect warning signs: springs, seeps, or saturated ground; hummocky ground; cracks or unusual bulges in the ground, street pavements, kerbs or footpaths; sunken footpaths or street pavements; offset fence lines; or leaning telephone poles, trees, retaining walls or fences. If there are other houses nearby, then they should be investigated for tilting or cracking of concrete floors and foundations, or soil that has moved away from foundations for decks and patios that have tilted or moved relative to the main house. Expert geotechnical investigation should be undertaken for any sites where possible hazards are identified.
Sites that are typically considered safe from landslides are: stable, hard, non-jointed bedrock; flat or gently sloping areas away from sudden changes in slope angle; the top of a ridge set back from the edge of the slope (USGS, 2007).
19.8 Future trends
For modern earth buildings understanding earthquake performance still requires more advanced understanding, particularly to define reliable analytical procedures. The overall principles of seismic resistant configurations are understood with continuing research around the world investigating specific details of seismic performance (Tipler et al, 2010). This work is often undertaken in small research programmes with modest budgets.
Larger research programmes in burnt brick and concrete masonry will provide high quality research inputs into better understanding of seismic performance, particularly for out-of-plane walls. Some of this leading work is being undertaken at the University of Adelaide (Griffith et al, 2004) and at the University of Auckland (Dizhur et al., 2010; Derakhshan et al., 2012). Developments of assessment procedures for unreinforced masonry are continuing as the retrofit of such buildings requires an understanding of existing structural performance. The major economic drivers for economical retrofit of large numbers of building will provide in-depth research.
19.9 Sources of further information
Disaster Reduction – Living in Harmony with Nature by Kuriawa (2004) is a comprehensive volume that covers a wide range of disasters and includes social, economic and planning aspects of disaster reduction with an emphasis on South America.
Earthquakes by Bolt (2004) is the classic reference on the basics of seismology.
Earthquake Resistant Design and Risk Reduction by Dowrick (2009) provides in-depth discussion of earthquakes including economic impact, seismology and seismic design with many New Zealand examples.
Booth and Key (2006) wrote Earthquake Design and Practice for Buildings, which provides information aimed at designers and includes Europe.
Seismic Engineering (Betbeder-Matibet, 2008) is comprehensive with a theoretical emphasis and is focused on France.
Seismic Design for Architects – Outwitting the Quake (Charleson, 2008) gives a conceptual overview with extensive graphics that provides an easily understood introduction to seismic design for engineers and architects.
Wind sources, wind loads and design are well covered by Holmes (2007). The well-known earth building texts by Houben and Guillard (1994) and Minke (2009) have good sections that provide an overview of natural disasters and seismic resistance. Bruce King wrote a simple design approach (1996) and a chapter is also incorporated in The Rammed Earth House by Easton (1996).
Any serious engineering design will require familiarity with the seismic provisions of the local loadings standards such as Eurocode 8 in Europe (CEN, 2004) or NZS 1170.5 in New Zealand (Standards New Zealand, 2004).
The New Zealand Earth Building Standards (New Zealand Standards, 1998abc) are the most comprehensive available, and cover engineering design, materials and detailed requirements for non-engineered construction, and provide the detail necessary to build a house. The ASTM published a design guide in 2010 (ASTM International, 2010).
The US Geological Survey natural hazards website has an excellent overview of the various hazards and internally links to in-depth information on a full range of hazards. It is constantly updated with data on significant earthquakes worldwide. www.usgs.gov/natural_hazards/
The Earthquake Hazard Centre (2010) has a set of newsletters that provide general guidance on small-scale seismic-resistant construction and the Cyclone Testing Station (2009) in Australia has guidelines for house owners to prepare for major wind storms.
19.10 References
Ansell, R., Taber, J.J. Caught in the Crunch: Earthquakes and Volcanoes in New Zealand. Auckland: Harper Collins Publishers, 1996; 188.
Australian Government Weather Bureau. Severe thunderstorms in New South Wales and the Australian Capital Territory, 2010. www.bom.gov.au/nsw/sevwx/index.shtml [available from, [accessed November 2010]].
ASTM International. ASTME2392/E2392M – 10e1 Standard Guide for Design of Earthen Wall Building Systems. ASTM International: West Conshohocken PA; 2010.
Betbeder-Matibet, J. Seismic Engineering. London, ISTE: Hoboken, NJ, John Wiley & Sons; 2008.
Bolt, B. Earthquakes. New York: W H Freeman; 2004.
Booth, E.D., Key, D. Earthquake Design and Practice for Buildings, 2nd ed. London: Thomas Telford Publishing; 2006.
Charleson, A. Seismic Design for Architects: Outwitting the Quake. Amsterdam, Boston, London: Elsevier/Architectural Press; 2008.
CEN. Eurocode 8: design of structures for earthquake resistance. Brussels: European Committee for Standardization; 2004.
Cyclone Testing Station. Cyclones – is your house ready? A home owner’s guide, 2009. www.jcu.edu.au/cts/idc/groups/public/documents/other/jcuprd_053810.pdf [available from].
Derakhshan, H., Griffith, M.C., Ingham, J.M. Out-of-plane behaviour of oneway spanning URM walls. ASCE Journal of Engineering Mechanics. 2011. [(submitted May 2010, accepted Oct 2010)].
Dizhur, D., Derakhshan, H., Lumantarna, R., Ingham, J. Earthquake-damaged unreinforced masonry building tested in-situ. Journal of the Structural Engineering Society of New Zealand. 2010; 23(2):76–89.
Dowrick, D. Earthquake Resistant Design and Risk Reduction, 2nd ed. Chichester: John Wiley and Sons Ltd; 2009.
Earthquake Hazard Centre 10, 3, and many others available from. Earthquake Hazard Centre Newsletter. 2010. [accessed November 2010] www.victoria.ac.nz/architecture/centres/earthquake-hazard-centre.aspx
Easton, D. The Rammed Earth House. White River Junction, Vt: Chealsea Green Publishing; 2007.
EERI available from. The Mw 8.8 Chile earthquake of February 27, 2010. Earthquake Engineering Research Institute Newsletter, 2010. [accessed 11 November 2010] www.eeri.org/site/images/eeri_newsletter/2010_pdf/Chile10_insert.pdf
EERI available from:. Learning from earthquakes. Earthquake Engineering Research Institute, 2010 www.eeri.org/site/projects/learning-from-earthquakes [[accessed 5 December 2010]].
European Seismological Commission, EMS-98, European Macroseismic Scale, Volume 15 1998 available from. European Seismological Commission, Luxemburg, 1998. [accessed November 2010] www.gfz-potsdam.de/portal/gfz/Struktur/Departments/Department+2/sec26/projects/04_seismic_vulnerability_scales_risk/EMS-98/EMS-98_language_versions
Griffith, M.G., Lam, N.T.K., Wilson, J.L., Doherty, K. Experimental investigation of unreinforced brick masonry walls in flexure. Journal of Structural Engineering. 2004; 130(3):423–432.
Holmes, J.D. Wind Loading of Structures, 2nd ed. Abingdon: Taylor and Francis; 2007.
Houben, H., Guillard, H. Earth Construction: a Comprehensive Guide. London: Intermediate Technology Publications; 1994.
King, B. Buildings of Earth and Straw: Structural Design for Rammed Earth and Straw-bale Architecture. Sausalito, Cal: Ecological Design Press; 1996.
Kuroiwa, J. Disaster Reduction – Living in Harmony with Nature. Lima: Self published; 2004.
Minke, G. Building with Earth: Design and Technology of a Sustainable Architecture. Birkhäuser: Basel; 2009.
Morris, H.Mary H., Claudia C., Gail O., eds. New Zealand: aseismic performance-based standards, earth construction, research and opportunities. Proceedings of the Getty Seismic Adobe Project 2006 Colloquium, Los Angeles, 11–13 April 2006. 2009:52–66 available from www.getty.edu/conservation/publications/pdf_publications/gsap.pdf [[accessed November 2010]].
Morris, H.W., Walker, R., Drupsteen, T. Observations of the performance of earth buildings following the September 2010 Darfield earthquake. Bulletin of the New Zealand Society for Earthquake Engineering. 2010; 43(4):393–404.
Morris, H.W., Walker, R., Drupsteen, T. Observed effects of the 4th September 2010 Darfield earthquake on modern and historic earth buildings. Auckland: Pacific Conference on Earthquake Engineering, 2011; 14–16. [April 2011].
Munich Reinsurance Company, Schadenspiegel special feature issue risk factor of earth. Losses and Loss Prevention, 2007. [1, Munich Re].
Munich Reinsurance Company, NATHAN world map of natural hazards, 2011. (accessed October 2011) www.munichre.com/publications/302-05972_en.pdf
NZSEE. The Assessment and Improvement of the Structural Performance of Earthquake Risk Buildings. Wellington: New Zealand National Society for Earthquake Engineering; 1996.
Priestley, M.J.N. Seismic behaviour of unreinforced masonry walls. Bulletin of the New Zealand National Society for Earthquake Engineering. 1985; 18(2):191–206.
Standards Australia. AS 3700 Masonry Structures. Standards Australia: Sydney; 2001.
Standards New Zealand. NZS 4297, Engineering Design of Earth Buildings. Standards New Zealand: Wellington; 1998.
Standards New Zealand. NZS 4298, Materials and Workmanship for Earth Buildings. Standards New Zealand: Wellington; 1998.
Standards New Zealand. NZS 4299, Earth Buildings not Requiring Specific Design. Wellington: Standards New Zealand. Standards New Zealand has permitted the use of content from NZS 4297; 1998. [1998 and NZS 4299:1998 under license number 000835].
Standards New Zealand, NZS 1170.5:2004 Structural Design Actions Part 5Earthquake Actions New Zealand. Wellington: Standards New Zealand, 2004.
Tipler, J.F., Worth, M.L., Morris, H.W., Ma, Q.T. Shake table testing of scaled geogrid-reinforced adobe wall models. In: Proceedings of New Zealand Society of Earthquake Engineering Conference. Wellington: March 2010; 2010.
Tolles, E.L., Webster, F.A., Kimbro, E.E., Survey of damage to historic adobe buildings after the January 1994 Northridge earthquake. Getty Conservation institute. GCI Scientific Program Reports, Los Angeles, 1996. available from www.getty.edu/conservation/publications/pdf_publications/adobe_northridge.pdf [[accessed December 2010]].
UNEP, UNSDR, Global risk data platform available from. UNEP/GRID-Europe and UNSDR, 2011. [accessed October 2011] http://preview.grid.unep.ch/
United Nations International Strategy for Disaster Reduction. Disaster statistics 1991-2005, 2006. www.unisdr.org/disaster-statistics/occurrence-trends-century.htm [available from, [accessed November 2010]].
USGS, Landslide warning signs. US Geological Survey. 2007 http://landslides.usgs.gov/learning/prepare/ [available from, [accessed November 2010]].
USGS, 2008 United States national seismic hazard maps. US Geological Survey Fact Sheet 2008–3018, 2008:2.
USGS, What are volcanic hazards. US Geological Survey Fact Sheet 002–97. 2008 http://pubs.usgs.gov/fs/fs002–97/ [available from, [accessed November 2010]].
USGS, The Modified Mercalli Intensity Scale. United States Geological Survey. 2009 available from http://earthquake.usgs.gov/learn/topics/mercalli.php [[accessed 28 November 2010]].
USGS, Tarr, A.C., Villaseñor, A., Furlong, K.P., Rhea, S., Benz, H.M. Seismicity of the Earth 1900–2007. 2010 US Geological Survey Scientific Investigations Map 3064, 1 sheet, scale 1:25,000,000 available from http://pubs.usgs.gov/sim/3064/ [accessed November 2010]
Webster, F.A., Tolles, E.L. Earthquake damage to historic and older adobe buildings during the 1994 Northridge, California earthquake. 12th World Conference on Earthquake Engineering, paper no 0628, 2000.
Yttrup, P. Strength of earth masonry (adobe) walls subjected to lateral wind forces. Proceedings, 7th International Brick Masonry Conference, Melbourne, February, 1985.