
CHAPTER 9
Using Dynamic Blocks and Tables
In Chapter 7, “Combining Objects into Blocks,” you explored creating and using blocks to combine separate objects into a single, complex object to aid in selecting objects and editing properties. Chapter 8, “Controlling Text in a Drawing,” covered the addition of text into drawings. In this chapter, you will expand your knowledge of blocks and use text inside blocks and tables to display information about specific features of a drawing.
The blocks you've worked with have been static collections of objects that you have inserted throughout your drawing as doors or windows. Each instance of the same block was visually identical to the others, and you were able to scale the window blocks along one axis and without distortion to fit the walls. Blocks can also contain textual information, called attributes, which are specific to an individual block instance. Blocks do not have to remain static and unchanging. In this chapter, you will learn how to define your blocks so that they can change as required, without needing to explode the blocks and modify the component objects.
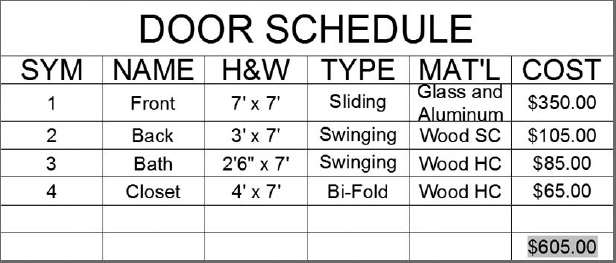
After exploring blocks further, you'll learn how to create a table to act as a door schedule, displaying the door type, unit price, and total cost. A schedule is a chart in a drawing that contains logically organized information about a particular component of a project, such as a steel baseplate, valve, bolt, screw, door, window, or room finish. Each of these components has its own schedule. Information in a door schedule, for example, might include size, material, finish, location, and type of jamb.
In this chapter, you will learn to
- Add block attributes, fields, and create dynamic blocks.
- Calculate areas, and extract data into tables.
- Create tables
Using Attributes for a Grid
In Chapter 8, you added a series of gridlines to your cabin. These gridlines were placed at the centerlines of structural components such as walls or columns. Especially in larger plans, these gridlines often provide critical points of reference for collaborating with contractors and other consultants over the phone. What makes the structural gridlines so useful is the way that they're labeled. Gridlines are most often labeled using a circle or hexagon with numbers running in one direction (horizontally or vertically) and letters running in the other. Because more-elaborate floor plans will likely have multiple closets, for instance, it's rather ambiguous to ask someone to look at the closet in a plan. Instead you might say, “Have a look at the closet near gridline intersection C2.”
Just as the gridlines help make your printed plans more useful, blocks can do the same inside your drawings by combining multiple related objects into a single entity in the Autodesk® AutoCAD® software. Because each grid needs to have a unique letter or number, creating a static block as you did in Chapter 7 won't work for this application. Instead, you need a block that can display a unique number or letter for each block insertion. You can achieve this level of interaction with any block by adding attributes to its definition.
A simple but handy use of attributes is to make the letter or number in the circle an attribute and then make a block out of the attribute and circle. By redoing the grid symbols in the cabin drawing, you'll learn how to set up attributes and create a new block that can be used in any other drawing. Because you'll define the block as an annotative block, the grid label blocks you create will not be scale dependent.
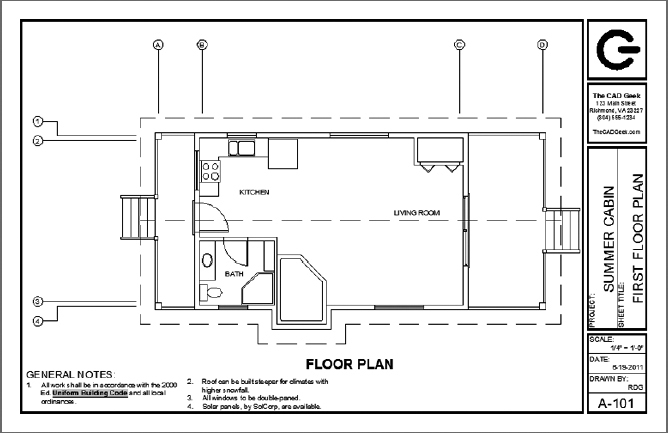
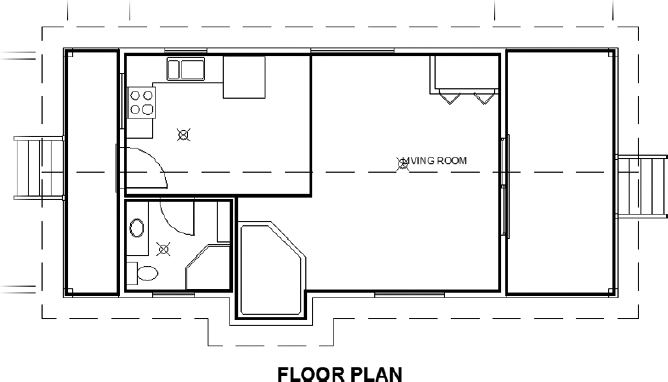
- Open I08-A-FPLAYO.dwg (M08-A-FPLAYO.dwg).
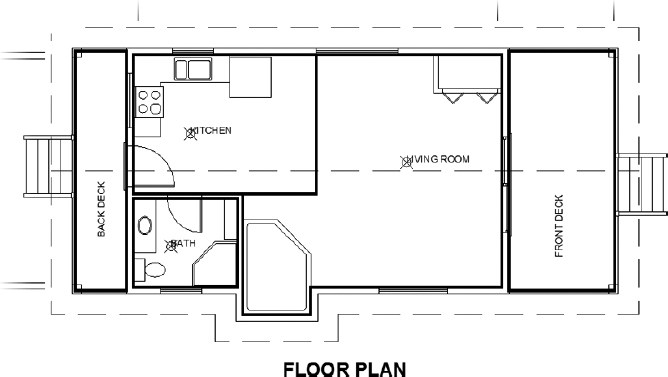
The drawing consists of the floor plan with a structural grid, notes, and a title block.
- Make sure that the A-GRID layer is current, and then freeze the A-ANNO-TTLB and A-ANNO-TTLB-TEXT layers.
 TIP You've already seen how the -LAYER command can be used to create new layers, but it can also be useful in layer management. Instead of freezing the two A-ANNO-TTLB layers individually, try entering -LAYER
 F *TTLB*. This command sequence tells AutoCAD to freeze all TTLB layers at once. The asterisk (*) is a wildcard character that tells AutoCAD to look for any layers with TTLB in their names—and, in this case, freeze them.
 - Zoom in to the floor plan, keeping the grid visible.
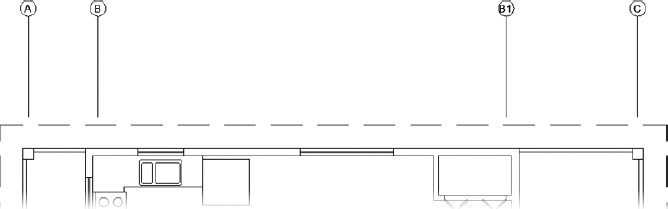
In this case, the letters run horizontally across the top, and the numbers run vertically along the side.
- Erase all the circles, letters, and numbers in the grid except for A and 1. Leave the gridlines intact (see Figure 9.1).
FIGURE 9.1 The floor plan of I08-A-FPLAYO (MO8-A-FPLAYO) with all but two grid symbols erased
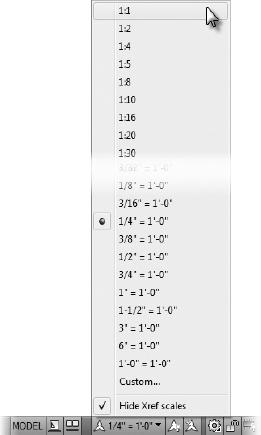
 Turn off the Automatically Add Annotative Scales mode from the status bar (the icon dims, and the lightbulb turns gray).
- Change your current annotation scale to 1:1, as shown in Figure 9.2.
 Start the SCALE command.
- Select the top-left circle and press .
- At the Specify base point: prompt, use the Endpoint osnap and pick the endpoint of the gridline where it meets the circle.
- Enter 1/48 (1/50).
This reduces the circle to its actual plot height.
- Repeat steps 7–10 for the circle on the left side.
 Start the ATTDEF command by clicking the Define Attributes button on the Insert tab
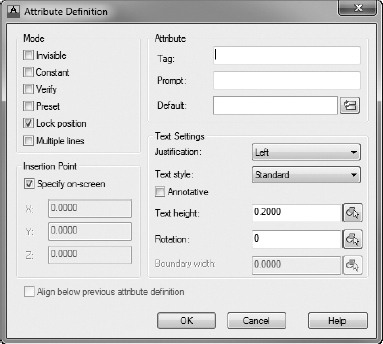
  Block Definition panel. The Attribute Definition dialog box opens (see Figure 9.3).
In the Attribute group are three text boxes: Tag, Prompt, and Default. The cursor is flashing in the Tag text box. Think of the letter in the grid circle. It's a grid letter, which is a tag that provides the visual textual information.
- Enter GRID-LETTER. Don't press .
- Press the Tab key to move to the Prompt text box.
Here you enter a prompt that will display for a future user. When a user inserts a block containing the attribute, the prompt will ask the user to input text for the tag.
- Type Enter grid letter, again without pressing .
- Press Tab to move to the Default text box.
Here you enter a default or sample value that will be used if the future user presses
instead of entering a new value. You want the letter capitalized in this case, so enter A.This sets up the attribute so that the user setting up the grid will be prompted to enter the grid letter and will be given a default of A. The capital A lets the user know that the letter should be uppercase.
The lower portion of the dialog box is where you set up parameters for the attribute text: location in the drawing, justification, text style, height, and rotation.
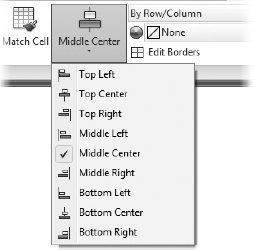
- Click the Justification drop-down list, and select Middle Center.
- Choose A-Label in the Text Style list box.
Because the A-Label text style is annotative, the Annotative check box is automatically selected. Likewise, because a text height other than 0′-0″ (0) is associated with the A-Label text style, the Text Height text box is grayed out.
- Make sure that the only check box selected in the Mode group is Lock Position.
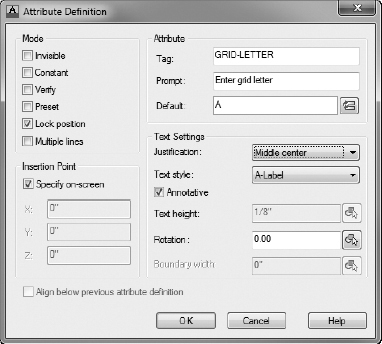
The Attribute Definition dialog box should look like Figure 9.4.
FIGURE 9.4 The Attribute Definition dialog box showing the appropriate values
- Click OK. Doing so returns you to the drawing to pick an insertion point.
- Back in the drawing, use the Center osnap and click the circle at the top of the grid.
GRID-LETTER is centered over the circle (see Figure 9.5), and the ATTDEF command ends.
FIGURE 9.5 The first attribute definition placed in the grid circle


The text over the circle is called the attribute definition. Its function in AutoCAD is similar to that of a block definition. When you made the A-GLAZ block for the windows, the definition was a 12″ (305 mm) long window with an insertion point. When the A-GLAZ block is inserted, you can use the original block definition to make windows of various sizes. The same is true for the attribute definition. When it becomes part of a block that's inserted, the attribute can be any letter you want. You'll see that happen in a minute. First make a similar attribute definition for the numbered grid symbol:
- Click the Define Attributes button again, or enter ATT to start the Attribute Definition command. The Attribute Definition dialog box opens again.
- Repeat steps 7 to 20 from the preceding exercise, using the following guidelines:
- Enter GRID-NUMBER in the Tag text box.
- Type Enter grid number in the Prompt text box.
- Enter 1 in the Default text box.
- Select Middle Center from the Justification drop-down list.
- Click OK, use the Center osnap, and click the grid circle on the left.
The second attribute definition is centered over the circle (see Figure 9.6).
FIGURE 9.6 The second attribute definition is placed.
- Save your drawing as I09-01-DefineAttribute.dwg (M09-01-DefineAttribute.dwg).

You now have two attribute definitions, and you are ready to make each of them part of a block that includes the circle over which they're currently centered.
Defining Blocks with Attributes
You have to define two blocks for the grid symbols and their attributes. The insertion point for the block used for the top of the grid should be at the lowest point of the circle. The insertion point for the block used for the left side should be at the point on the circle farthest to the right. Follow these steps:
- Make sure I09-01-DefineAttribute.dwg (M09-01-DefineAttribute.dwg) is open.
- Click the Create Block button on the Block Definition panel to start the BLOCK command, and open the Block Definition dialog box.
- In the Name drop-down list, choose GRID-V (for vertical) and then click the Pick Point button in the Base Point group.
- In the drawing, use the Endpoint osnap and select the gridline that ends at the circle on top.
- In the Block Definition dialog box that reopens, click the Select Objects button in the Objects group.
- In the drawing, select the circle and attribute definition on the top. Press .
The Block Definition dialog box reopens.
- Click the Annotative check box in the Behavior group.
- Be sure the Delete button is selected in the Objects group.
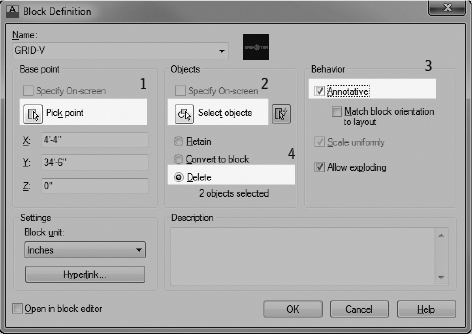
- Verify that the Block Definition dialog box looks like Figure 9.7, and click OK.
FIGURE 9.7 The Block Definition dialog box for the GRID-V attribute block
The block is defined, and it includes the attribute definition. In the drawing, the top circle and attribute definition have been deleted.
- Click the Create button again.
- Repeat steps 2 through 8 to define a second block for the circle and attribute definition on the left side. Use the following guidelines:
- Choose GRID-H from the Name drop-down list.
- Click Pick Point. Use the Endpoint osnap, and pick the horizontal gridline that ends at the rightmost point of the grid circle on the left of the floor plan.
- When selecting objects, select the circle on the left and its attribute definition.
When you complete the command, you have a second block definition that includes an attribute definition and no grid circles in the drawing.
- Save your drawing as I09-02-BlockDefinition.dwg (M09-02-BlockDefinition.dwg).
Inserting Blocks with Attributes
Let's insert these blocks (which are now grid symbols) at the endpoints of the grid-lines. As you insert them, you'll assign them the appropriate letter or number, but first you'll make sure that AutoCAD uses a dialog box to prompt for the user input:
- Make sure I09-02-BlockDefinition.dwg (M09-02-BlockDefinition.dwg) is open.
- From the status bar, change the annotation scale to ¼″ =1′-0″.
- Be sure that the Endpoint osnap is running, and then enter ATTDIA.
- If the value in the angle brackets is set to 0, press . Otherwise, enter 0.
 Click the Insert button in the Block panel or enter I .
The ATTDIA variable defines whether the INSERT command opens a dialog box or prompts the user at the command prompt for attribute information. When the variable is set to 0, no dialog box is used.
- In the Insert dialog box, open the Name drop-down list and select GRID-V.
- Be sure the Specify On-Screen box is checked for Insertion Point but not for Scale and Rotation, so that those values remain constant among the blocks and you're not prompted to change them. Click OK.
- Click the leftmost vertical gridline in the drawing.
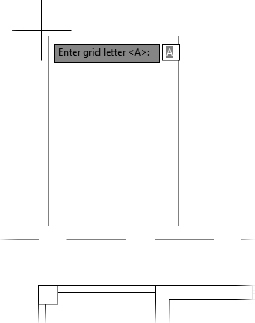
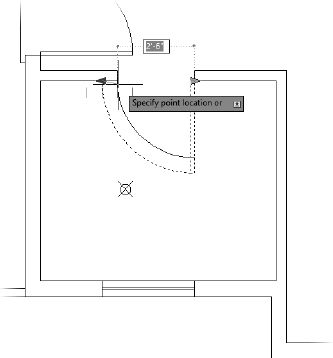
Now look at the bottom line in the command line or the command prompt at the cursor, as shown in Figure 9.8. This is the text you entered in the Attribute Definition dialog box for the prompt. A is the text you entered as the default value. The last line also appears at the command prompt attached to the cursor.
FIGURE 9.8 The command prompt shows the values for the Prompt and Default options specified.
- To accept the default value for this gridline, press .
Pressing
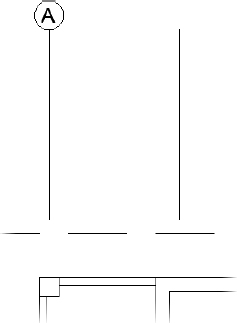
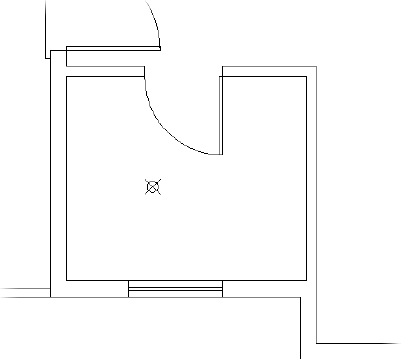
inserts the grid symbol at the endpoint of the leftmost vertical gridline (see Figure 9.9). - Press to restart the INSERT command.
- Click OK to accept GRID-V as the current block to be inserted.
- Click the gridline to the right of the one you just selected.
- At the Enter grid letter <A>: prompt, enter B.
The second grid symbol is inserted on a gridline, and the letter B is located in the circle. Be sure to use a capital B here; the tag will not prevent you from using a lowercase letter, but drawing standards require consistency.
Although you defined the GRID-V block at a much smaller scale, notice how it inserts at the correct scale. Just as text does, an annotative block sizes itself based on the current annotation scale when you insert it.
FIGURE 9.9 The first grid symbol block is inserted.
- Repeat steps 11 through 13 to insert the other two grid symbols across the top of the floor plan, incrementing the values for each.
- Continue repeating steps 11 through 13, but select the GRID-H block for the four grid symbols that run down the left side of the floor plan. The result should look like Figure 9.10.
- Save your drawing as I09-03-InsertAttribute.dwg (M09-03-InsertAttribute.dwg).
Editing Attribute Text
To illustrate how you can edit attribute text, let's assume that you decide to change the C grid symbol to B1. You must then change the D symbol to C. Here are the steps:
- Make sure I09-03-InsertAttribute.dwg (M09-03-InsertAttribute.dwg) is open.
- Double-click the C grid symbol.
FIGURE 9.10 The grid with all symbols inserted
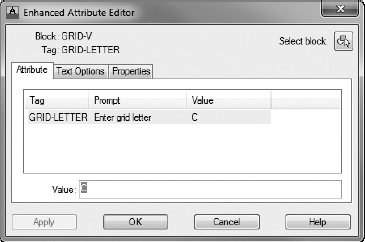
Doing so opens the Enhanced Attribute Editor dialog box shown in Figure 9.11. You can change several items here, but you want to change only the Value parameter.
FIGURE 9.11 The Enhanced Attribute Editor dialog box
- Be sure the Attribute tab is selected. Highlight C in the Value text box, enter B1, and then click the Apply button.
B1 replaces C in the larger window where the tag, prompt, and value appear together.
- Click OK to close the dialog box.
 NOTE Because you set the justification point for the attribute text to Middle Center and located the text at the center of the grid circle, the B1 text is centered in the circle, just like the single letters.
 - Double-click the D grid symbol.
- In the Enhanced Attribute Editor dialog box, repeat step 3 to change D to C. The attributes are updated (see Figure 9.12).
FIGURE 9.12 The grid symbols after being updated
- Save your drawing as I09-04-EditAttributes.dwg (M09-04-EditAttributes.dwg).
The exercises in this chapter so far have illustrated the basic procedures for defining, inserting, and changing attributes. You can apply these same procedures to the process of setting up a title block in which attributes are used for text that changes from one sheet to the next. You can now move to a more complex application of the attribute feature to see its full power.
Setting Up Multiple Attributes in a Block
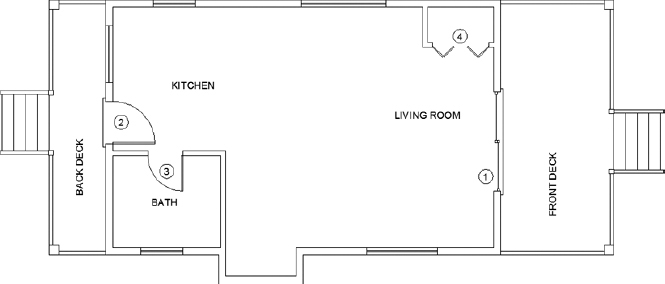
The cabin has three rooms and two decks, with the kitchen and living room sharing the same space. Each room has a different area and floor covering. You can store this information, along with the room name, in the drawing as attributes. You'll set up a block that consists of three attributes (name, area, and covering). You'll then insert the block back into the floor plan. As you may remember, the text style for the room labels is A-Label. You'll use that for the attributes.
You have to erase the room labels for now, but it will be handy to mark their justification points. That way, you can insert the attribute exactly where the label text is now. Follow these steps:
- Make sure I09-04-EditAttributes.dwg (M09-04-EditAttributes.dwg) is open.
 Thaw the A-ANNO-TTLB-TEXT layer.
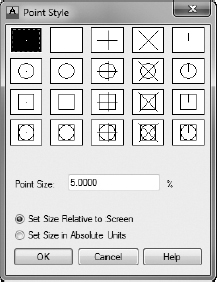
- With layer 0 current, from the menu bar, expand the Utilities panel on the Home tab and choose Point Style, or enter DDPTYPE to open the Point Style dialog box (see Figure 9.13).
FIGURE 9.13 The Point Style dialog box
NOTE A point is a single location in space, defined by an X, Y, and Z position, with no area or volume. The Point Style dialog box determines how the marker at the point location appears. By default, the point appears as a single pixel, which can be visually lost in the drawing.  Click the fourth point style example in the second row (the one with a circle and an X). Then click OK to close the dialog box.
 Set the Insertion osnap to be running, and then click the Multiple Points button on the expanded Draw panel on the Home tab to start the POINT command.
- Place the cursor on the LIVING ROOM text.
- When the Insertion symbol appears at the lower-left corner, click to place the point object. Don't end the command yet.
- Repeat step 6 for the KITCHEN and BATH labels.
The decks don't have any associated text in this drawing, so you can place the attribute anywhere you want.
- Press Esc to end the POINT command.
- Erase the LIVING ROOM, KITCHEN, and BATH labels.
The drawing should look like Figure 9.14.
FIGURE 9.14 The floor plan with markers for insertion points and three room labels erased
- Change the current annotation scale to 1:1 from the status bar.
- Make layer 0 current.
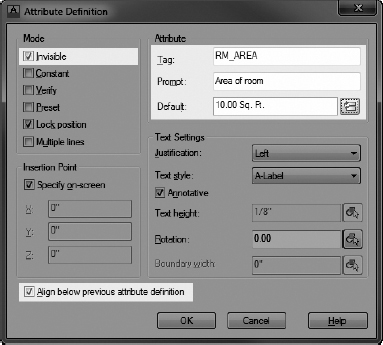
- Click the Define Attributes button on the Insert tab Block Definition panel to open the Attribute Definition dialog box.
- Enter the following:
- In the bottom half of the dialog box, the settings for the text stay the same. Click OK.
- In the drawing, click above the cabin and between the B and B1 gridlines. This places the first attribute definition in the drawing (see Figure 9.15).
FIGURE 9.15 The room name attribute definition placed in the drawing
Because you're going to make a block out of it and reinsert it into the rooms, you don't have to place the attribute definition where the room labels are positioned; any open area in the drawing is fine.
TIP Because you're drawing at a scale of 1:1, the attribute definition will be very small in relation to the rest of your drawing. Instead of using Zoom Window, try selecting the attribute definition and then choosing the Zoom Object option from the navigation bar. This will zoom in on the selected attribute definition. - Press to restart the ATTDEF command. For this attribute, enter the following:
- In the Mode group, click to activate Invisible.
The Invisible mode makes the attribute values invisible in the drawing, but they're still stored there and can be accessed when required.
- In the lower-left corner of the dialog box, click the Align Below Previous Attribute Definition check box.
All the text options fade out (see Figure 9.16). The style is the same as that of the first attribute, and this attribute definition will appear right below the first one.
FIGURE 9.16 Setting the proper values in the Attribute Definition dialog box
- Click OK. The second attribute definition appears in the drawing below the first one.
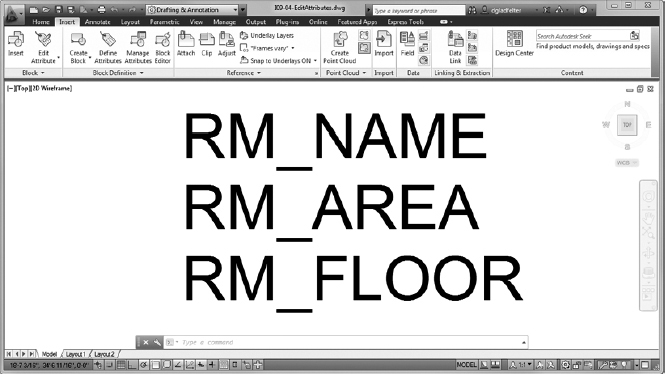
- Repeat steps 17 to 19 to define the third attribute:
- For Tag, enter RM_FLOOR.
- For Prompt, enter Floor Material.
- For Default, enter Wood Parquet.
- Click OK. All three attribute definitions are now in the drawing (see Figure 9.17).
FIGURE 9.17 The floor plan with all three attribute definitions
- Save your drawing as I09-05-MultipleAttributes.dwg (M09-05-MultipleAttributes.dwg).
Now you'll make a block out of the three attributes.
Defining a Block with Multiple Attributes
A block with attributes usually includes lines or other geometric objects along with the attribute definitions, but it doesn't have to do so. In this case, the three attribute definitions are the sole content of the block, and the block's insertion point is the justification point for the first attribute: the room label text. Follow these steps to define the block:
- Make sure I09-05-MultipleAttributes.dwg (M09-05-MultipleAttributes.dwg) is open.
- Click the Create button found on the Insert tab Block Definition panel to start the BLOCK command.
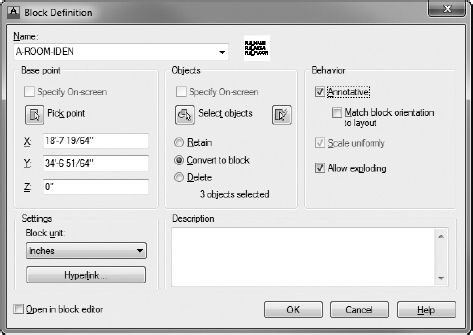
- In the Block Definition dialog box, enter A-ROOM-IDEN for the name.
- Click the Pick Point button.
- In the drawing, use the Insert osnap and choose the top attribute definition.
Doing so aligns the justification point of this attribute with the insertion point of the block.
- Back in the Block Definition dialog box, click the Select Objects button.
- In the drawing, pick each attribute definition individually in the order you created them.
Selecting them in this order causes them to be listed in the Enter Attributes dialog box in the same order.
- Press after selecting the last attribute definition.
- After being sure that Delete is still selected, check the Annotative check box to enable it, making the A-ROOM-IDEN block Annotative.
- Assuming the Block Definition dialog box looks like Figure 9.18, click OK to dismiss the dialog box.
FIGURE 9.18 The Block Definition dialog box for the A-ROOM-IDEN block
The A-ROOM-IDEN block is defined, and the attribute definitions are deleted from the drawing.
- Save your drawing as I09-06-MultiAttBlock.dwg (M09-06-MultiAttBlock.dwg).
You're almost ready to insert the A-ROOM-IDEN block in each of the three rooms and the decks. But first you need to calculate the area of each room.
Calculating Areas
You can calculate areas in a drawing by using the HATCH command in conjunction with the Properties palette or by using the Area tool. Because area calculations are made over and over again in design, construction, and manufacturing, the AREA and MEASUREGEOM commands are important tools. You can calculate an overall area and then subtract subareas from it, or you can add subareas together to make a total. Chapter 11, “Working with Hatches, Gradients, and Tool Palettes,” covers hatches.
For this exercise, you'll use the Area tool to calculate the areas of the five floor spaces in the floor plan. You need to write down the areas after you make the calculations. Follow these steps:
- Make sure I09-06-MultiAttBlock.dwg (M09-06-MultiAttBlock.dwg) is open.
- Create a new layer named A-AREA-NPLT, and make it the current layer.
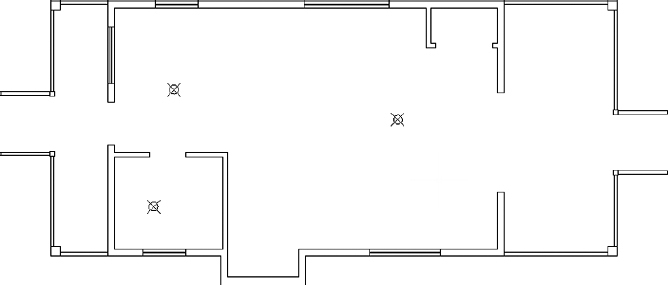
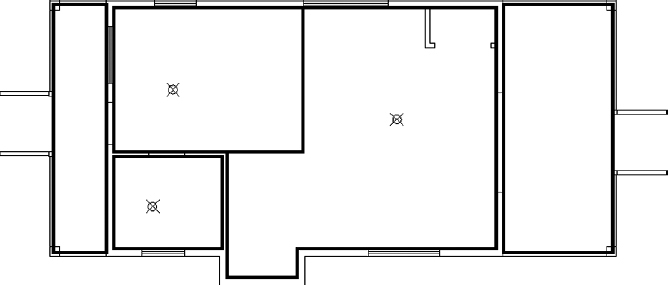
- Freeze all the other layers except A-DECK, A-GLAZ, and A-WALL. Your drawing should look like Figure 9.19.
FIGURE 9.19 The floor plan with all layers turned off except A-AREA-NPLT, A-DECK, A-WALL, and A-GLAZ
The lines you'll draw on the A-AREA-NPLT layer will be used for reference and not plotted in your final plans. This is why we're using the NCS code NPLT, which stands for No Plot.
TIP When you want to select all the layers in a drawing except a few, select those few layers in the Layer Properties Manager, right-click, and choose Invert Selection from the context menu. The unselected layers become selected, and the selected layers are deselected. - Make sure that the Endpoint osnap is running.
- Draw a closed polyline around the inside of each room. To delineate the kitchen from the living room, use the left edge of the large window near the closet as the right edge of the kitchen, and use the bathroom wall as the lower limit.
- Draw a polyline around each of the decks by using the Perpendicular object snap to draw the segments through the posts on the decks' outside corners.
Your cabin should be divided as shown in Figure 9.20.
FIGURE 9.20 Divide the cabin into five distinct sections by using closed polylines.
- Save your drawing as I09-07-AreaBoundary.dwg (M09-07-AreaBoundary.dwg).
Now that the perimeter lines are drawn, you need to calculate the area bound by them:
- Make sure I09-07-AreaBoundary.dwg (M09-07-AreaBoundary.dwg) is open.
 Turn on Selection Cycling from the status bar.
This will help you select the polylines you just drew when they overlap other lines in the drawing.
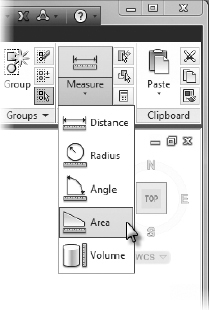
- From the Home tab Utilities panel, click the down-arrow under the Measure button, and then select the Area option, as shown in Figure 9.21.
- Choose the Object option at the Specify first corner point or [Object/Add area/Subtract area/eXit]: prompt to switch to Object mode and then select the bathroom polyline.
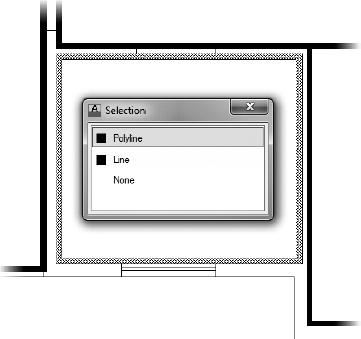
If the Selection dialog box opens after you've made your selection, hover over each of the objects displayed in the list until you find the polyline along the perimeter of the bathroom highlights (see Figure 9.22).
FIGURE 9.22 Using Selection Cycling to select the polyline along the bathroom's perimeter
- The area of the polyline turns green in the drawing area. Press the F2 key to open the AutoCAD text window.
The text window displays the results of your calculation: Area = 7176.00 square in. (49.8333 square ft.), Perimeter = 28′-4″. (Area = 4455000, Perimeter = 8460). You'll also notice that you're not actually in the AREA command; you're in the Area option of the MEASUREGEOM (Measure Geometry) command. This command combines many of the older inquiry commands such as AREA and DISTANCE into a single command.
- Write down the area in square feet (square millimeters) to check against the number calculated in the next section.
- Press to restart the Area option.
- Enter O, and then click the kitchen polyline.
The area should be 135.9792 square feet (12660810). Write down this number. (You can round it to two decimal places; you just want to be able to verify the numbers that AutoCAD will calculate.)
- Repeat this process for the living room, where the area should be 278.3542 square feet (26201990).
- Write down 278.35 (26201990).
- Repeat this process one last time for the front and back decks. The areas should be 135.63 square feet (12648636) and 65.63 square feet (6126516), respectively.
- Thaw all the layers except A-ANNO-TTLB and A-ANNO-TTLB-TEXT, and make the A-ANNO-TEXT layer current.
NOTE The Add and Subtract options in the Area prompt allow you to add together areas you have calculated and to subtract areas from each other. If you're going to add or subtract areas, enter A after you start the AREA command. Then, after each calculation, you'll be given the Add and Subtract options. If you don't enter A at the beginning, you can make only one calculation at a time.
To use the Properties palette to calculate an area, select the polyline to be measured, open the Properties palette, and then scroll down to the Area readout in the Geometry rollout. The area appears in square inches and square feet. This also works for hatch patterns, which are covered in Chapter 11.
Inserting the Room Information Block
You have five areas calculated and recorded, and you are ready to insert the A-ROOM-IDEN block. When you inserted the grid symbols as blocks with attributes earlier in this chapter, the prompts for the attribute text appeared in the command-line interface. With multiple attributes in a block, it's more convenient to display all the prompts in a dialog box. Let's change the setting that makes the dialog box replace the command prompts:
- Continue using I09-07-AreaBoundary.dwg (M09-07-AreaBoundary.dwg), or open it if it's not already open.
- Enter ATTDIA.
- At the prompt, enter 1.
This allows the dialog box containing the prompts to open during the insertion process.
- Set the Node osnap to be the only one running, and make sure the Object Snap button is turned on. The Node osnap snaps the cursor to a point object.
- If it's not already set, change your annotation scale to ¼″ = 1′-0″ (1:50) from the status bar.
- Click the Insert button from the Insert tab Block panel.
- In the Insert dialog box, select A-ROOM-IDEN from the Name dropdown list and then click OK.
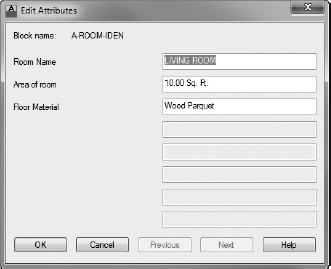
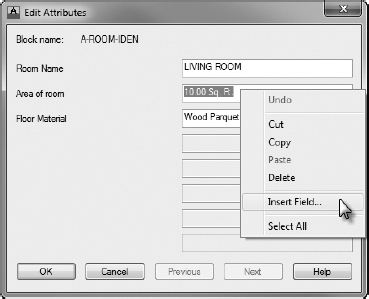
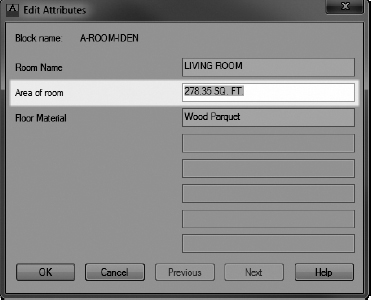
- Select the point object that marks the justification point for the LIVING ROOM label text to open the Edit Attributes dialog box (see Figure 9.23).
FIGURE 9.23 The Edit Attributes dialog box
The only change you need to make is the value for Area Of Room. The defaults are correct for the other two items.
Rather than inputting text, you'll instruct the attribute to read the Area parameter from the polyline.
- Press the Tab key to highlight the Area Of Room box, right-click, and choose Insert Field from the context menu, as shown in Figure 9.24.
FIGURE 9.24 Inserting a field as an attribute
-
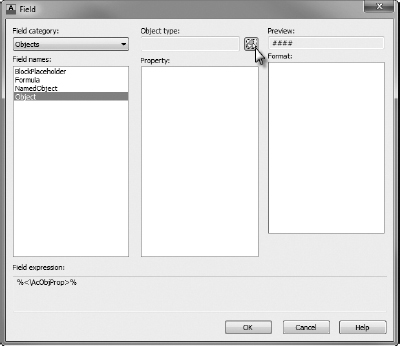
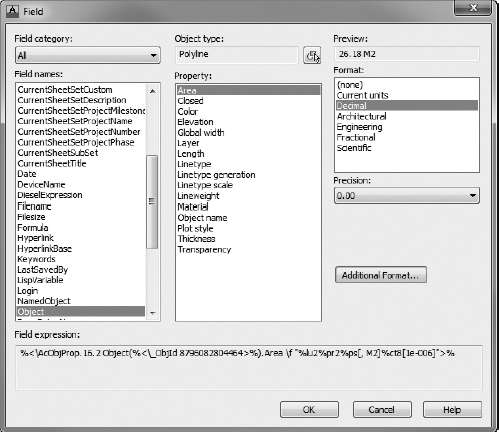
 The Field dialog box opens. In the Field Names column, choose Object and click the Select Object button (see Figure 9.25).
FIGURE 9.25 Choose Object from the Field Names list, and click the Select Object button in the Field dialog box.
The dialog box closes so that you can pick the object that the field will reference.
- Select the polyline that follows the perimeter of the living room.
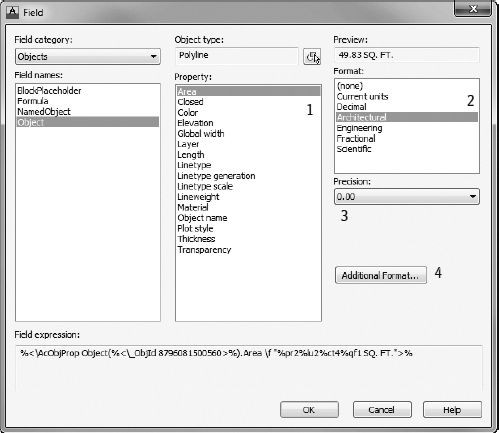
The Field dialog box reopens with additional content in its list boxes.
- Select Area in the Property column, Architectural (Decimal) in the Format column, and 0.00 in the Precision drop-down list.
The correct area measurement appears in the top-right corner of the dialog box (see Figure 9.26).
FIGURE 9.26 The Field dialog box after selecting the polyline and choosing the property and format
If you're working in Architectural units, you can skip to step 19. If you're working in metric units, continue with the next step.
Notice the value in the Preview window in the top-right corner of the dialog box. The number is much too large to be defining the area of the living room in square meters; instead, it's showing the area in square millimeters. Therefore, you need to multiply the value calculated by a conversion factor to display the correct value.
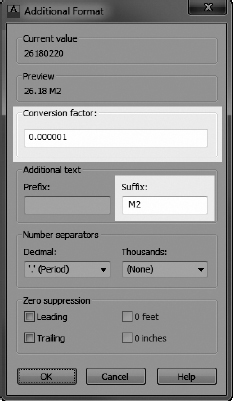
- Click the Additional Format button to open the Additional Format dialog box.
One square meter equals 1,000,000 square millimeters (1000×1000), so each square millimeter is 1/1,000,000 of a square meter.
- To figure out the conversion factor needed to convert square inches into square feet, divide 1 by 1,000,000 and you'll come up with 0.000001.
- Enter 0.000001 in the Conversion Factor field.
- To identify the units, enter M2 in the Suffix field.
Be sure to place a space prior to the M to ensure a gap between the suffix and the calculated area. Your Additional Format dialog box should look like Figure 9.27.
FIGURE 9.27 The Additional Format dialog box
- Click OK to close the Additional Format dialog box.
Note that the Preview section in the Field dialog box now shows the correct value of 26.18 M2, as you can see in Figure 9.28.
- Click OK to close the Field dialog box and return to the Edit Attributes dialog box.
The Area Of Room value is now shown with a gray background, as you can see in Figure 9.29, to identify it as a field rather than a text element.
FIGURE 9.28 The Field dialog box after changing the values in the Additional Format dialog box
FIGURE 9.29 The Edit Attributes dialog box with a field for the Area Of Room value
- Click OK to insert the A-ROOM-IDEN block into the drawing in the living room.
The room label is the only visible attribute (see Figure 9.30). You set the other two attributes to be invisible.
FIGURE 9.30 The first A-ROOM-INFO block is inserted.
- Save your drawing as I09-08-InsertInfoBlock.dwg (M09-08-InsertlnfoBlock.dwg).
Editing Attributes
The remaining four block insertions are almost identical to the first one, with just a few specific changes: changing the room name and referencing a different polyline. Follow these steps to copy and modify the block and attributes that you've created:
- Make sure I09-08-InsertInfoBlock.dwg (M09-08-InsertInfoBlock.dwg) is open.
- Select the LIVING ROOM attribute and, using the Node osnap, copy it to the node at the insertion point for the BATH text.
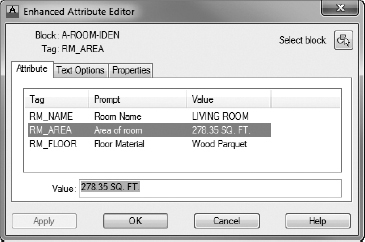
- Double-click the new attribute to open the Enhanced Attribute Editor dialog box, and select the RM_AREA row, as shown in Figure 9.31.
FIGURE 9.31 Select the RM_AREA row in the Enhanced Attribute Editor.
- Double-click the 278.35 SQ. FT. (26.18 M2) value with the gray background at the bottom of the dialog box to open the Field dialog box, where you can edit the preferences and references.
- Inside the Field dialog box, click the Select Object button near the Object Type field.
Both dialog boxes disappear, and the cursor turns into a pickbox.
- Select the polyline that follows the perimeter of the bathroom.
If you're using metric units, do the following:
- Click the Additional Format button when the Field dialog box reappears.
- Repeat steps 14 to 16 from the previous exercise.
- Click OK to close the Field dialog box, and return to the Enhanced Attribute Editor dialog box.
- Select the RM_NAME row.
- At the bottom of the dialog box, highlight LIVING ROOM and enter BATH to replace the text.
- Change the floor material to Tile.
- Click OK to close the dialog box.
The revised BATH attribute is now properly placed in the drawing.
- Repeat steps 2 through 11, substituting KITCHEN, FRONT DECK, and BACK DECK for the room name attribute and selecting the appropriate polyline as a reference for each block.
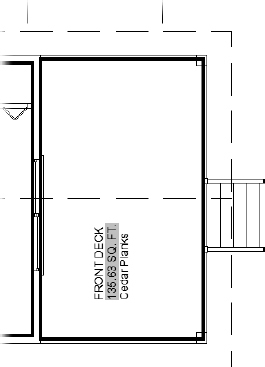
There are no node point objects for the deck text, so you can just rotate and place the attribute a little left of center on the appropriate deck. For the decks, change the floor material to Cedar Planks. Metric users will need to open the Additional Format dialog box for each block and add the conversion factor and suffix for each block. When you are finished, your cabin should look like Figure 9.32.
- Save your drawing as I09-09-EditRoomAttributes.dwg (M09-09-EditRoomAttributes.dwg).
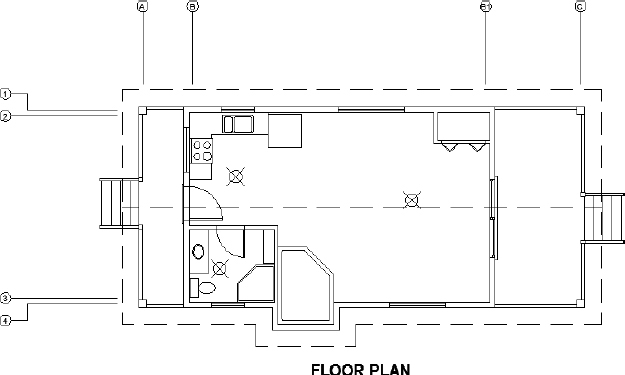
FIGURE 9.32 All A-ROOM-IDEN blocks inserted
EDITING TOOLS FOR ATTRIBUTES
The attribute-editing tools seem complicated at first because their names are similar, but they are easily distinguishable once you get used to them and know how to use them. Here are descriptions of five attribute-editing tools.
The Edit Attributes Dialog Box
This is the same dialog box displayed in the process of inserting a block that has attributes, if the ATTDIA setting is set to 1. This dialog box is used to change attribute values only. Enter ATTEDIT
to use it to edit values of attributes already in your drawing. You will be prompted to select a block reference in your drawing. When you do that, the Edit Attributes dialog box appears.The Enhanced Attribute Editor Dialog Box
With this dialog box, you can edit values and the properties of the attribute text—such as color, layer, text style, and so on. When you enter EATTEDIT
or click Modify Object Attribute Single or click the Edit Attribute (Single) button in the Block panel on the Insert tab and then pick a block that has attributes, the dialog box opens. Double-clicking the block has the same effect.The Properties Palette
Use the Properties palette to edit most properties of attribute definitions. Select the attribute definition, and then right-click and choose Properties to open the Properties palette. Then scroll down to the Attributes rollout.
The Block Attribute Manager
Click the Attribute, Block Attribute Manager button in the expanded Block panel on the Home tab, or enter BATTMAN at the command line to open the Block Attribute Manager dialog box. There you can select a block and edit the various parts of each attribute definition that the block contains, such as the tag, prompt, and value.
The -Attedit Command
You can also edit more than one attribute at a time by clicking Edit Attributes (Multiple) from the Attributes panel of the Insert tab, by choosing Modify
Object Attribute Global, or by entering -ATTEDIT. The prompt reads Edit attributes one at a time? [Yes/No] <Y>. If you accept the default of Yes, you're taken through a series of options for selecting attributes to edit. Select the attributes to edit, and then press to end the selection process. A large X appears at the insertion point of one of the selected attributes. At this point, you get the following prompt: Enter an option [Value/Position/Height/Angle/Style/Layer/Color/Next] <N>:, allowing you to modify any of the characteristics listed in the prompt for the attribute with the X. Press to move to the next selected attribute.If you respond to the first prompt with No, you're taken through a similar set of selection options. You're then asked to enter a current value to be changed and to enter the new value after the change. You can change the values of attributes globally by using the ATTEDIT command this way.
Controlling the Visibility of Attributes
The floor plan looks the same as it did at the beginning of this exercise, except for the addition of the deck labels. But it includes more than meets the eye. What was regular text is now an attribute, and your drawing is “smarter” than it was before. The next few steps illustrate the display controls for the visible and invisible attributes:
- Make sure I09-09-EditRoomAttributes.dwg (M09-09-EditRoomAttributes.dwg) is open.
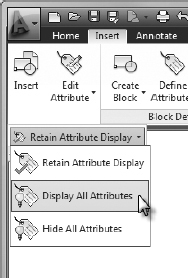
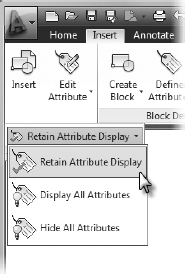
- On the Insert tab Expanded Block panel, click the down-arrow next to the Retain Attribute Display button, and click Display All Attributes, as shown in Figure 9.33.
FIGURE 9.33 Selecting the Display All Attributes option
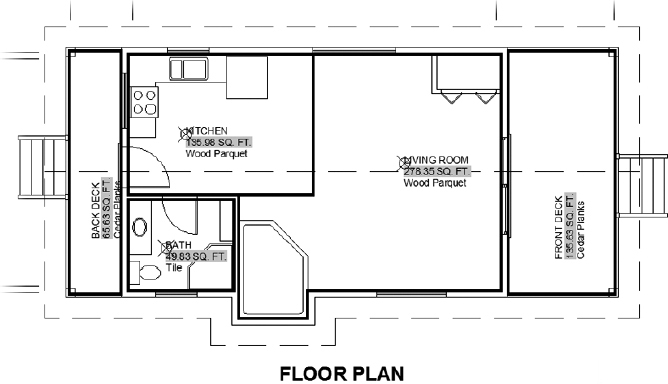
All the attributes, including those designated as invisible, appear with the room labels (see Figure 9.34).
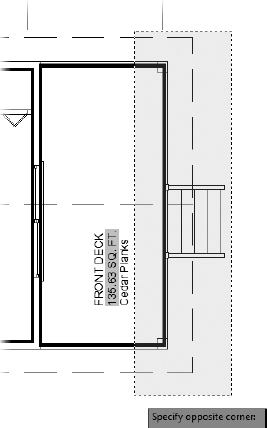
NOTE Like the hyperlink you added to the notes in Chapter 8, the fields are shown with a gray background, but this background does not appear in the printed drawings. As you can see, one of the benefits of using attributes over simple text is the ability to control their visibility. However, their true strength is the ability to output attribute values to spreadsheets or databases. When you use fields and formulas (covered in the “Creating a Table” section later in this chapter), the attribute can adjust its values as the circumstances change, as shown in Figure 9.34. - Start the STRETCH command, and drag a crossing window to enclose part of the front deck, as shown in Figure 9.35.
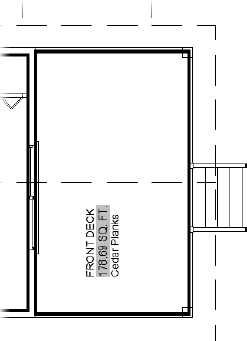
FIGURE 9.35 Select part of the front deck with the STRETCH command.
- Pick any location in the drawing area as the base point, move the cursor to the right, and then click to stretch the deck, as shown in Figure 9.36. Use Ortho mode or Polar Tracking to stretch the objects directly to the right.
FIGURE 9.36 The front deck after stretching it to the right
The deck is now larger, but the attribute showing the area remains at its previous value. Attributes need to be instructed to reevaluate or regenerate themselves. This can happen whenever a drawing is opened or when the REGEN or REGENALL commands are issued.
- The REGEN and REGENALL commands are not included in the Ribbon interface and must be executed at the command line. Enter REA to regenerate and update the display of your block attributes.
The area updates to show the true value for the associated polyline (see Figure 9.37).
The default command alias for the REGENALL command is REA. For the REGEN command, the default alias is RE.
- You don't want the deck at this larger size, so click the Undo button in the Quick Access toolbar, or press U until your drawing is in the state it was just before the STRETCH command was executed.
The visibility of the attributes, as you defined them in the Attribute Definition dialog box, is called their normal state.
FIGURE 9.37 The front deck after the REGENALL command is issued
- To return them to this state, click the down-arrow next to the Display All Attributes button on the expanded Block panel within the Insert tab, and then click Retain Attribute Display (see Figure 9.38).
FIGURE 9.38 Returning the attribute display to normal
All the attributes return to their normal state (see Figure 9.39).
The Display All Attributes and Hide All Attributes options make all attributes in a drawing visible or invisible, regardless of how you set the Visible/Invisible mode in the attribute definition. The Normal setting allows an attribute to be displayed only if the Visible/Invisible mode was set to Visible in the definition.
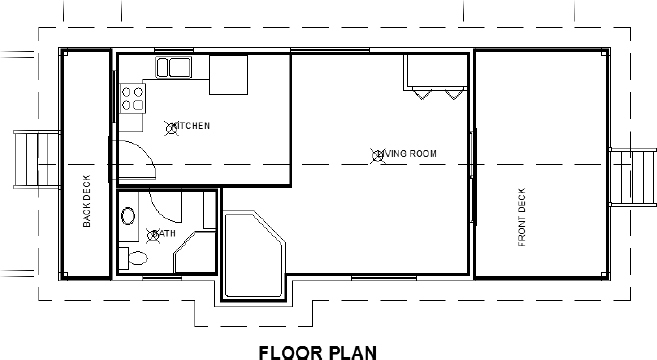
FIGURE 9.39 All the attributes in their normal state
Exploring Other Uses for Attributes
Along with grid symbols and room, window, and door schedules, another common use for attributes is in standardized title blocks, particularly in facilities management and interior design. You can specify every piece of equipment such as pumps, electrical panels, HVAC air handling units, and even office furniture in a building with attributes. You can then extract the data and generate a schedule that is used to build a database in which ordering and maintenance information can be referenced. Many equipment manufacturers have developed their own proprietary software that works with AutoCAD and automatically sets up attributes when you insert their blocks of the equipment, which they have predrawn and included in the software package.
Attributes are also being used more and more in maps drawn in AutoCAD, which are then imported into geographical information system (GIS) software (a powerful analysis and presentation tool). When map symbols, such as building numbers, are blocks containing an attribute, they're transformed in the GIS program in such a way that you can set up links between the map features (buildings) and database tables that contain information about the map features. In this way, you can perform analyses on the database tables, and the results automatically appear graphically on the map. (For example, you could quickly locate all buildings that have a total usable area greater than a specified square footage.)
In the next section, you'll go through an exercise that demonstrates how you can create dynamic blocks that vary their appearance based on user input.
Creating a Dynamic Block
In Chapter 7, you created blocks for the windows and doors. However, because of the door block's schematic appearance, you were not able to scale it as you did with the window block. Scaling the door and swing would have allowed one door block to fit into any size opening, but it would have also scaled the thickness of the door differently for each door width. Dynamic blocks are standard blocks with additional functionality to allow certain features to change without affecting all objects in the block. The door blocks are an excellent opportunity to explore the abilities of dynamic blocks in AutoCAD.
The basic procedure for setting up a dynamic block has the following stages:
- Create the block by using the BLOCK command.
- Right-click the block and choose Block Editor.
- Click a parameter, and follow the command prompts to create the parameter.
- Click the Actions tab, and click an action to associate with the parameter.
- Follow the command prompts to set up the action.
- Use the Properties palette to rename and specify settings for the parameter and any actions associated with it.
- Save your work back to the block definition, and close the Block Editor.
You'll work through this process by converting the A-DOOR-36IN (A-DOOR-0915) block from your cabin drawing into a dynamic block in a new drawing:
- With I09-09-EditRoomAttributes.dwg (M09-09-EditRoomAttributes.dwg) as the current drawing, zoom in to the floor plan at the back of the cabin.
- Right-click in a blank area of your drawing, and select Clipboard Copy With Basepoint from the context menu that appears.
The command line changes to Specify base point :.
- Use the Insert osnap to select the insertion point of the back door block as the base point.
- Select the back door block and press .
This copies the door block to the Windows Clipboard.
- Start a new drawing. Change the Length units to Architectural (Decimal), verifying that Insertion Scale is set to Inches (Millimeters).
- From the Home tab Clipboard panel, choose the Paste tool and, when prompted to specify the base point, enter 0,0.
The A-DOOR-36IN (A-DOOR-0915) block is inserted into your new drawing. Perform a Zoom Extents to bring the entire block into view.
- Save your new drawing containing the A-DOOR-36IN (A-DOOR-0915) block as I09-10-DynamicBlock.dwg (M09-10-DynamicBlock.dwg).
- Select the door block, right-click, and choose Block Editor from the context menu.
The drawing area turns gray, and the Block Authoring palettes open along with the Block Editor contextual tab to indicate that you are in the Block Editor.
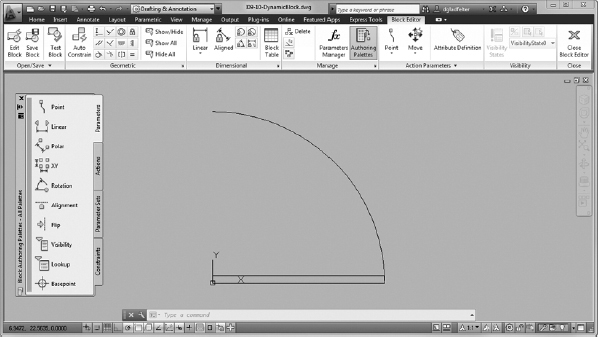
- Pan the view, and adjust the Block Authoring palettes so that your screen looks similar to Figure 9.40.
FIGURE 9.40 The door block in the Block Editor
You want to be able to use this door block for openings of the following widths: 2′-0″, 2′-6″, 3′-0″ and 3′-6″ (609 mm, 762 mm, 915 mm, and 1068 mm).
Setting Up Parameters and Actions
You'll use the Linear parameter to set up the 6″ (153 mm) increments for the door width. Then you'll associate a Stretch action with that parameter to allow the door width to change, and you'll associate a Scale action to allow the door swing to change. Follow these steps:
- Make sure I09-10-DynamicBlock.dwg (M09-10-DynamicBlock.dwg) is open.
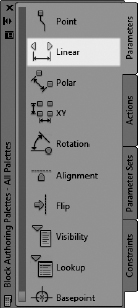
- Make sure Parameters is the active palette in the Block Authoring Palettes panel, and then click the Linear Parameter icon (see Figure 9.41).
FIGURE 9.41 The Linear parameter in the Block Authoring Palettes panel
- Make sure the Endpoint osnap is running.
- Click the lower-left corner of the door, and then click the open endpoint of the door swing.
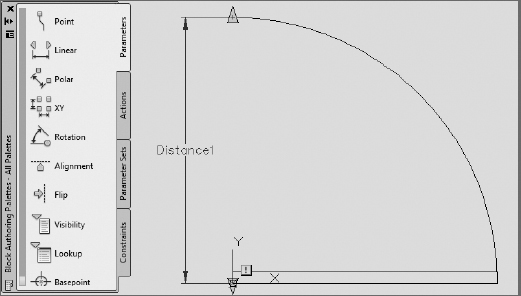
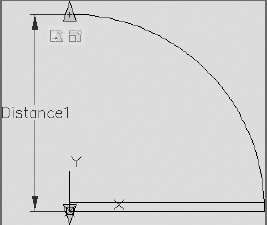
- Move the cursor to position the dimension symbol a little to the left of the door block, and then click to place it (see Figure 9.42).
For the Distance parameter to work, it must be paired with a Dynamic Block action. Note the small exclamation symbol on a square yellow background. This reminds you that no action has been associated with this parameter. You'll set up the Stretch action first:
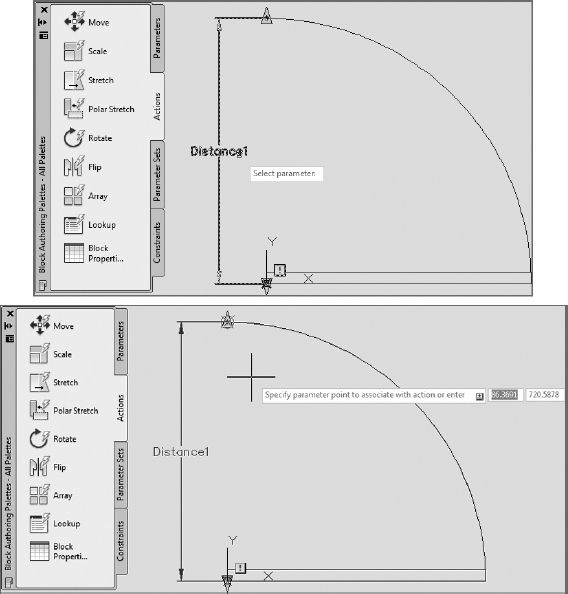
 Click the Actions tab on the Block Authoring Palettes palette set, and then click the Stretch icon.
- Select the Distance parameter (Distance1) to the left of the door, and then click the up-pointing arrow at the end of the door swing (see Figure 9.43).
FIGURE 9.42 The Linear parameter is placed.
FIGURE 9.43 Selecting the Distance parameter (top) and picking the linear grip (bottom)
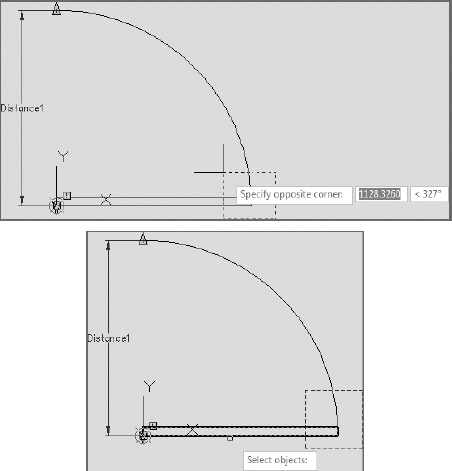
- At the Specify opposite corner of stretch frame or [CPolygon]: prompt (see the top of Figure 9.44), form a crossing polygon around the right half of the door, clicking each of the opposing corners rather than clicking and dragging, as shown at the bottom of Figure 9.44.
FIGURE 9.44 Defining the stretch frame (left) and selecting the door objects (right)
 At the Select objects: prompt, select the door and then press .
The Stretch Action icon appears near the end of the door swing (see Figure 9.45).
- Click the Scale Action icon on the Actions palette.
The Scale Action icon appears next to the Stretch Action icon, as shown in Figure 9.45.
- Select the Distance (Distance1) parameter again, select the arc, and then press .
- Minimize the Block Authoring palettes.
FIGURE 9.45 The A-DOOR-36IN block with the Stretch and Scale actions assigned to the Distance parameter
- Save your drawing as I09-11-ParametersActions.dwg (M09-11-ParametersActions.dwg).
This completes your work with the Block Authoring Palettes panel. You'll accomplish the rest of the tasks with the Properties palette.
Fine-Tuning the Dynamic Block with the Properties Palette
The Distance Linear parameter shows the width of the opening and is perpendicular to the door's width. You need to set up an offset angle so that the door width changes as the opening width changes. Then you need to set up the incremental widths and rename the parameter and actions. You'll set up the increments first:
- Make sure I09-11-ParametersActions.dwg (M09-11-ParametersActions.dwg) is open.
- Select the Distance parameter and then open the Properties palette.
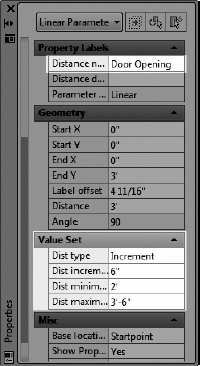
- In the Property Labels section on the palette, change Distance Name from Distance1 to Door Opening.
- Scroll down to the Value Set section and click the Dist Type text box, which reads None.
- Open the drop-down list and select Increment.
- Moving down line by line, set the following values:
- Dist Increment to 6″ (153)
- Dist Minimum to 2′ (609)
- Dist Maximum to 3′-6″ (1068)
See Figure 9.46.
FIGURE 9.46 Change the parameters in the Properties dialog box.
- Deselect the Distance parameter.
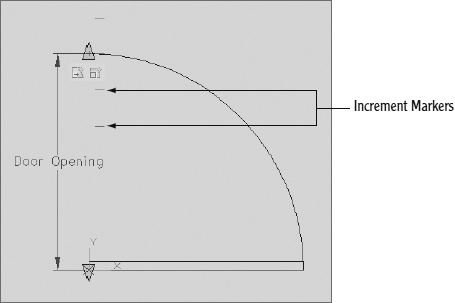
The block now has the increment markers for the door opening widths (see Figure 9.47).
Now, the final task is to fine-tune the Stretch and Scale actions that control the door size and swing:
 Click the Stretch Action symbol near the end of the door swing.
The symbol, the Distance parameter, and the window you drew earlier ghost.
- In the Properties palette, scroll down to the Overrides section; for Angle Offset, enter 270.
This is the direction the door will stretch relative to movement of the open end of the door swing arc. The Distance multiplier stays at 1.0000 because you don't want the width of the door to change in the same proportion as the width of the opening.
FIGURE 9.47 Dynamic door block with increment markers for the opening widths
- In the Misc section, change Action Name from Stretch to Door Size.
 Deselect this action, and select the Scale action.
- In the Misc section of the Properties palette, change Action Name from Scale to Door Swing Size.
 Click the Test Block button found on the Block Editor contextual tab Open/Save panel.
A new window opens with the block displayed in the drawing area, the Block Editor contextual tab disappears, and the contextual Close panel (green background) opens on the far-right side of the Ribbon.
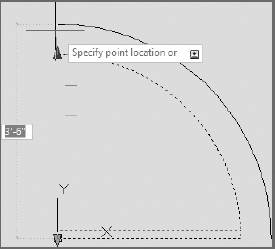
- Select the block, and then use the light-blue arrow to test the Distance parameter you added to the A-DOOR-36IN (A-DOOR-0915) block, as shown in Figure 9.48.
- After testing the block, click the Close Test Block Window button on the contextual Close panel found to the right of any Ribbon tab.
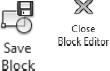 Close the Properties palette, and click the Save Block button in the Open/Save panel under the Block Editor contextual tab.
- Click the Close Block Editor button at the right end of the Ribbon to return to the drawing.
FIGURE 9.48 Using Test Block to verify the functionality of the Distance parameter
Because the A-DOOR-36IN (A-DOOR-0915) block is now dynamic and able to illustrate doors ranging in size, let's give the block a more appropriate name.
- Enter RENAME at the command line to open the Rename dialog box shown in Figure 9.49.
- Select Blocks under the Named Objects group within the Rename dialog box.
- Select the A-DOOR-36IN (A-DOOR-0915) block in the Items list, and enter A-DOOR in the Rename To text box, as shown in Figure 9.49.
- Click OK after entering the new A-DOOR name.
- Save the drawing as I09-DynDoor.dwg (M09-DynDoor.dwg) in the same folder as your other Chapter 9 drawings, and then close the drawing.
Inserting a Dynamic Block
When you use this block in your floor plans, insert it just as you would a regular door block. Then copy it to the various doorway openings in the plan, orient it, and adjust its size to fit the openings. You can easily edit dynamic blocks, which are a versatile feature to have at your disposal.
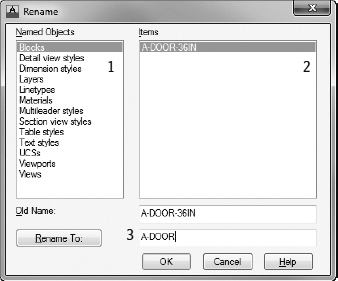
FIGURE 9.49 Renaming the A-DOOR-36IN (A-DOOR-0915) block to A-DOOR by using the RENAME command
You'll use the dynamic door block that you just created to replace the doors in your cabin:
- In the I09-09-EditRoomAttributes.dwg (M09-09-EditRoomAttributes.dwg) drawing, delete the two existing swing doors.
- Make the A-DOOR layer current, and then freeze the A-ANNO-TEXT, A-AREA-NPLT, A-GRID, A-ROOF, A-WALL-HEAD, and A-FLOR-FIXT layers.
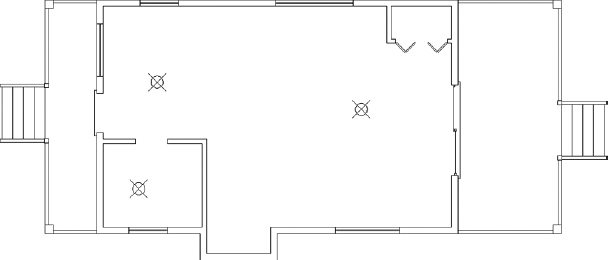
Your drawing should look like Figure 9.50.
FIGURE 9.50 The cabin drawing with most of the layers frozen and the doors deleted
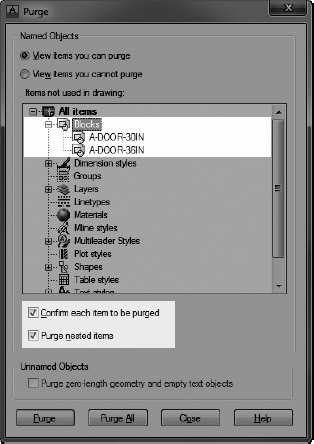
You will use the A-DOOR block you defined in the I09-DynDoor (M09-DynDoor) drawing. Because this block will take the place of both the A-DOOR-36IN (A-DOOR-0915) and A-DOOR-30IN (A-DOOR-0762) blocks, it's best to remove both from the I09-09-EditRoomAttributes (M09-09-EditRoomAttributes) drawing. Spending a moment to perform some drawing maintenance and clean out unneeded objects will help achieve the best drawing performance. You will delete the block definition by using the Purge dialog box.
 From the Application menu, choose Drawing Utilities Purge, or enter PURGE to open the Purge dialog box.
- Click the plus sign (+) to expand the Blocks entry to display the two door blocks (see Figure 9.51).
FIGURE 9.51 Deleting the block references with the Purge dialog box
- Select the Blocks entry, check the Purge Nested Items option, and make sure Confirm Each Object To Be Purged is unchecked.
- Click the Purge button and then close the dialog box.
TIP You can purge only those objects and features that do not exist in the drawing, such as deleted blocks, empty layers, or linetypes that are not used. Some items, including layer 0 and the Standard text style, can't be purged. AutoCAD can also accumulate registered applications (regapps), usually from third-party applications or features no longer used in the current drawing, and geometry lines with a length of 0. To eliminate them, you must enter -PURGE to start the PURGE command without the dialog box and then choose the Regapps (R) option. The All option (A) will not purge these types of objects. Run PURGE often to eliminate accumulated junk in your drawing that contributes to larger file sizes and slower performance.
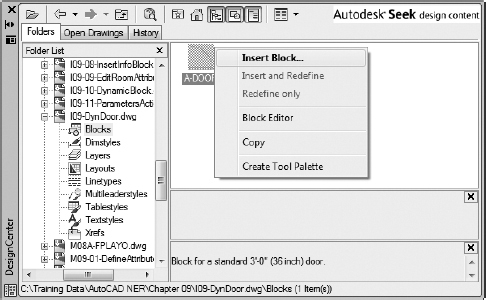
 With the Endpoint osnap and Polar Tracking running, click the DesignCenter button on the View tab Palettes panel.
- Click the Folders tab in the DesignCenter palette that opens.
- Use the folder tree to browse to the I09-DynDoor.dwg (M09-DynDoor.dwg) drawing you just saved in your dataset directory.
The I09-DynDoor.dwg (M09-DynDoor.dwg) file can also be found in the Chapter 9 download on this book's website at http://sybex.com/go/autocad2013ner or the companion website at http://thecadgeek.com.
- Expand the I09-DynDoor (M09-DynDoor) drawing inside the DesignCenter palette to select the Blocks option.
- Right-click the A-DOOR block and select Insert Block (see Figure 9.52).
FIGURE 9.52 Using DesignCenter to insert the dynamic A-DOOR block
The Insert dialog box opens, where you can specify how you would like the A-DOOR block inserted into your drawing.
- Verify that the only check box selected within the Insert dialog box is the Specify On-Screen check box under the Insertion Point group, and click OK.
The A-DOOR dynamic door block appears, attached to the cursor.
- Click the lower-right corner of the back door opening to insert the block.
This is a 3 ′-0″ (915 mm) door opening, so you don't need to modify the block.
- Press to restart the INSERT command.
- In the Insert dialog box, select the Specify On-Screen options under Rotation.
- Enter -1 for the X scale.
- Enter 1 for the Y and Z scales.
- Click the lower-right corner of the bathroom opening to place the door.
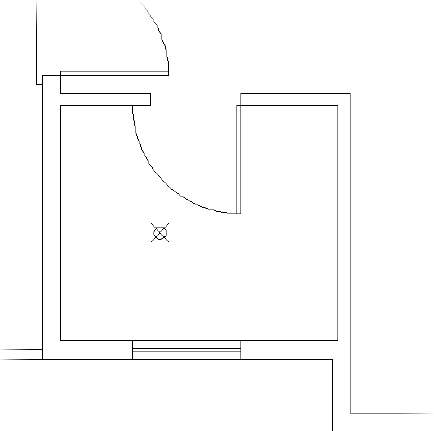
- Using Polar Tracking, move your cursor to rotate the door as shown in Figure 9.53.
FIGURE 9.53 The door must be resized to fit.
The door is placed properly, but as shown in Figure 9.53, the default size is too large for the opening.
- Close DesignCenter if it's still open, and select the bathroom door block to reveal the blue dynamic arrows (see Figure 9.54).
FIGURE 9.54 The dynamic block's resizing arrows
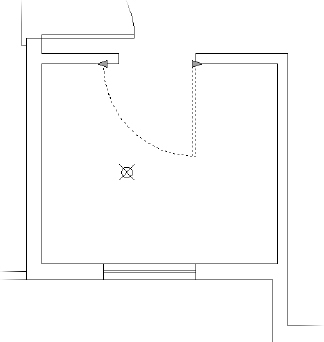
- Select the left arrow and drag it up to the corner of the opening. Notice how the length of the door changes as well (see Figure 9.55).
FIGURE 9.55 Resizing the dynamic block
- Click to set the door size, and then press Esc to deselect the door.
The door block is scaled properly with no distortion to the width of the door itself (see Figure 9.56).
FIGURE 9.56 The dynamic door block scaled to fit the 2′-6″ (762 mm) door opening
- Save your drawing as I09-12-InsertDynBlock.dwg (M09-12-InsertDynBlock.dwg).
This completes the section on dynamic blocks. If you want to experiment with the dynamic block feature, examine the sample dynamic blocks to see how they work and are set up, and try to create one of your own. The next section covers the methods for creating a table.
Creating a Table
Most professions that use AutoCAD use tables to consolidate and display data in organized formats. Architectural construction documents usually include at least three basic tables: door, window, and room finish schedules. These are usually drawn in table form, and they display the various construction and material specifications for each door or window type or for each room. In mechanical drawings, the bill of materials and other specifications can be found in tables. To illustrate the AutoCAD tools for creating tables, you'll construct a simple door schedule for the cabin.
You create tables in AutoCAD by first creating a table style and then creating a table using that style. It's a process similar to that of defining a text style and then inserting text in a drawing using that style.
Defining a Table Style
Table styles are more complex than text styles. They include parameters for the width and height of rows and columns and, among other elements, at least one text style.
- Make I09-12-InsertDynBlock.dwg (M09-12-InsertDynBlock.dwg) the current drawing if it isn't already.
- Create a new layer called A-ANNO-TABL, assign it color 62, and make it the current layer.
 Click the Annotate tab. Then click the small arrow in the Tables panel's title bar to open the Table Style dialog box (see Figure 9.57).
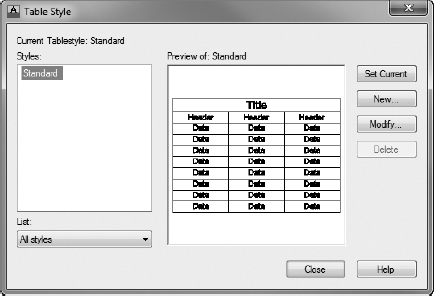
FIGURE 9.57 The Table Style dialog box
On the left is the Styles list box. It displays all of the defined table styles. To the right of that is a Preview Of window that displays the current table style—in this case, the Standard style because it's the only one defined so far. Below the Styles list box is a drop-down list called List that gives you options for which table styles to display. To the right of the preview window are four buttons.
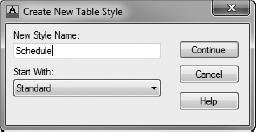
- Click the New button to open the Create New Table Style dialog box.
- In the New Style Name text box, enter Schedule, as shown in Figure 9.58, to create a new table style name, and click Continue.
FIGURE 9.58 Naming the new table style
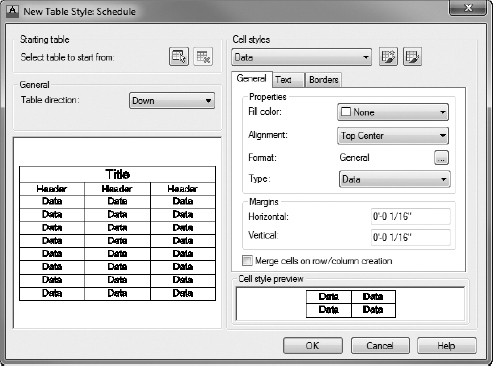
The New Table Style dialog box opens with Schedule in the title bar (see Figure 9.59). The new style you're defining will be like the Standard style with the changes you make here. The dropdown list in the Cell Styles section contains the three parts of the sample table at the bottom-right corner of the dialog box: Data, Header, and Title.
FIGURE 9.59 The New Table Style dialog box
You can specify text and line characteristics for each of the three parts. Be sure the Data option is active in the Cell Styles group.
TIP Not only can each table have its own style, but each cell can have a distinct style as well. By using the Launches The Create A New Cell Style Dialog Box and Launches The Manage Cell Styles Dialog Box buttons in the top-right corner of the New Table Style dialog box, you can design and apply any number of cell styles within a table.  Click the Text tab, and then click the Text Style ellipsis button to the right of the Text Style drop-down list to open the Text Style dialog box.
You want a new text style for the door schedule.
- Define a new style called A-Tabl, and use the Arial font and a 0′-0″ (0) height.
A Height value here allows you to control the height in the New Table Style dialog box.
- Click Apply and then click Close.
The table style now appears in the Text Style drop-down list, and the data cells in the two preview windows now show the Arial font.
- Set Text Height to 6″ (152). Leave Text Color and Text Angle at their default settings.
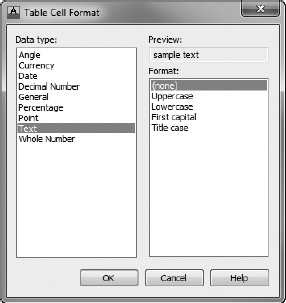
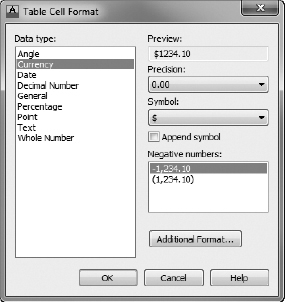
- Switch to the General tab, and click the ellipsis button at the end of the Format row. In the Table Cell Format dialog box, change Data Type to Text and change Format to (None), as shown in Figure 9.60. Then click OK.
FIGURE 9.60 Changing the data format in the Table Cell Format dialog box
The selected data type prevents numeric data from justifying to the right, rather than following the specified Middle Center option.
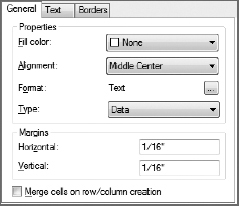
- Change Alignment to Middle Center. The General tab should look like Figure 9.61.
FIGURE 9.61 The General tab of the New Table Style dialog box
- In the Cell Styles drop-down list at the top of the dialog box, choose Header to expose its parameters.
- In the Text tab, choose the same text style (A-Tabl) and set the height to 9″ (229).
- Choose Title from the Cell Styles drop-down list.
- Select the A-TABL text style again, and set the height to 12″ (305).
- In the General tab, set the Horizontal and Vertical Margins to 4″ (102).
You'll leave the Border properties at their default settings. These control the visibility of the horizontal and vertical lines of the table, their lineweights, and their colors. Your profession or discipline might have its own standard for these parameters.
- In the General section, on the left side of the dialog box, make sure Table Direction is set to Down. Click OK to save the new table style.
- Back in the Table Style dialog box, in the Styles list, click Schedule to highlight it, and then click the Set Current button to make it the current table style (see Figure 9.62). Click Close.
- Save your drawing as I09-13-TableStyle.dwg (M09-13-TableStyle.dwg).
Now let's look at the geometry of the new table.
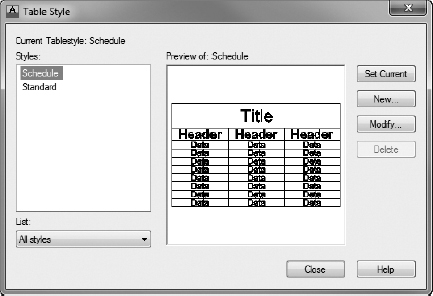
FIGURE 9.62 The Table Style dialog box with Door Schedule as the current table style
Designing a Table
The parameters in the Schedule table style have set the height of the rows. You now need to determine the width of the columns and figure out how many columns and rows you need for the door schedule. You do this as you insert a new table. Remember that Schedule is the current table style. Follow these steps:
- Make sure I09-13-TableStyle.dwg (M09-13-TableStyle.dwg) is open.
- Zoom and pan so that you can see the area below the cabin.
The table won't fit inside the title block perimeter, but I'll show you how to give it its own title block in Chapter 14, “Using Layouts to Set Up a Print.”
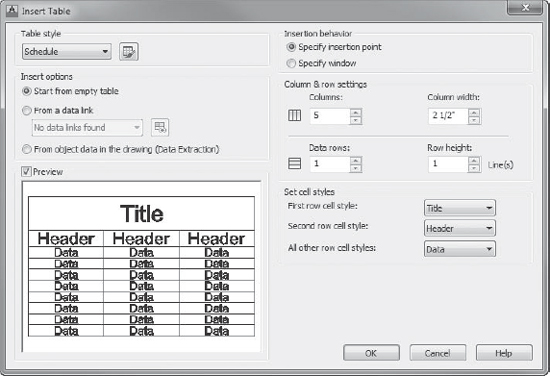
 In the Annotate tab's Tables panel, click the Table button to open the Insert Table dialog box (see Figure 9.63).
In the Table Style group, Schedule appears in the Table Style dropdown list because it's now the current table style. An abstract version of the table appears below, in the preview area.
- On the right side, click the Specify Window radio button if necessary.
You'll make a window to define the extents of the table.
- Below, in the Column & Row Settings group, click the Columns and Row Height text boxes.
You need to define only the number of columns in the table. You won't worry about the row height for now; it's determined by the number of lines of text, and you're using only one line of text.
- You'll have six categories to describe the doors, so set the Columns box to 6.
Each column is initially set to the same width. You can adjust it later.
- Click OK.
- Back in the drawing, turn off Object Snap and Polar Tracking on the status bar.
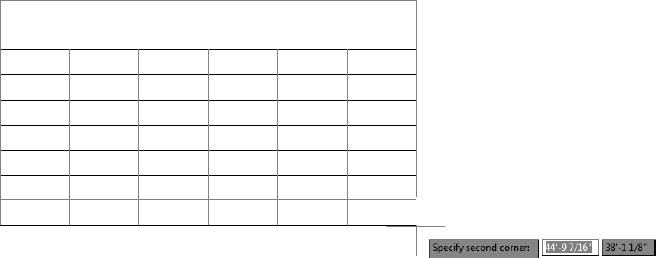
- Click a point that is left of center and below the cabin.
This establishes the upper-left corner of the new table, so make sure it's below the extents of the title-block border.
- Drag the cursor across the drawing and down until the screen displays a table that has eight rows (six data rows, a header row, and a title row) and then release the mouse button (see Figure 9.64).
The new table appears; its title bar has a flashing cursor and a light-gray background. The background above and to the left of the table is dark gray. The table's columns are indicated by letters, and the rows are numbered. The Text Editor contextual tab and panels appear in the Ribbon.
- With Caps Lock on, enter DOOR SCHEDULE .
The cursor moves to the upper-left cell in the table. This is the row for the column headers.
FIGURE 9.64 The new table inserted in the drawing
- With Caps Lock on, enter SYM and press the Tab key to highlight the next column header to the right.
- Moving across the header row, do the following:
- Enter (in caps) NAME and press the Tab key.
- Enter H&W and press the Tab key.
- Enter TYPE and press the Tab key.
- Enter MAT'L and press the Tab key.
- Enter COST.
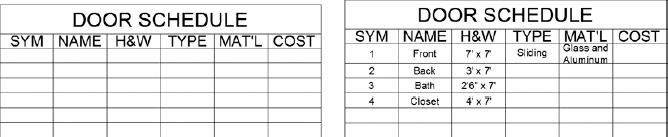
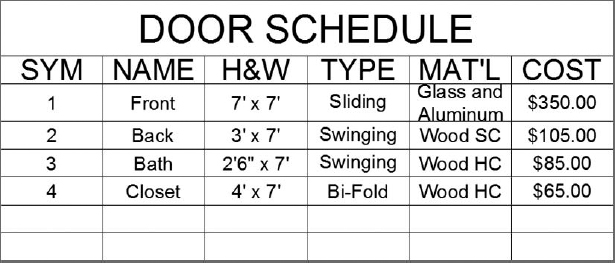
This completes the row of column heads (see the top of Figure 9.65).
FIGURE 9.65 The table with its title and column heads (left), and the table partially filled in (right)
- Partially fill in the data for the door schedule that's shown at the bottom of Figure 9.65 in the same manner.
NOTE Pressing the Tab key instead of moves the activated cell left to right across each row and then down to the next row. Pressing moves the activated cell down each column and then ends the command. For the Glass and Aluminum material, don't press to move to the next line; simply keep typing. The text wraps automatically, and the cell height changes to accommodate the additional lines of text.
- You don't have to enter everything from scratch; it's easy to copy the contents of one cell into other cells:
- Enter Swinging in cell D4, and then highlight the text.
- Press Ctrl+C to copy the highlighted text to the Windows Clipboard.
- Deselect the current cell, and then select the cell below it by clicking in cell D5.
- Press Ctrl+V to paste the word Swinging into the selected cell.
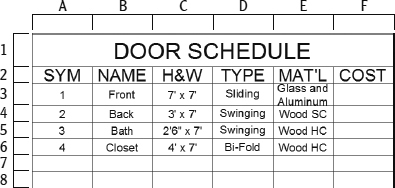
- Complete the Type and Material columns, as shown in Figure 9.66.
FIGURE 9.66 The table with its text-based cells filled in
- Save your drawing as I09-14-CreateTable.dwg (M09-14-CreateTable.dwg).
SETTING THE CELL STYLE
If a cell justification doesn't appear correctly or you want to change the style of a cell or range of cells, select the cells you want to change. In the Cell Styles panel under the Table Cell tab, expand the Cell Justification fly-out button and choose the appropriate style.
Adding Formulas to a Table
Currently, all the data cells are configured to hold text information and not numbers. You will now change the Cost column to read the information as numbers and then sum the values in the bottom cell with a formula:
- Make sure I09-14-CreateTable.dwg (M09-14-CreateTable.dwg) is open.
- Select all the cells below the Cost header in column F by clicking in cell F3, holding down the Shift key, and then clicking in cell F8.
- Right-click, and choose Data Format from the context menu.
- In the Table Cell Format dialog box that opens, choose Currency for Data Type.
- Choose 0.00 from the Precision drop-down list (see Figure 9.67).
- If necessary, change the Symbol value to the symbol of your local currency.
- Click OK to close the dialog box.
- In the Cost column, enter the following:
- 350 for the front door
- 105 for the back door
- 85 for the bathroom door
- 65 for the closet door
AutoCAD automatically formats the numbers to two decimal places and adds a dollar sign to each, as shown in Figure 9.68.
FIGURE 9.68 The Cost column filled in
- Click in the empty cell at the bottom of the Cost column to select it.
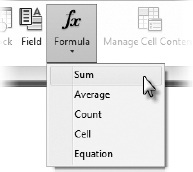
- In the Insert panel, click the Formula button and then choose Sum, as shown in Figure 9.69.
As in a spreadsheet, a Sum formula adds the values of all the cells in a selected region.
FIGURE 9.69 Adding a formula to the cell
- At the Select first corner of table cell range: prompt, click in cell F3, the first door-cost cell.
- At the Select second corner of table cell range: prompt, click in cell F6, the bottom door-cost cell.
- The formula "=SUM(F3:F6)" appears in cell F8. Click anywhere outside the table to deselect the cell and display its calculated value of $605.00, as shown in Figure 9.70.
- Save your drawing as I09-15-TableFormula.dwg (M09-15-TableFormula.dwg).
FIGURE 9.70 The completed table
The table is finished, and now you just need to do a little cleanup in your drawing to avoid any problems in the future and to tie elements in the drawing back to the table:
- Make sure I09-15-TableFormula.dwg (M09-15-TableFormula.dwg) is open.
- Thaw the A-ANNO-TEXT, A-ANNO-TTLB-TEXT, and A-ANNO-TTLB layers.
- Move your table as required so that it doesn't overlap the notes or title block.
- Select one of the point objects you used to place the room name blocks, right-click, and choose Select Similar to select each of the points.
- Press the Delete key to remove the points from your drawing.
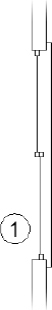
You need a symbol for each door that corresponds to each number in the SYM column.
- With the A-ANNO-TABL layer current, draw a circle with a radius of 6″ (175).
- Press the Single Line Text button in the Annotation panel under the Home tab.
- Right-click, and choose the Justify option from the context menu.
- Choose the Middle option so that the text will be centered around the insertion point.
- Activate the Center osnap and then click the circle.
- Set the height to 6″ (175) and the rotation angle to 0.
- When the blinking cursor appears at the center of the circle, enter 1. The number 1 is centered in the circle.
- Move the symbol near the front door, as shown in Figure 9.71, and then copy it to locations near the other three doors.
- Edit each of the symbol's numbers so that they correspond to their entries in the SYM column.
Your drawing should look like Figure 9.72.
FIGURE 9.71 The first door symbol placed by the front door
FIGURE 9.72 The cabin with the door symbols added
- Thaw the A-GRID layer, and save this drawing as I09-16-DoorTags.dwg (M09-16-DoorTags.dwg).
Creating Tables from Attributes
Early in this chapter, you replaced your static room labels with more-versatile attribute blocks. The A-ROOM-IDEN attribute block you defined for your room labels contains three attributes: one set to a visible state and two set to an invisible view state. As you may recall, the two invisible attributes allowed you to enter the area (RM_AREA) and floor material (RM_FLOOR) for each room.
Even though you cannot see either of these attributes in the drawing area, both are still accessible by other parts of the software. You can pull the values from all three attributes contained within the A-ROOM-IDEN block into a table by using the Data Extraction feature of the TABLE command. Using a data-extraction table, AutoCAD will scan your drawing for every insertion of the A-ROOM-IDEN block and compile its data (attributes) into a table that will serve as your room schedule. Let me show you how:
- Continue using I09-16-DoorTags.dwg (M09-16-DoorTags.dwg), or open it if it isn't already open.
- Start the TABLE command from the Annotate tab Tables panel to open the Insert Table dialog box.
- Select the From Object Data In The Drawing (Data Extraction) option found within the Insert Options group of the Insert Table dialog box, as shown in Figure 9.73. Then click OK.
FIGURE 9.73 Creating a new data-extraction table
The Data Extraction Wizard opens. This eight-part wizard will walk you through the creation of a data-extraction table.
- From the Data Extraction - Begin (Page 1 of 8) dialog box, select the Create A New Data Extraction option and then click Next.
The Save Data Extraction As dialog box opens.
- Browse to your Chapter 9 Training Dataset folder within the Save Data Extraction As dialog box, enter I-RoomArea (M-RoomArea) in the File Name text box, and click Save.
The Save Data Extraction As dialog box closes, and you're taken to the second step within the Data Extraction Wizard.
- Choose the Drawings/Sheet Set option.
- Check the Include Current Drawing check box within the Data Extraction - Define Data Source dialog box, and click Next.
TIP Although in this case you're extracting data only from the current drawing, data-extraction tables can pull information from multiple drawings all at once. This feature is useful when using data-extraction tables for quantity takeoffs when each floor of a multilevel building is stored in a separate drawing.
Next, the Data Extraction Wizard asks you to specify the objects from which to extract data. In this case, you're interested only in the data contained within the A-ROOM-IDEN block.
- Uncheck the Display All Object Types check box, and choose the Display Blocks Only option.
- Right-click one of the objects listed within the Objects group of the dialog box, and choose Uncheck All.
- Select the check box next to the A-ROOM-IDEN object.
The Data Extraction - Select Objects (Page 3 of 8) dialog box should look like Figure 9.74. After selecting the A-ROOM-IDEN block, click Next to move on to the next step of the wizard.
Next, you need to specify the attributes (properties) you want the data-extraction table to include. In this case, you're interested in only the three block attributes contained within the A-ROOM-IDEN block.
- Click the Category header to sort the properties by category type.
This brings the Attributes category to the top of the list.
- Uncheck the check boxes next to the RM-NAME, RM_AREA, and RM_FLOOR properties.
- Right-click in the list area, and select Invert Selection.
This deselects all but the three block attributes contained within your room identification block.
- Double-click in the Display Name cell for the RM_NAME attribute, and enter ROOM.
FIGURE 9.74 Selecting the A-ROOM-IDEN block within the Data Extraction Wizard
- Repeat by entering AREA for the RM_AREA attribute and MATL for the RM_FLOOR attribute.
The Display Names will be used as the column headings in your table. Verify that the Data Extraction - Select Properties (Page 4 of 8) dialog box looks like Figure 9.75, and click Next to continue.
FIGURE 9.75 Selecting the block attributes within the A-ROOM-IDEN block
You have now selected the data you want included in your data-extraction table. The Refine Data portion of the Data Extraction Wizard will allow you to order the columns and to choose whether to include or exclude the block name and count.
- Uncheck the Show Count Column and Show Name Column check boxes, as shown in Figure 9.76, and click Next to continue.
FIGURE 9.76 Choosing the display and order of your data-extraction columns
If you were further analyzing your data in a program such as Microsoft Excel, you could send the data extracted from your drawing to an external XLS file.
- Because our goal is to create a room schedule, choose the Insert Data Extraction Table Into Drawing check box and click Next.
After you've chosen to insert the data-extraction table into your drawing, the Data Extraction Wizard will prompt you to select which table style you would like to use along with a title for your table.
- Verify that the Schedule table style is selected inside the Table Style group of the dialog box, and then enter ROOM SCHEDULE in the Enter A Title For Your Table text box (see Figure 9.77). Click Next to continue.
- You've finished the Data Extraction Wizard; click Finish.
- Use the cursor to choose a location for your ROOM SCHEDULE near the DOOR SCHEDULE you created earlier (see the top of Figure 9.78).
FIGURE 9.77 Picking the table style to be used and entering a title for the table
FIGURE 9.78 Placing the ROOM SCHEDULE table (top), and the results of the data extraction (bottom)
Your ROOM SCHEDULE inserts to display the block attribute values from the A-ROOM-IDEN block in table form (see the bottom of Figure 9.78).
- Save your drawing as I09-17-DataExtraction.dwg (M09-7-DataExtraction.dwg).
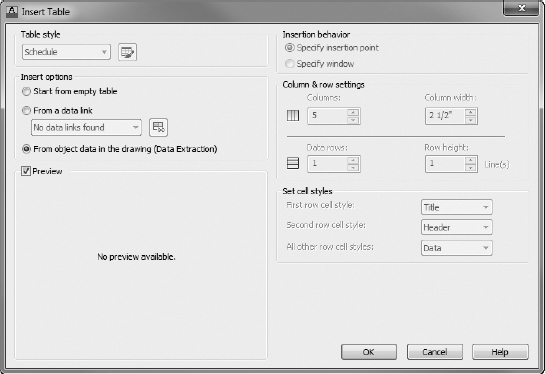
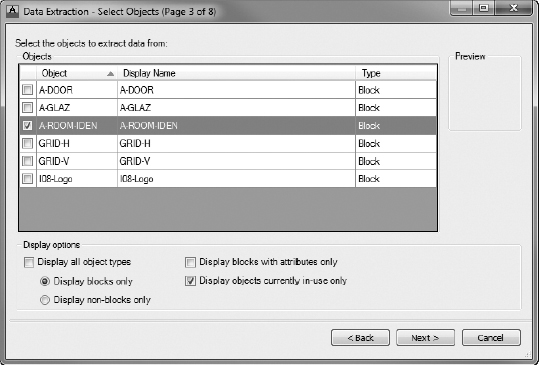
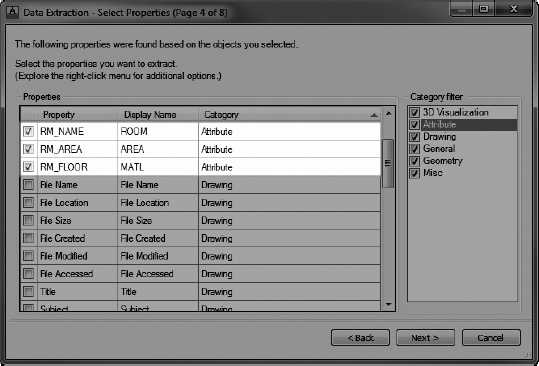
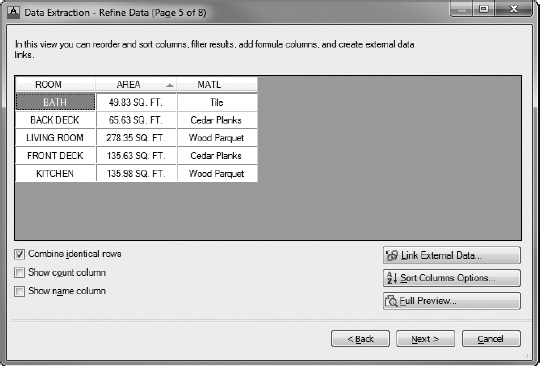
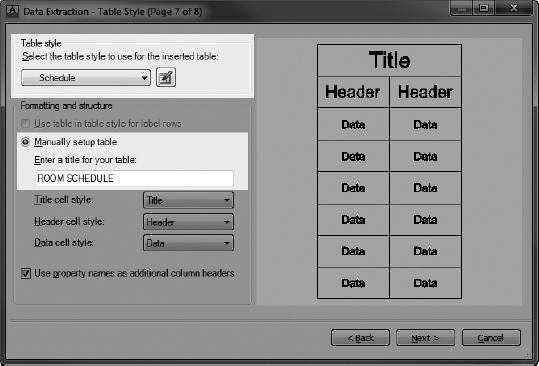
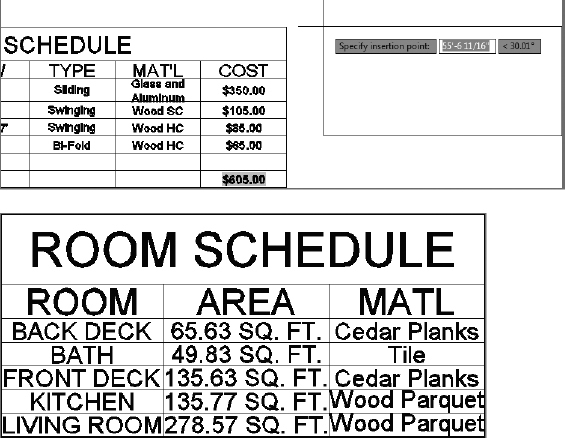
Modifying the Table Display
The ROOM SCHEDULE data extraction is now inserted into your drawing as an AutoCAD Table object. Although the correct table style is in use, its display needs to be tweaked:
- Make sure I09-17-DataExtraction.dwg (M09-17-DataExtraction.dwg) is open.
- Open the Properties palette from the View tab Palettes palette, and select the ROOM SCHEDULE table.
- Change the Table Width property within the Table group to 20′ (6 m), as shown in Figure 9.79.
FIGURE 9.79 Adjusting the width of the ROOM SCHEDULE table
- Select the ROOM cell (A2), press and hold the Shift key, and select the lower-right cell C7, as shown in Figure 9.80.
- Under the Cell heading within the Properties panel, change the Vertical Cell Margin property to 2″ (50 mm), as shown in Figure 9.81.
- Press Esc to deselect the ROOM SCHEDULE table.
- Save your drawing as I09A-FPLAYO.dwg (M09A-FPLAYO.dwg).
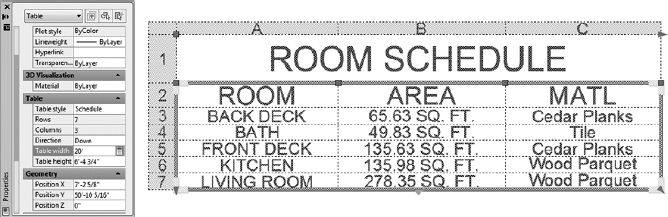
Your final table should look like the one shown in Figure 9.82.
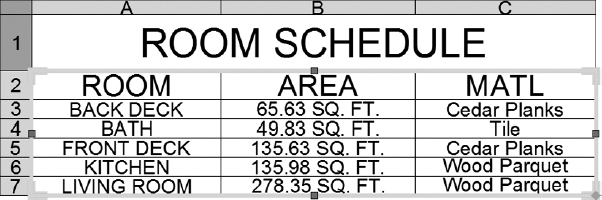
FIGURE 9.80 Selecting multiple table cells
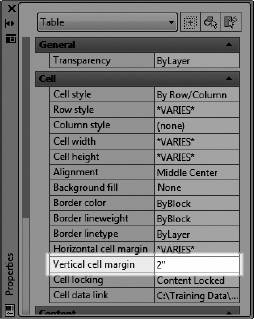
FIGURE 9.81 Modifying the Vertical Cell Margin property
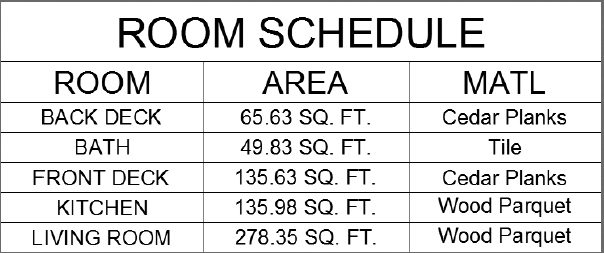
FIGURE 9.82 The completed ROOM SCHEDULE table
This concludes the chapter on dynamic blocks and tables. In the next chapter, you'll look at adding the elevations to the drawings.
This has been a quick tour of the features of attributes and the commands used to set them up and modify the data they contain. In the process, you saw several ways that you can use attributes in an AutoCAD drawing. If you continue to work with attributes, you'll find them to be a powerful tool and a way to link information in your AutoCAD drawing to other applications. You also explored the methods for creating dynamic blocks that change as required to match your drawing's needs. Finally, you created a table to display the door schedule information and added a formula to calculate the total cost.
If You Would Like More Practice…
Blocks and attributes are commonly used in title blocks. For more practice using attributes, you can try the following:
- Replace the title block text with attributes.
- Add attributes to the window blocks.
- Experiment with the dynamic block functionality by creating window blocks that can be dragged to the appropriate width without resorting to scaling the blocks.
- Add a window schedule to calculate the cost of the cabin's windows.